
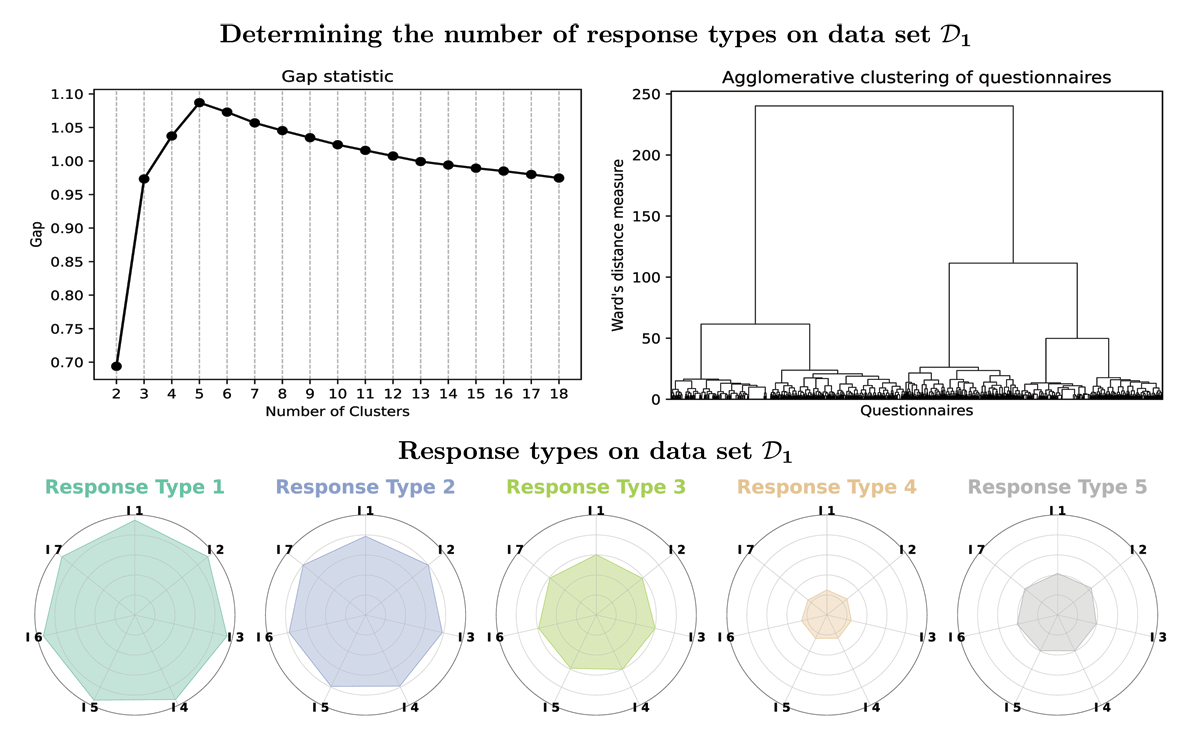
Figure 1
Graphical representation of the gap statistic as well as the dendrogram corresponding to the goodness of the clustering of the questionnaires in data set . Moreover, the corresponding response types are shown as a spider plot.
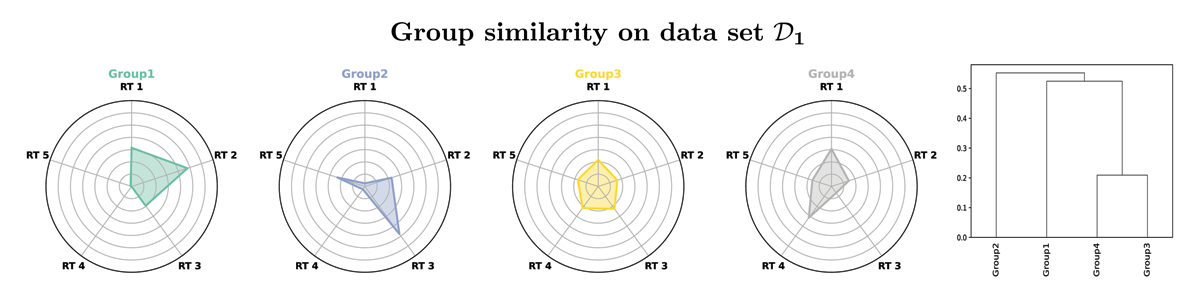
Figure 2
The fingerprints of the different groups regarding the response types as spider plots. The radial y-axes are scaled to (0, 0.7). Also, the group similarity on data set is given by a dendrogram.
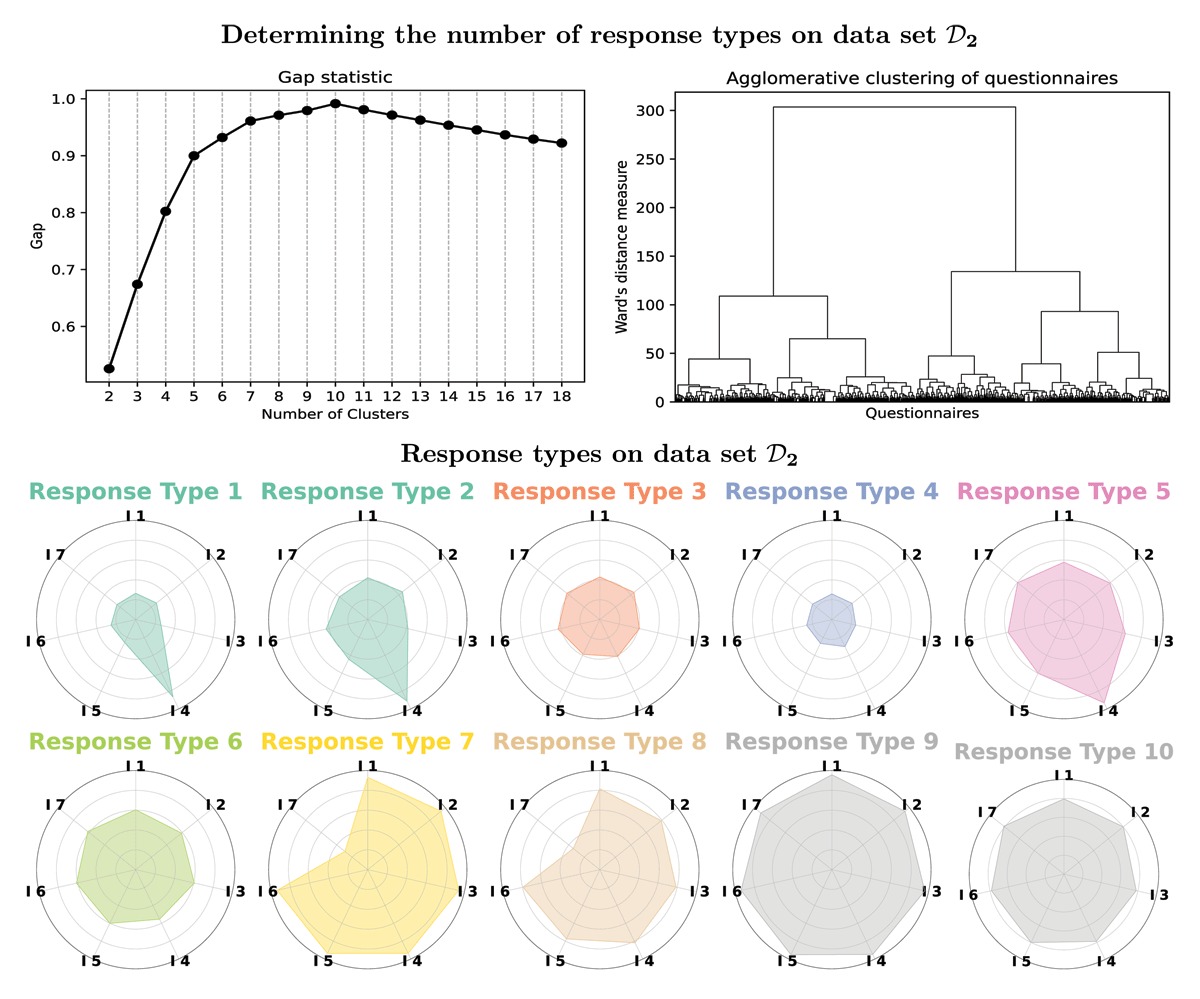
Figure 3
Graphical representation of the gap statistic as well as the dendrogram corresponding to the goodness of the clustering of the questionnaires in data set . Moreover, the corresponding response types are shown as a spider plot.
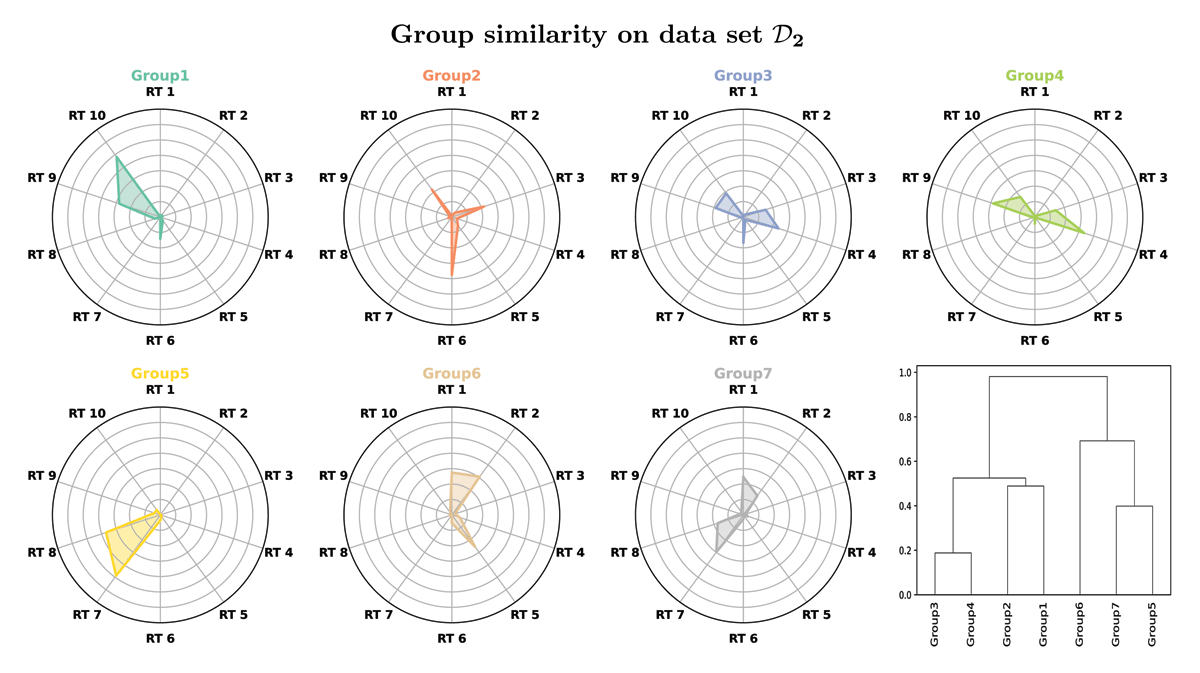
Figure 4
The fingerprints of the different groups regarding the response types as spider plots. The radial y-axes are scaled to (0, 0.7). Moreover, the group similarity on data set is shown as a dendrogram.
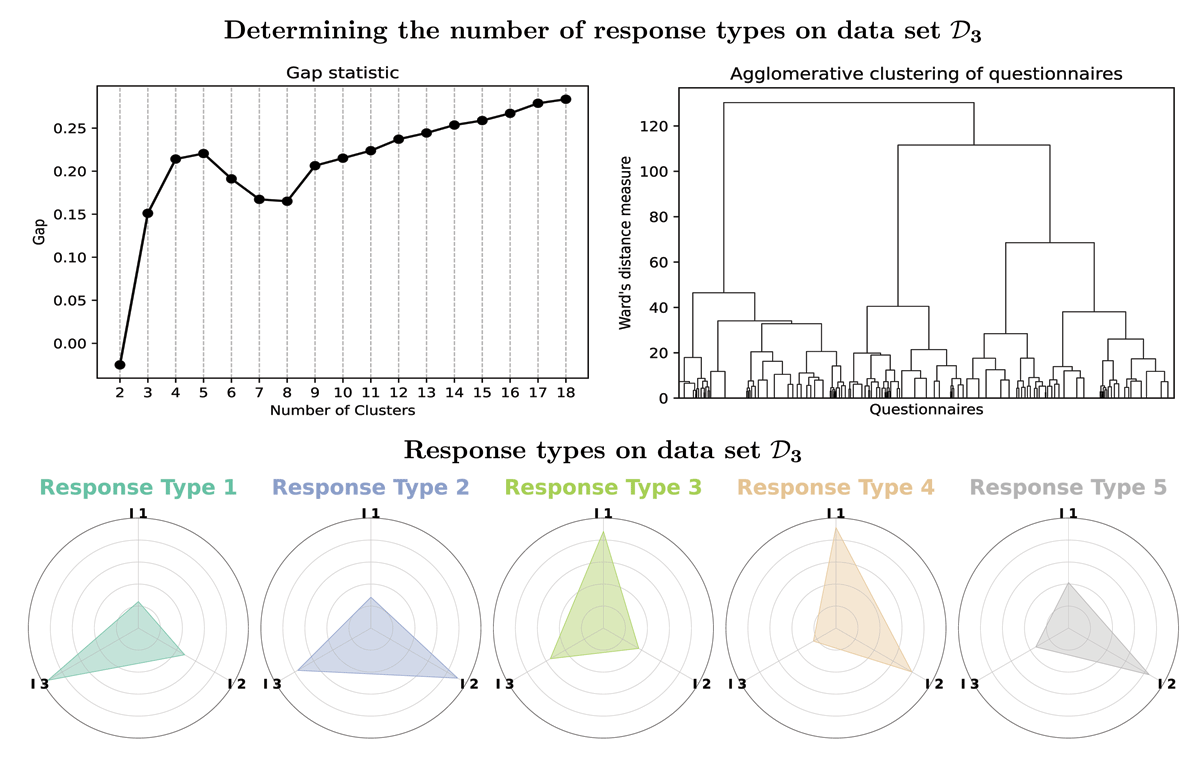
Figure 5
Graphical representation of the gap statistic as well as the dendrogram corresponding to the goodness of the clustering of the questionnaires in data set . Moreover, the corresponding response types are shown as a spider plot.
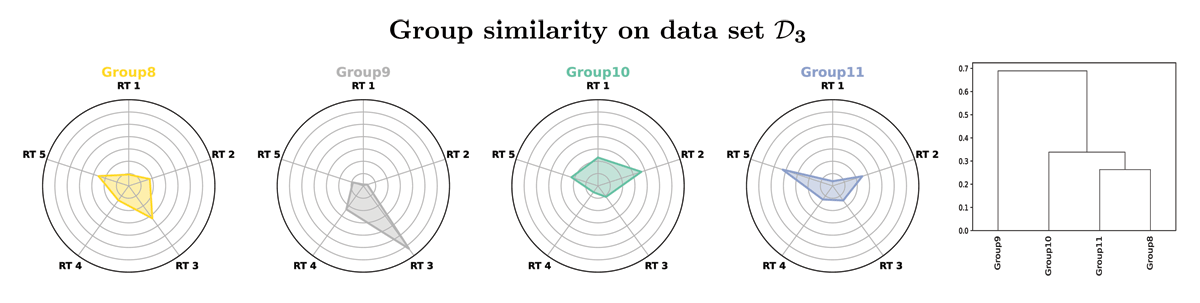
Figure 6
The fingerprints of the different groups regarding the response types as spider plots. The radial y-axes are scaled to (0, 0.7). Again, the group similarity on data set is visualized by a dendrogram.
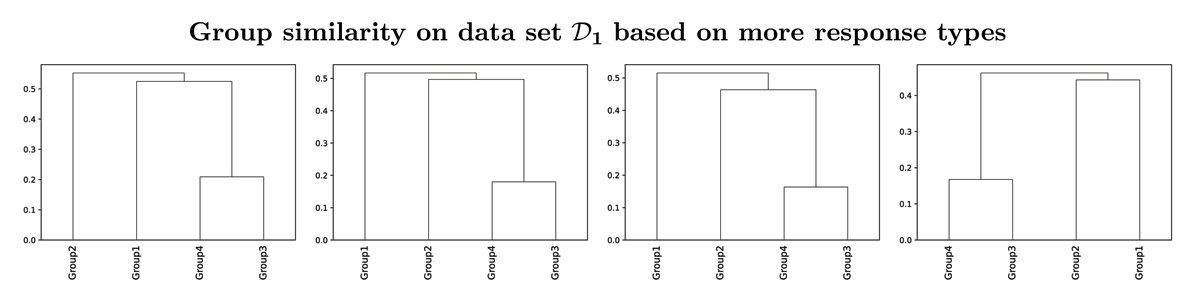
Figure 7
The similarity between the groups in data set for a growing number of response types (left: 5 response types, right: 8 response types). The similarity based on the optimal number of response types (5) gives no significantly different result as the similarity based on more response types.
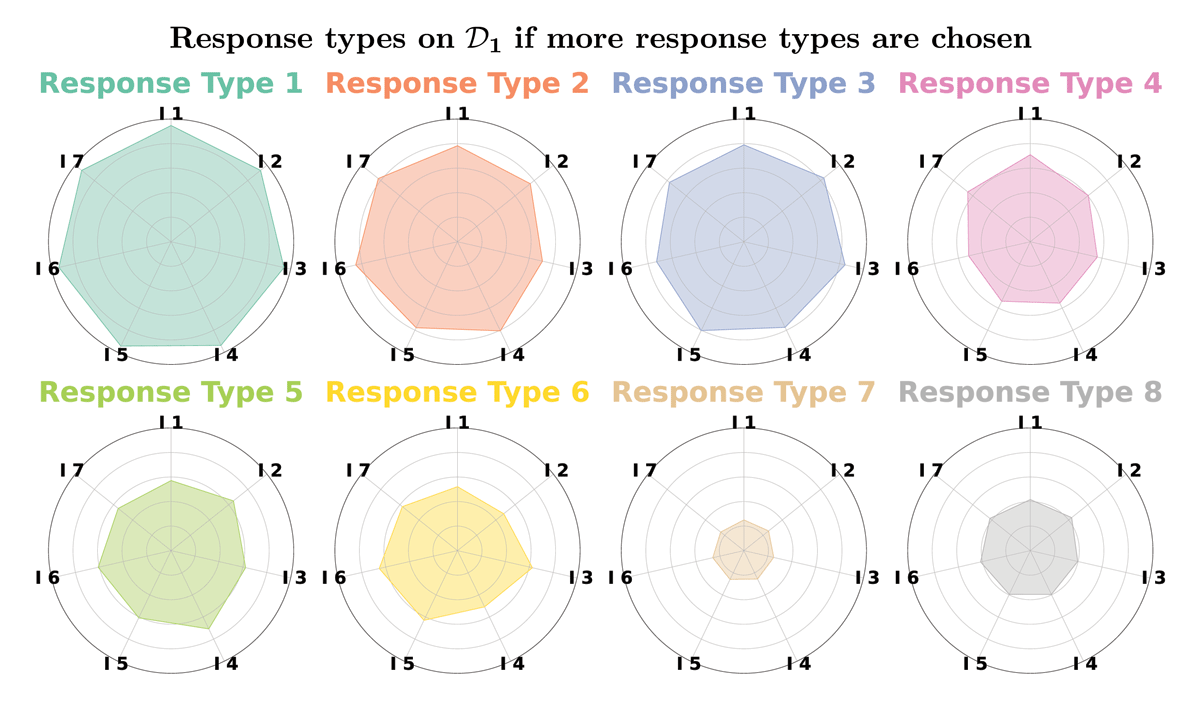
Figure 8
The eight response types on data set . While the similarity between group fingerprints does not vary if more response types are used, the response types themselves are much worse separated.