
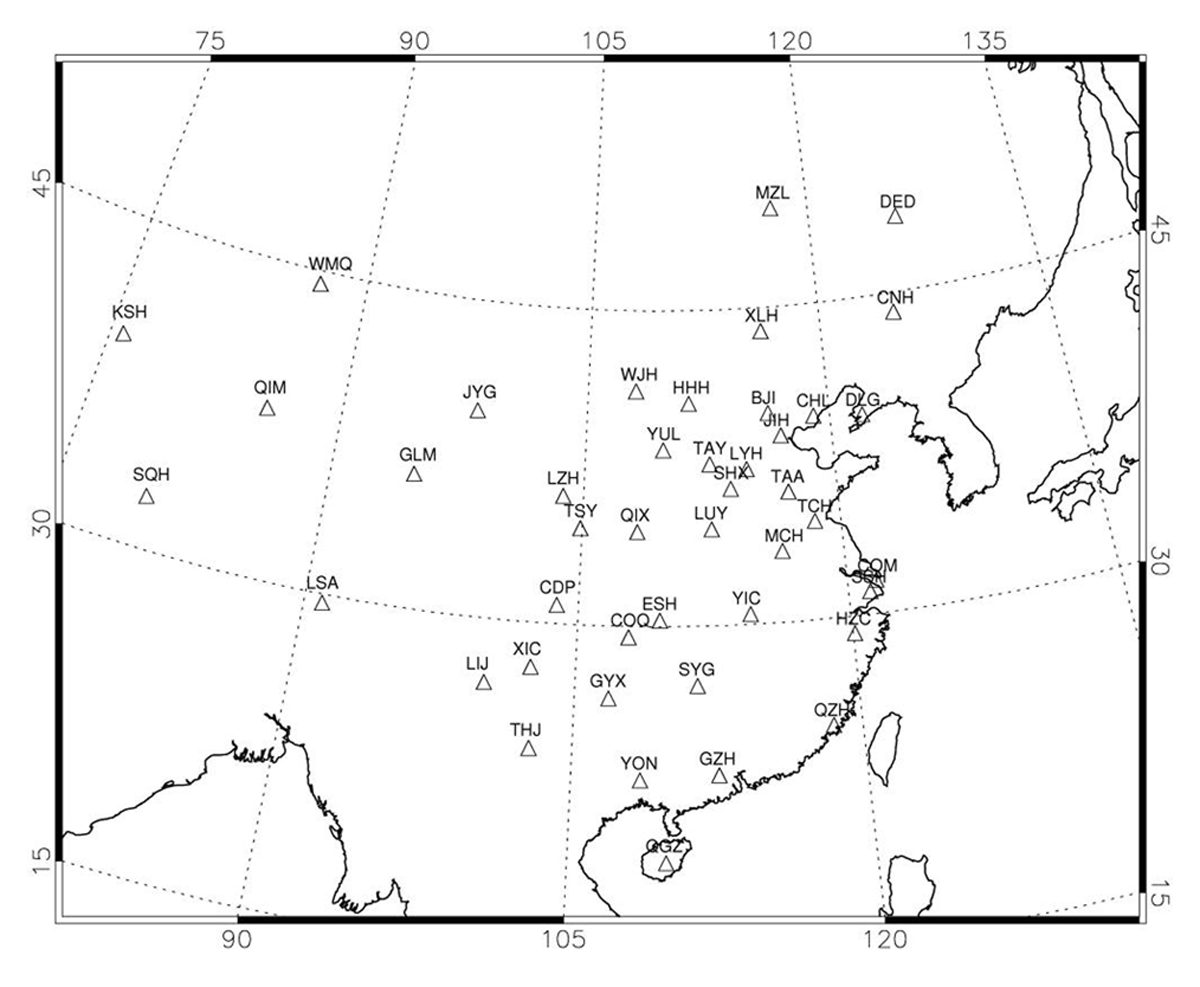
Figure 1
Distribution map of geomagnetic observatories in mainland China.
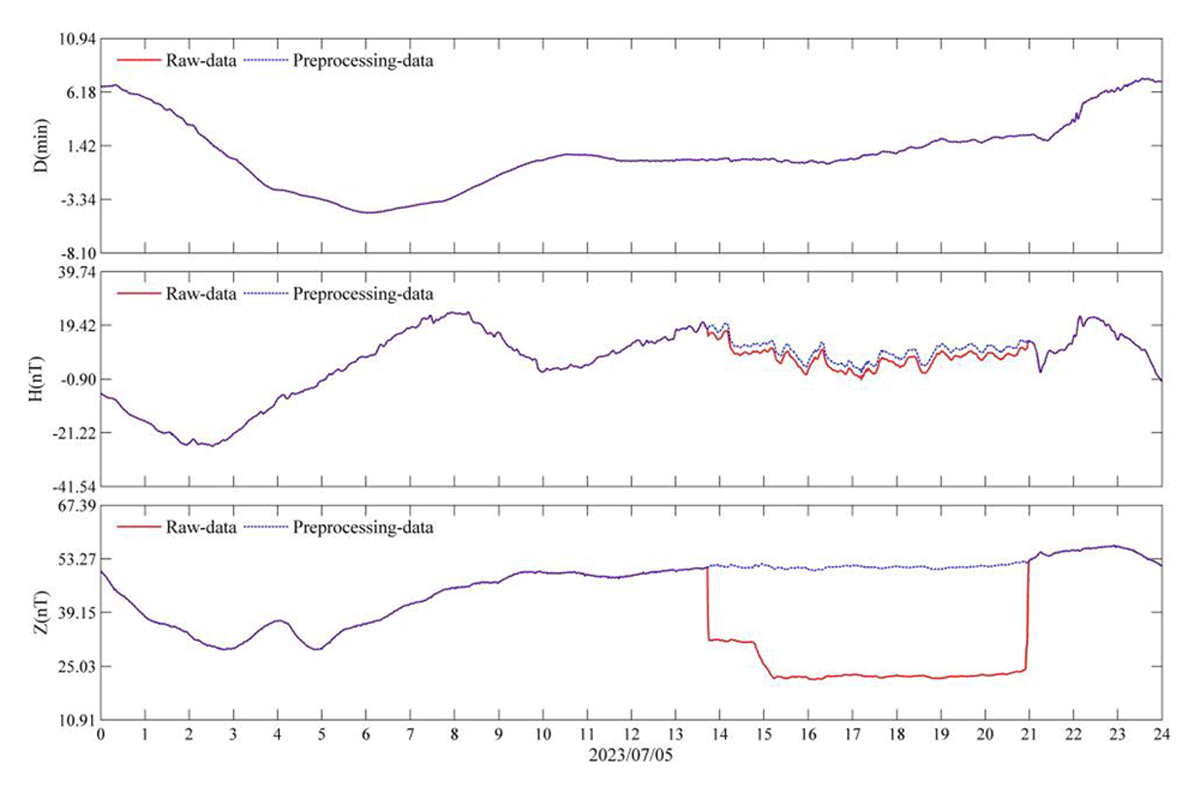
Figure 2
Comparison of daily variable curve before and after data processing.
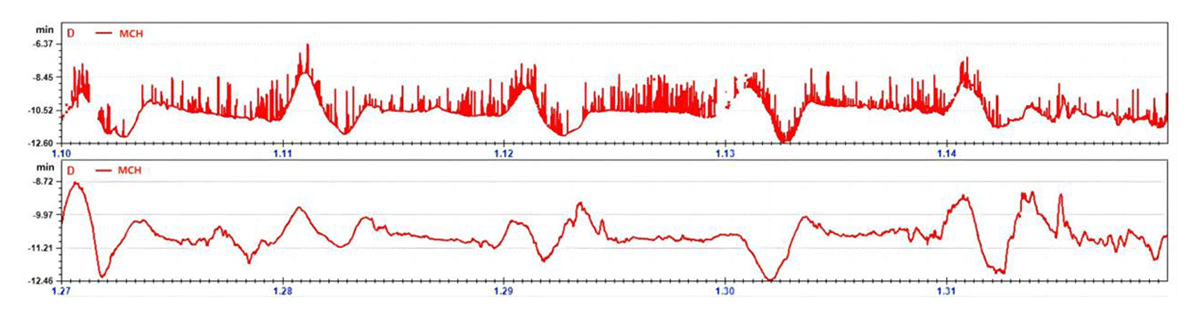
Figure 3
The daily variation curves before and after taking dehumidifying measures.
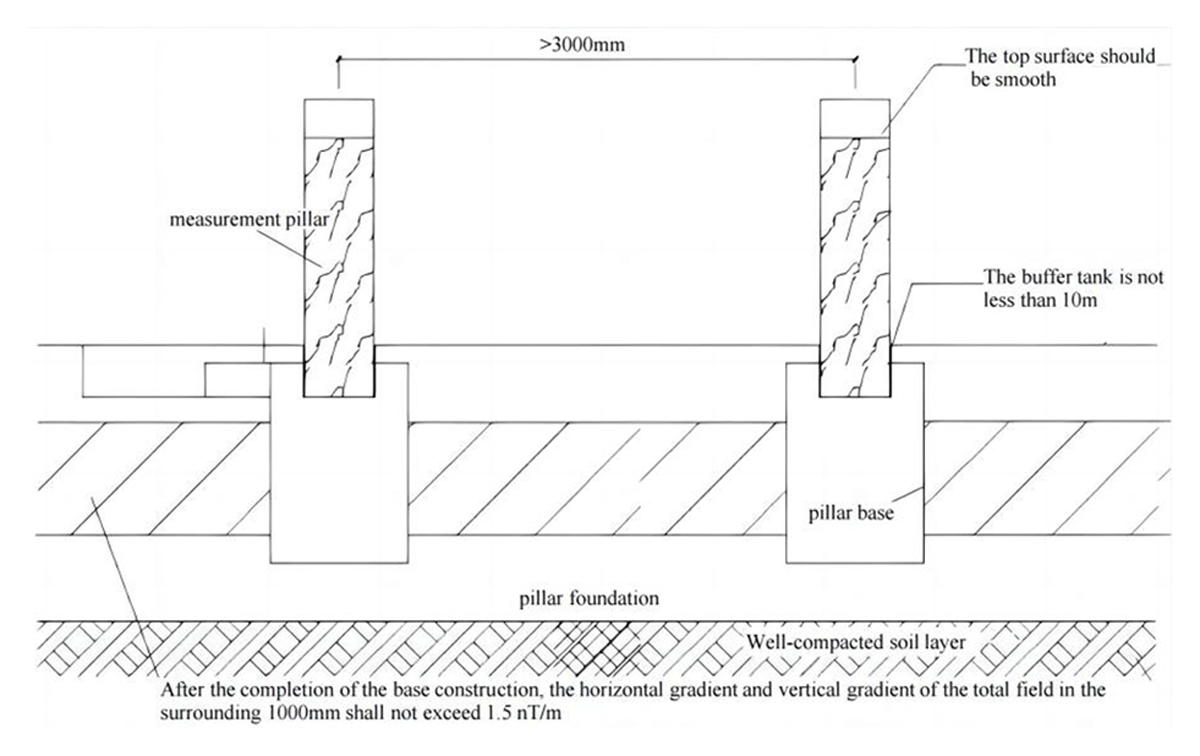
Figure 4
Schematic diagram of the observation pier construction plane.
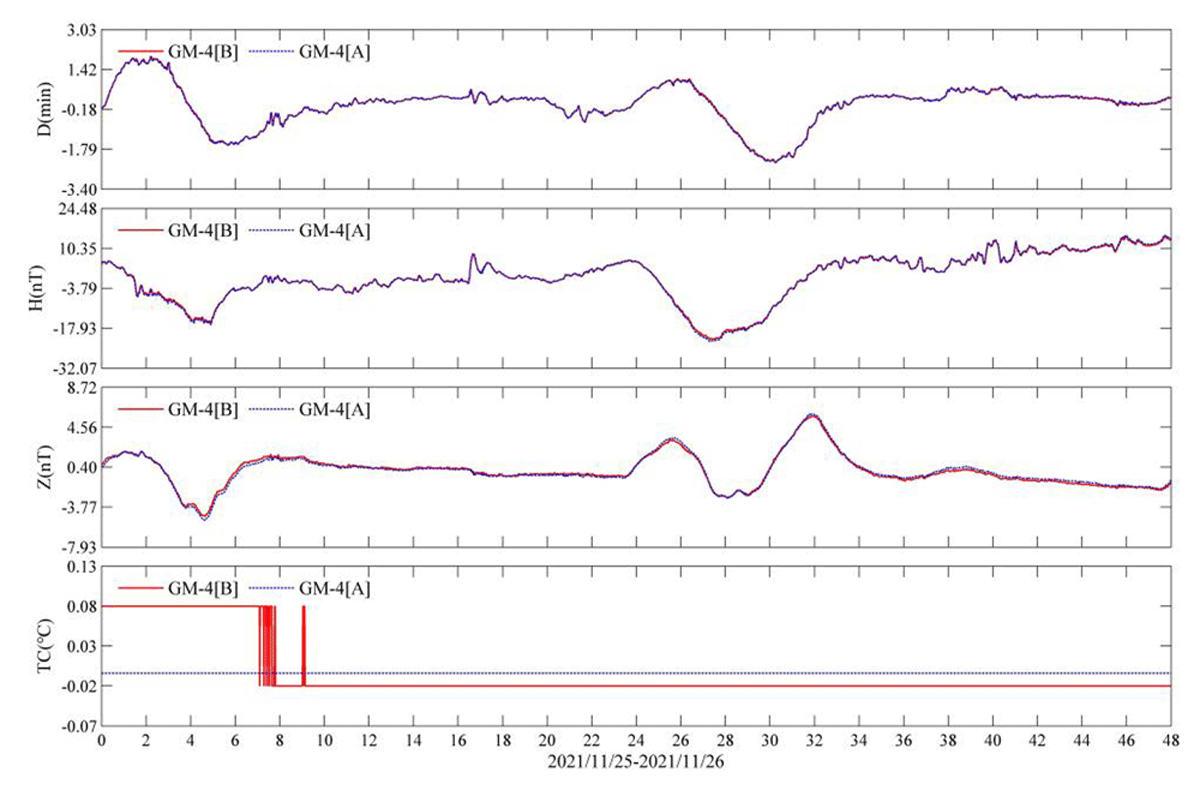
Figure 5
Comparison of the daily variation curves of two sets of instruments installed at different measuring points.
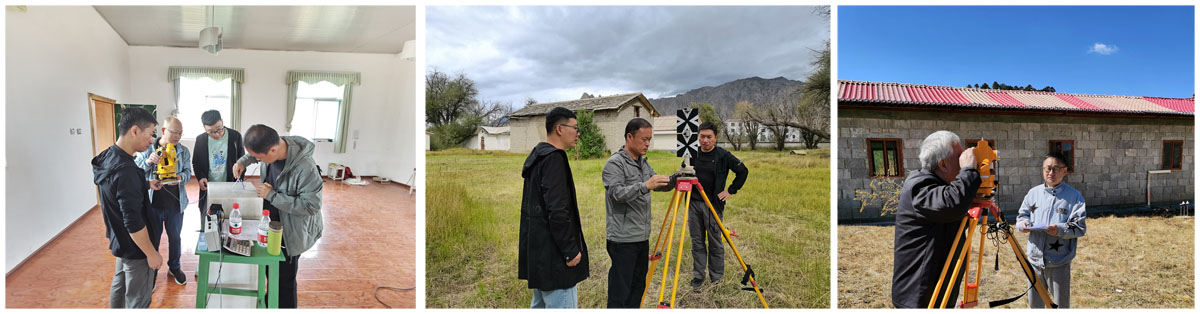
Figure 6
Re-measurement of azimuth.