
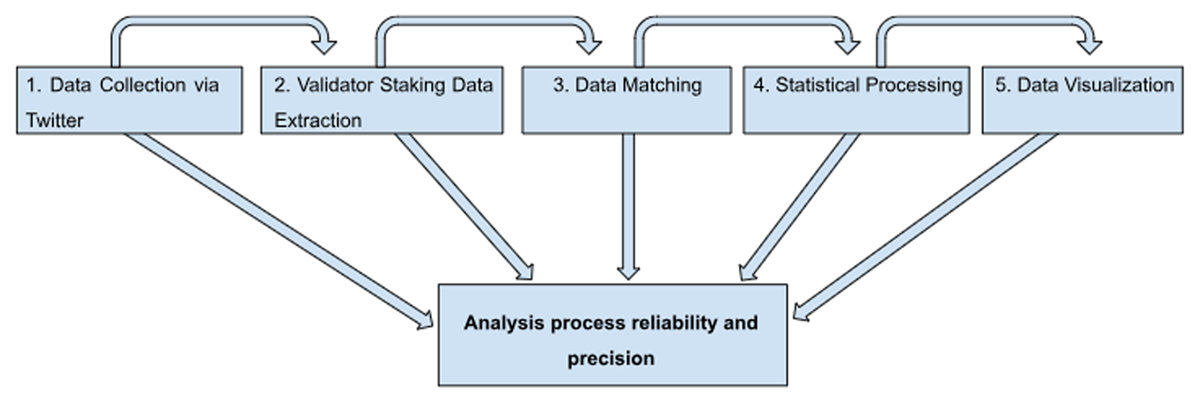
Figure 4.1
Research Process Structure.
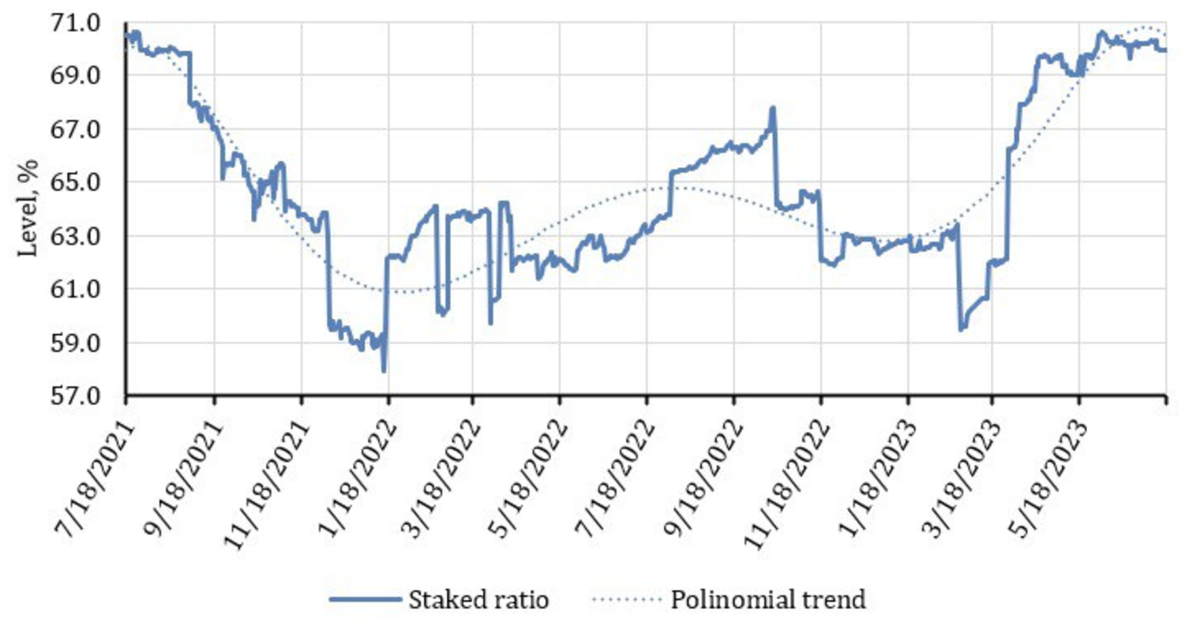
Figure 5.1
Dynamics of changes in staked ratio over time.
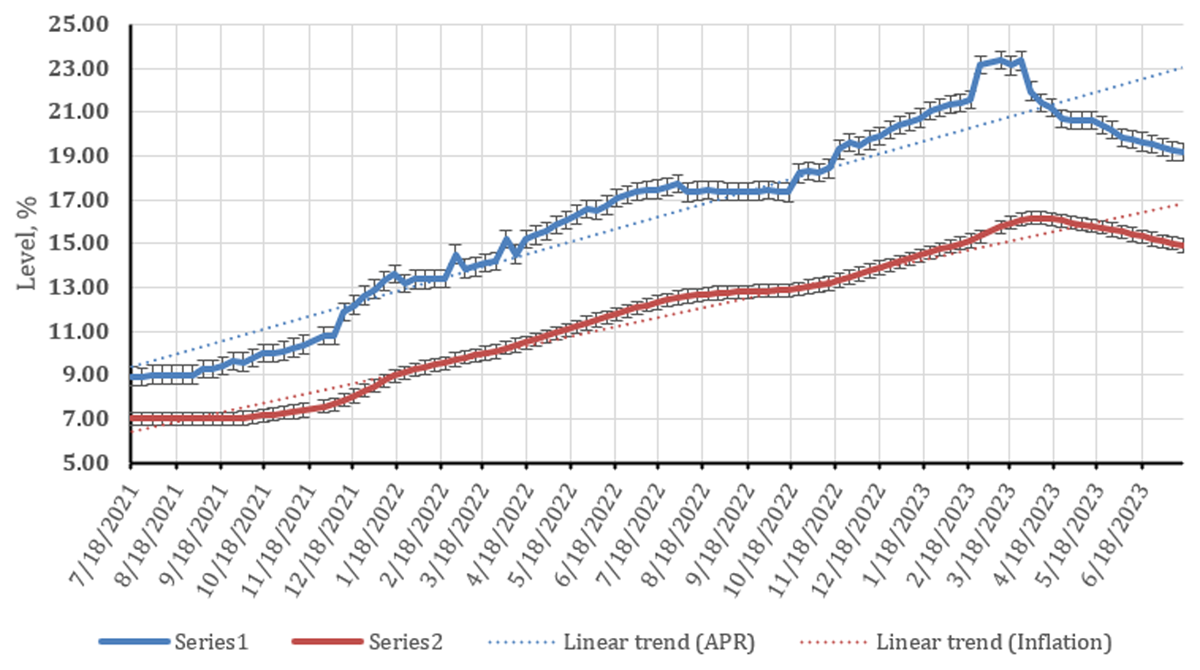
Figure 5.2
Dynamics of changes in APR and inflation over time.
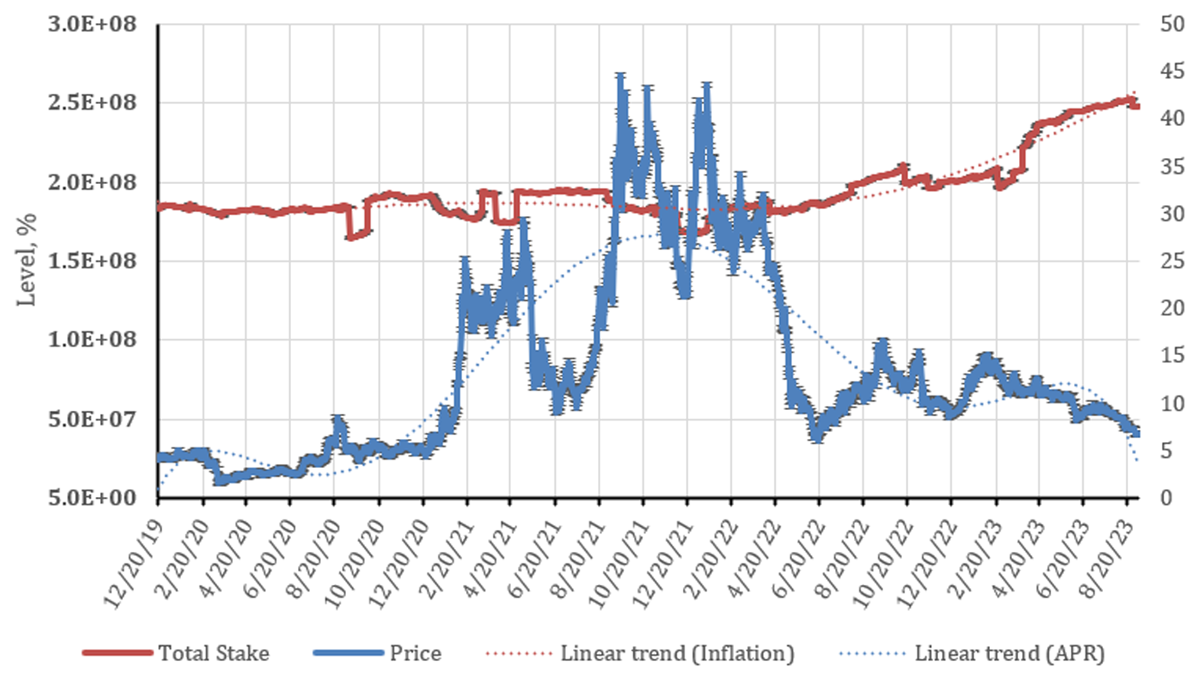
Figure 5.3
Dynamics of total stake and ATOM price change over time
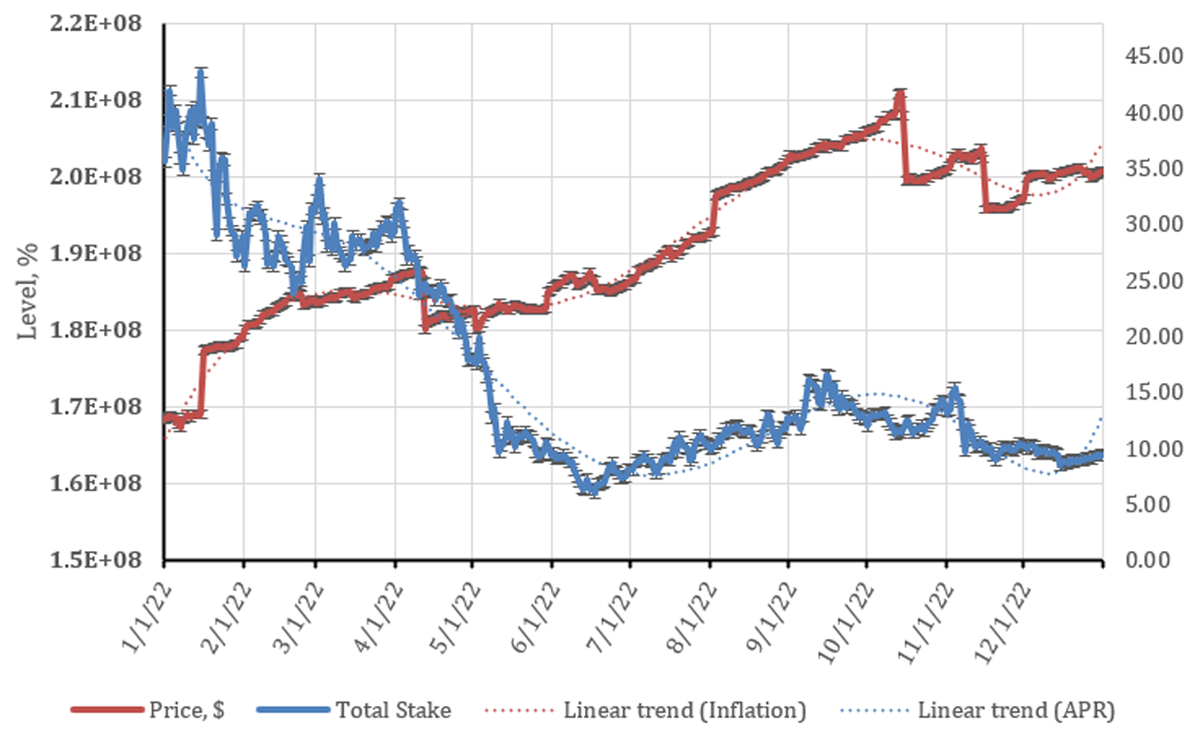
Figure 5.4
Dynamics of total stake and ATOM price change for the period of 2022.
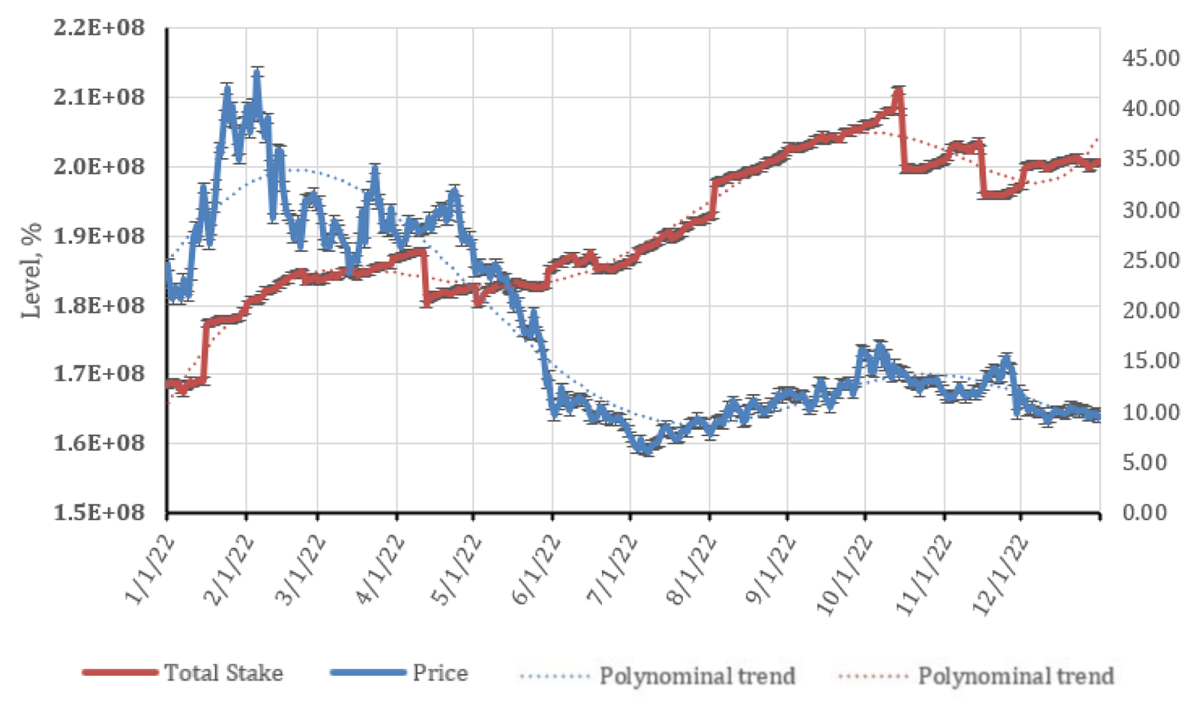
Figure 5.5
Dynamics of total stake change (21-day shift) and ATOM price change over the period 2022.
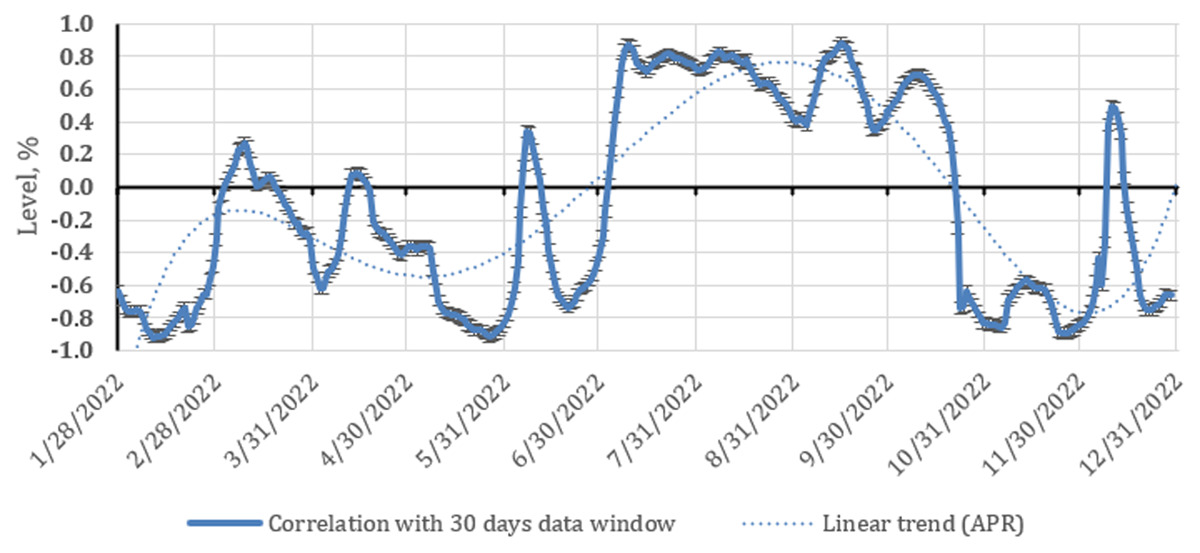
Figure 5.6
Dynamics of change in the correlation with 30 days data window of total stake and ATOM price change over the period of 2022.
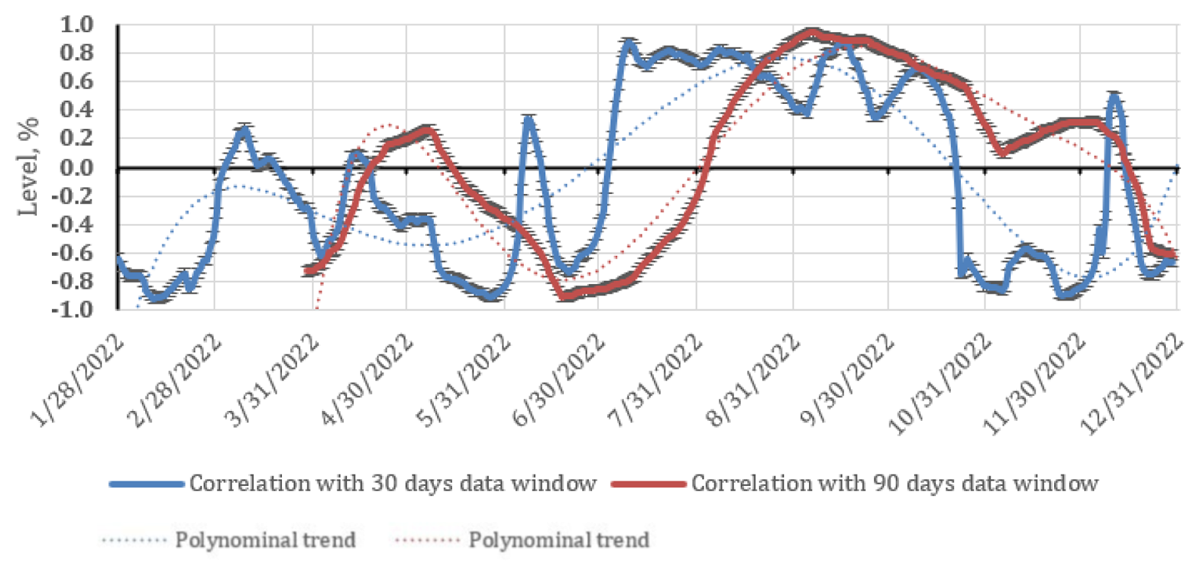
Figure 5.7
Evolution of the correlation (with a monthly and quarterly window) of total stake and ATOM price change over the period 2022.
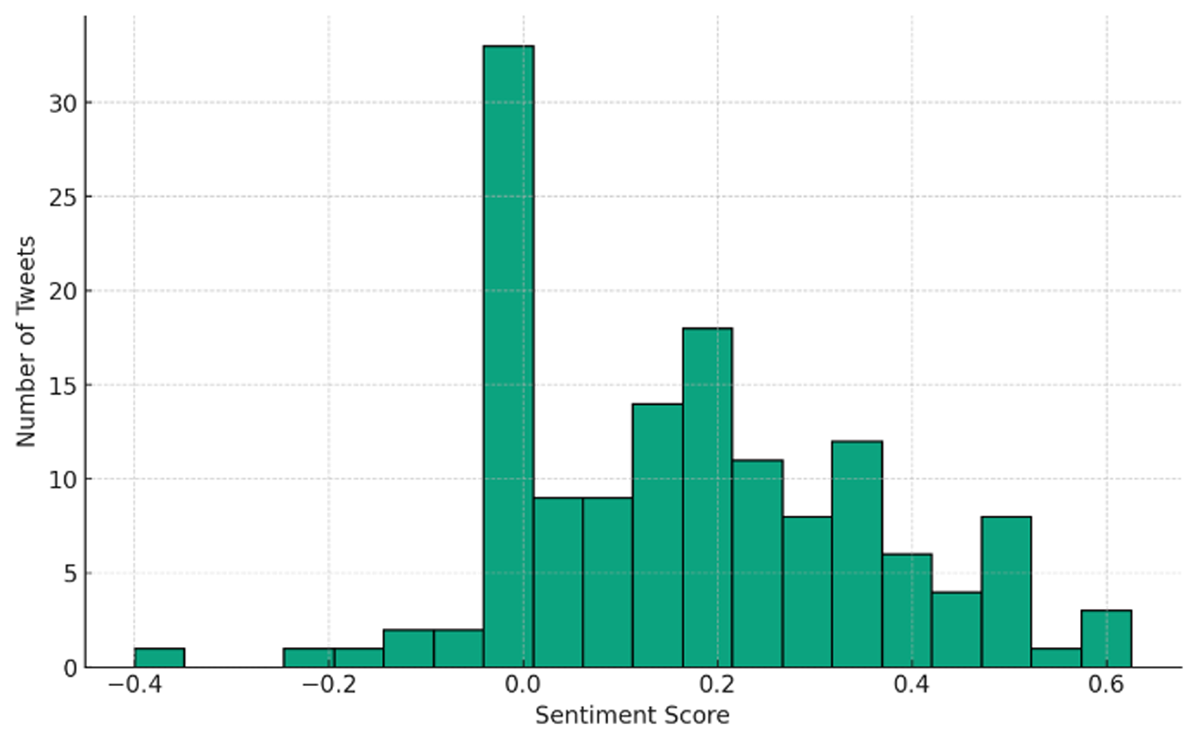
Figure 5.8
Distribution of sentiment score for tweets related to the vote on Proposal #797.
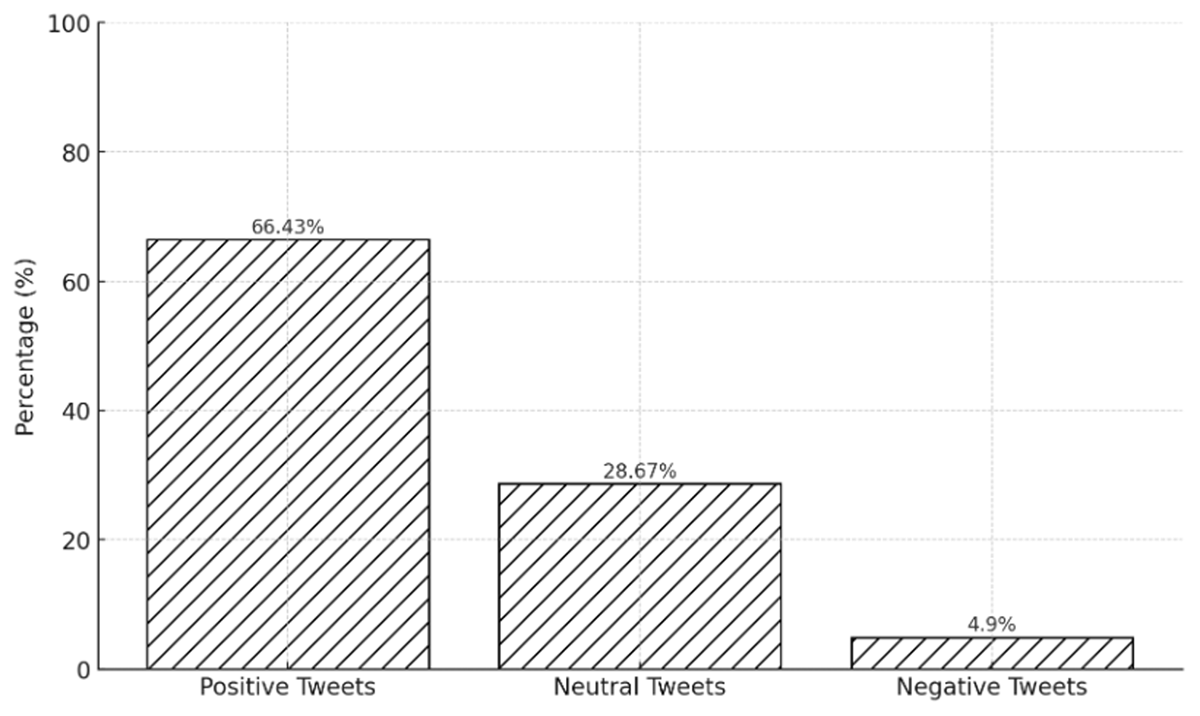
Figure 5.9
Distribution of sentiment classification for tweets related to the vote on Proposal #797.
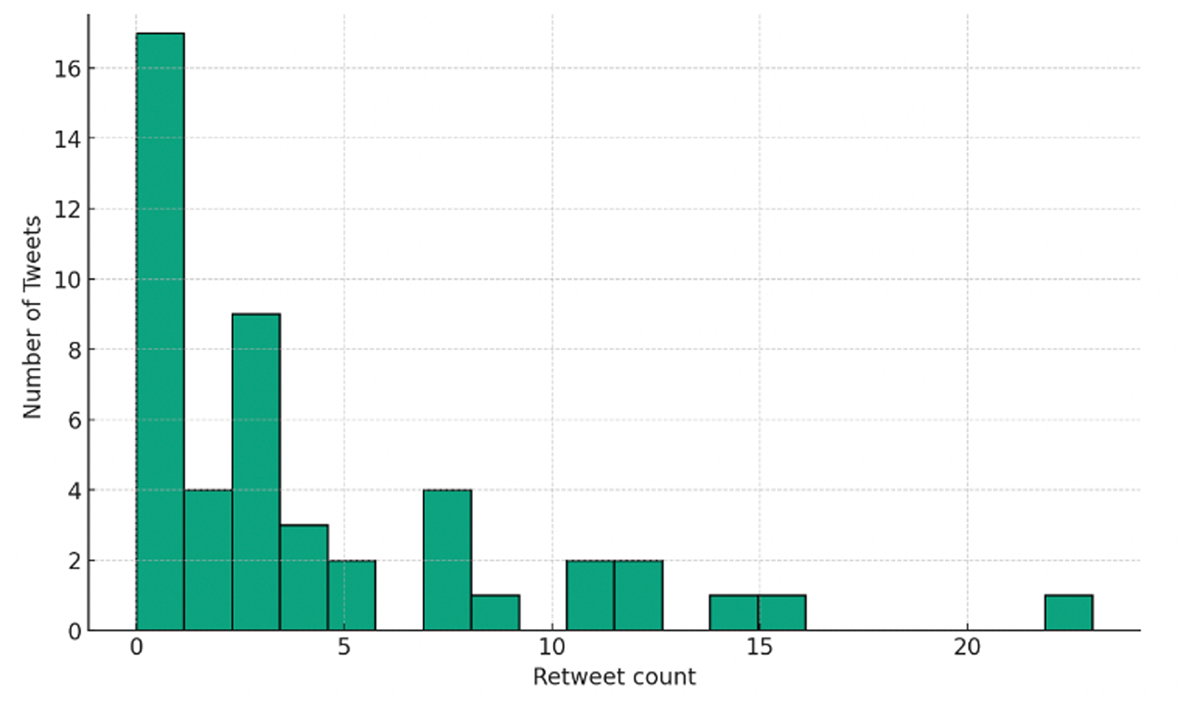
Figure 5.10[a]
Distribution of retweets for tweets related to the vote on Proposal #797.
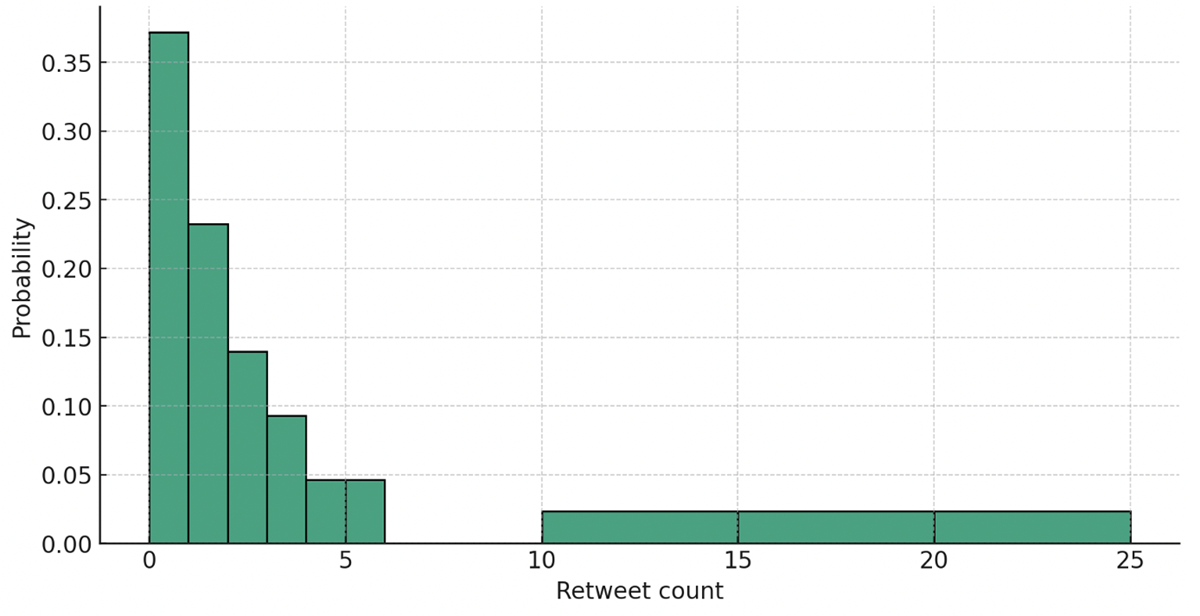
Figure 5.10[b]
Normalized distribution of retweets for tweets related to the vote on Proposal #797.
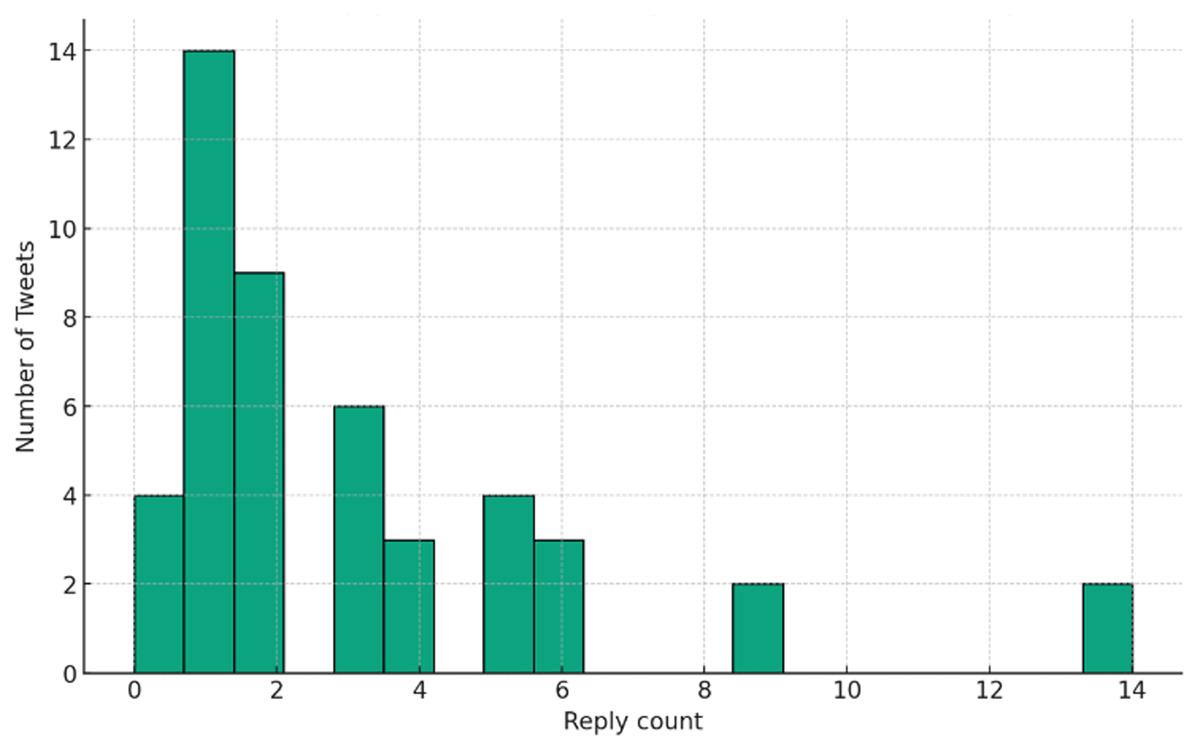
Figure 5.11[a]
Distribution of reply for tweets related to the vote on Proposal #797.

Figure 5.11[b]
Normalized distribution of reply for tweets related to the vote on Proposal #797.
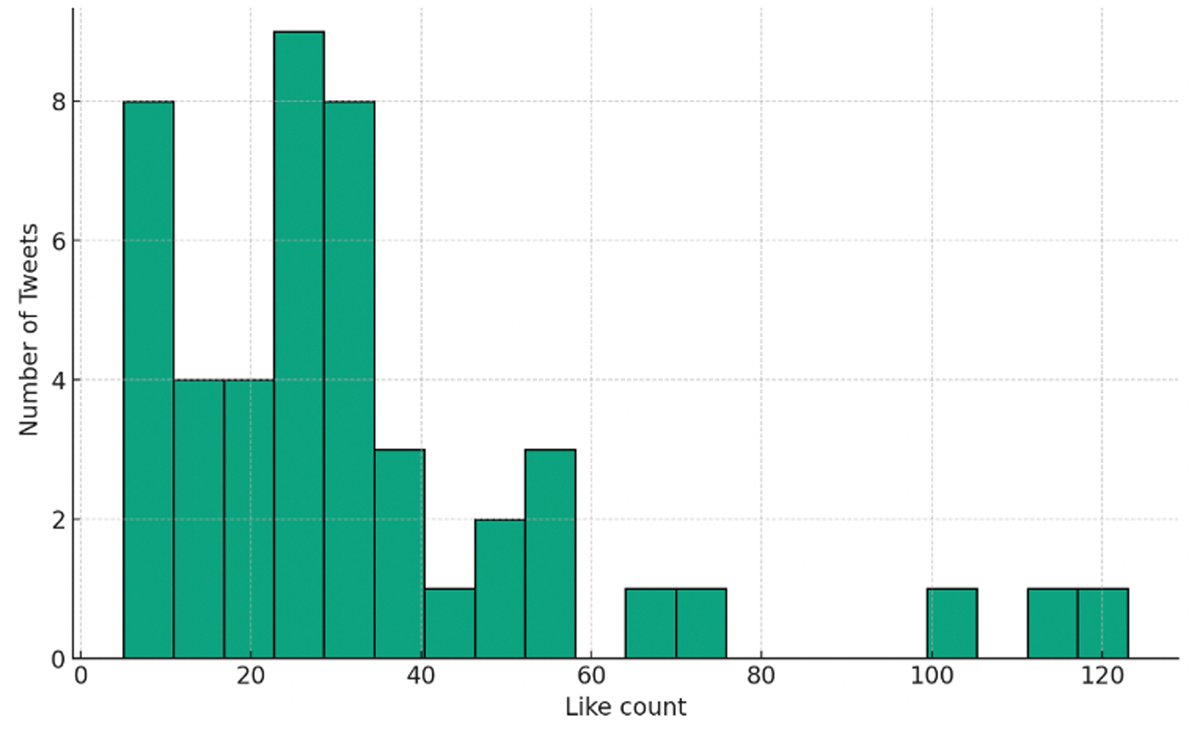
Figure 5.12[a]
Distribution of likes for tweets related to the vote on Proposal #797.
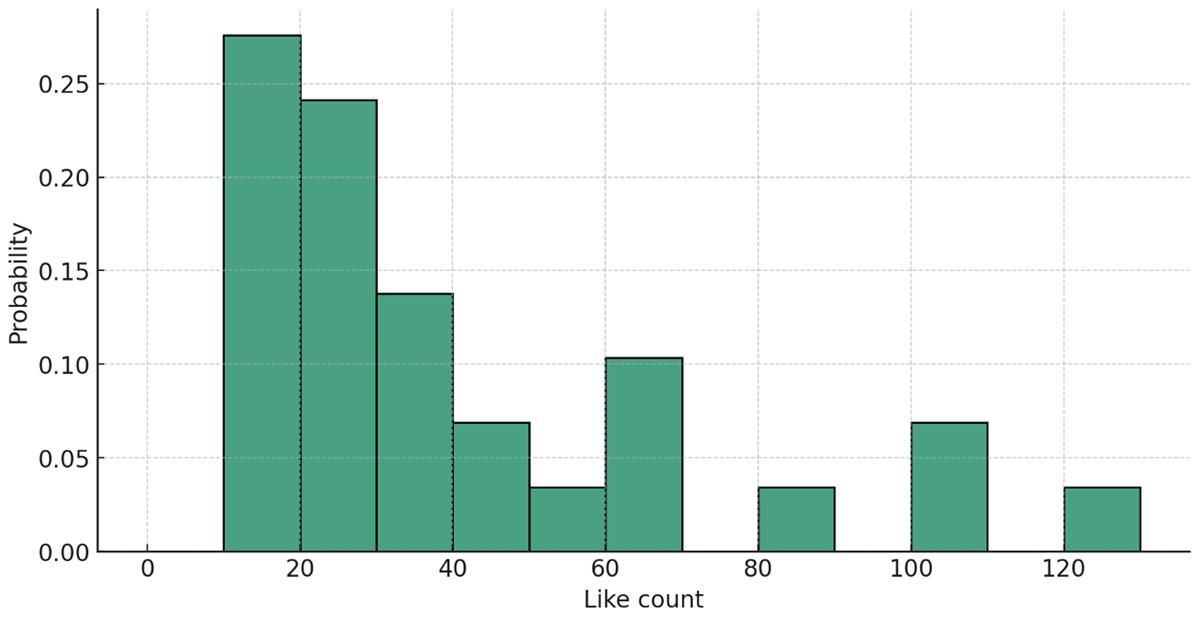
Figure 5.12[b]
Normalized distribution of likes for tweets related to the vote on Proposal #797.
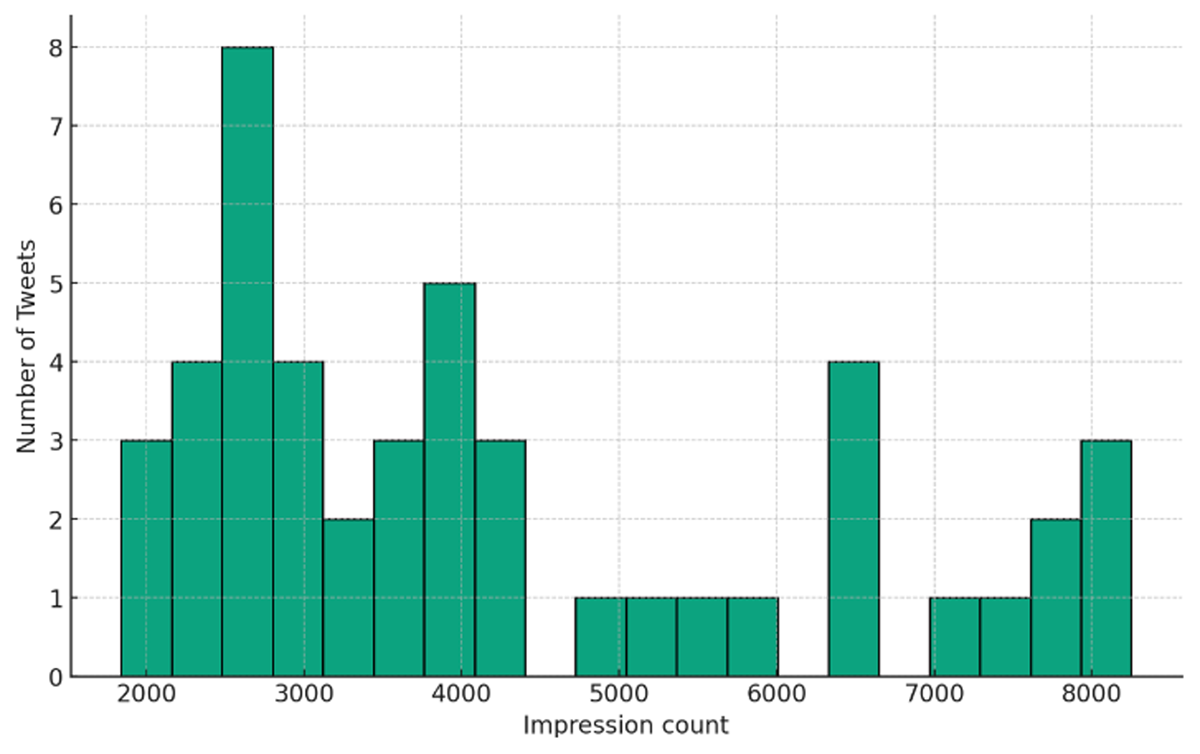
Figure 5.13[a]
Distribution of impressions for tweets related to the vote on Proposal #797.
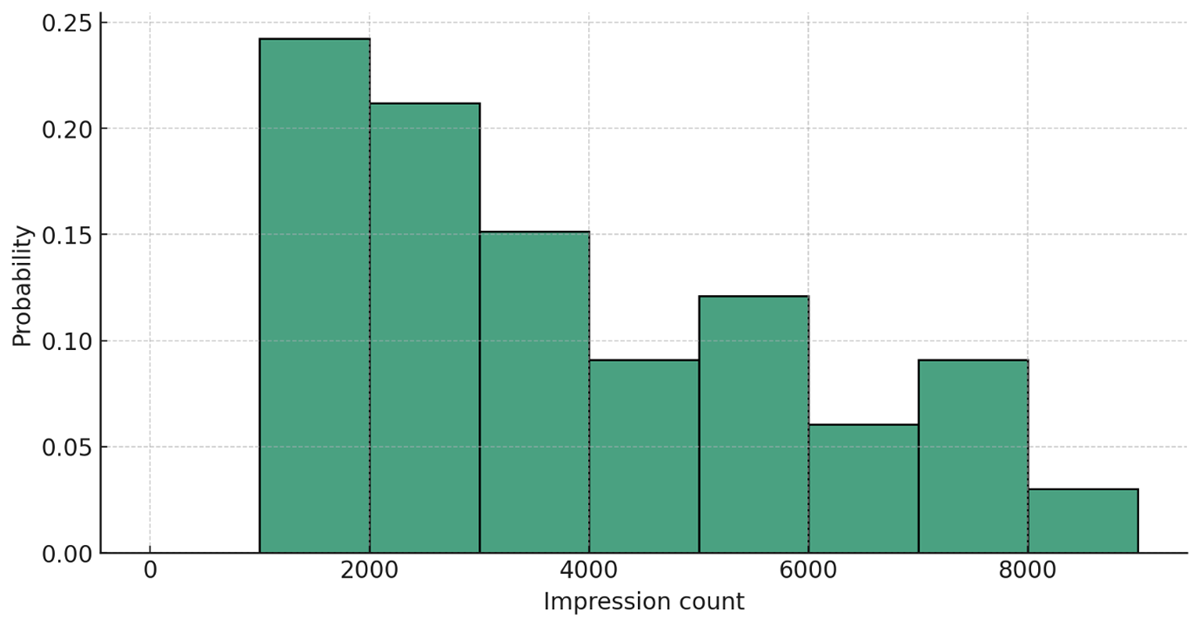
Figure 5.13[b]
Normalized distribution of impressions for tweets related to the vote on Proposal #797.
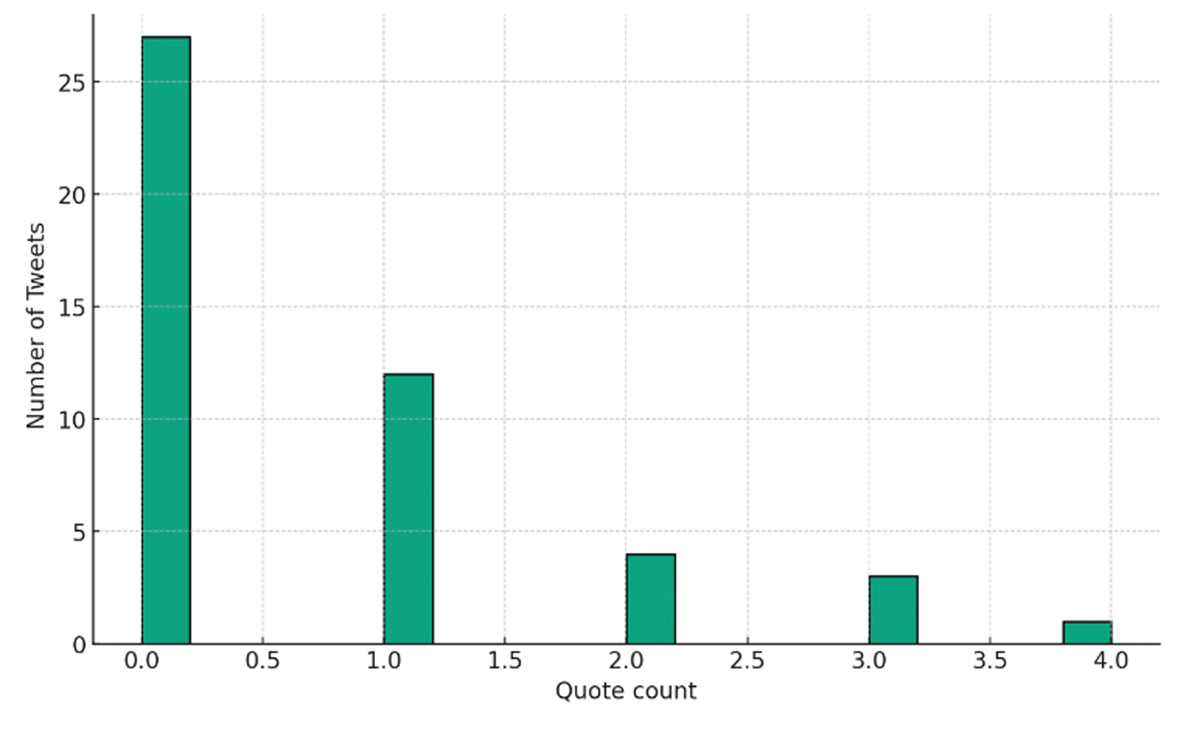
Figure 5.14
Distribution of quotes for tweets related to the vote on Proposal #797.
Table 5.1
Analyzing sentiment of tweets related to Proposal #797.
| Avg. sentiment | 0.1734 |
| Positive tweets | 66.43% |
| Neutral tweets | 28.67% |
| Negative tweets | 4.90% |
Table 5.2
Interaction analysis of tweets related to Proposal #797.
| Avg. number of retweets | 4.23 |
| Avg. number of answers | 3.57 |
| Avg. number of likes | 41.21 |
| Avg. number of citations | 0.78 |
| Avg. number of impressions | 4521.94 |
Table 5.3
Comparison with voting results of Proposal #797.
| Votes ‘FOR’ | 86.07% (101,237,334 ATOM) |
| Votes ‘AGAINST’ | 13.92% (16,374,473 ATOM) |
| VETO votes | 0.01% (6,738 ATOM) |
| Abstentions | 12.53% (16,847,684 ATOM) |
| Turnout | 54.7% (134,466,229 ATOM) |
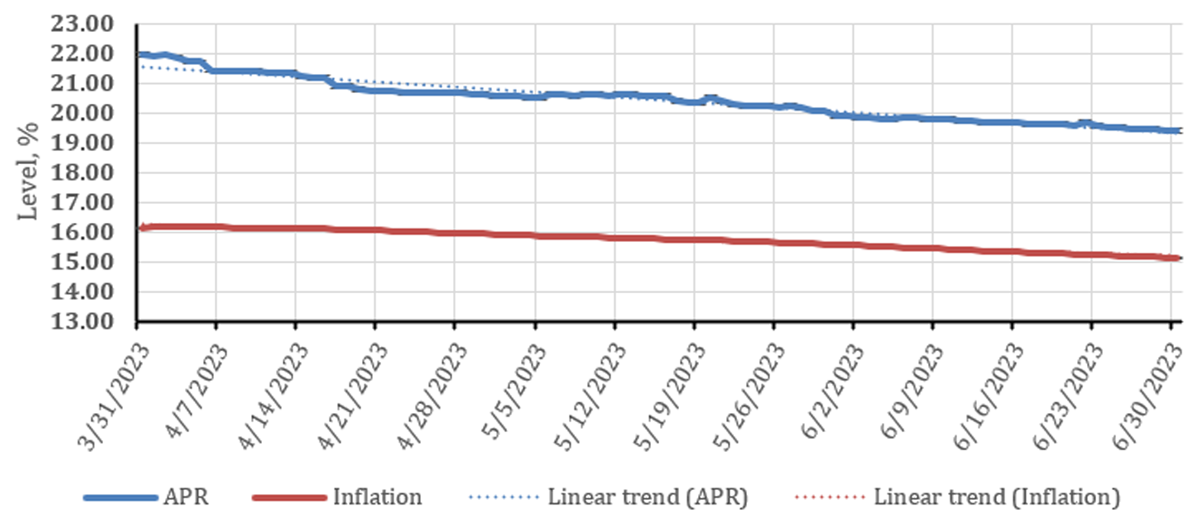
Figure 5.15
Dynamics of changes in APR and inflation over time.
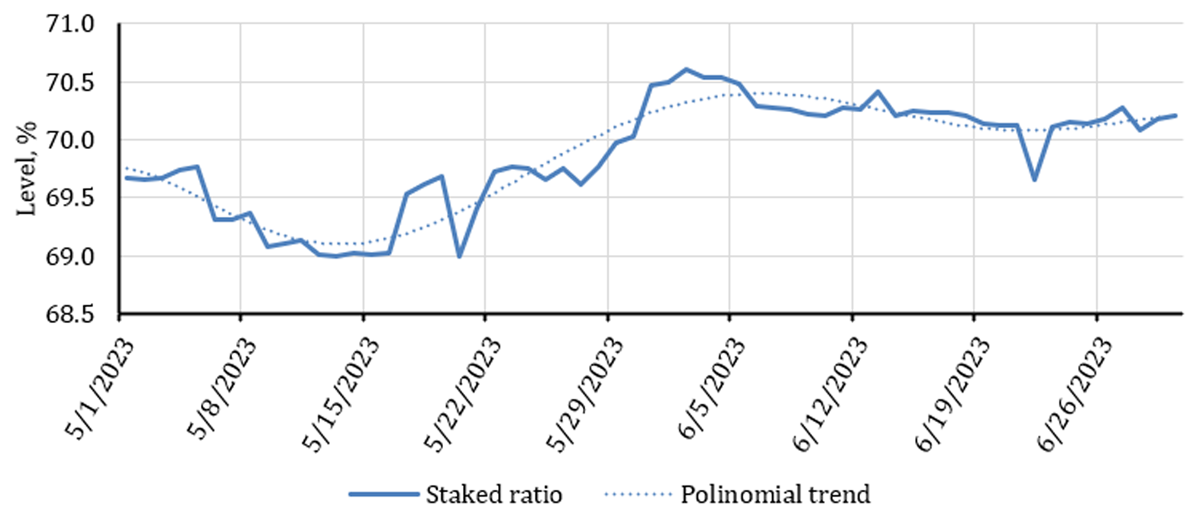
Figure 5.16
Dynamics of changes in staked ratio over time.
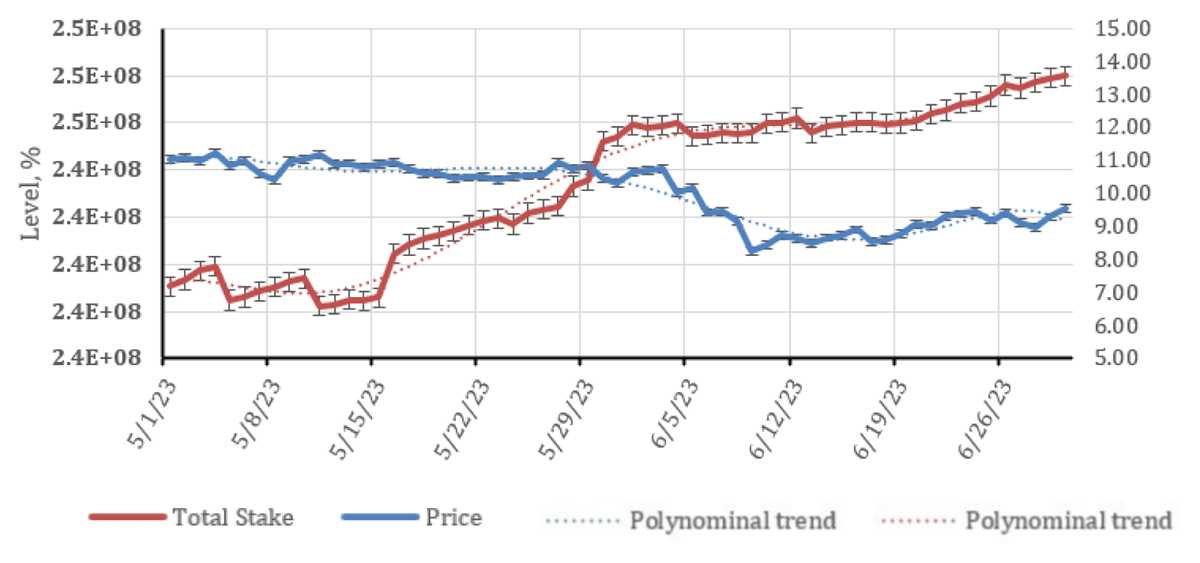
Figure 5.17
Dynamics of total stake and ATOM price change.
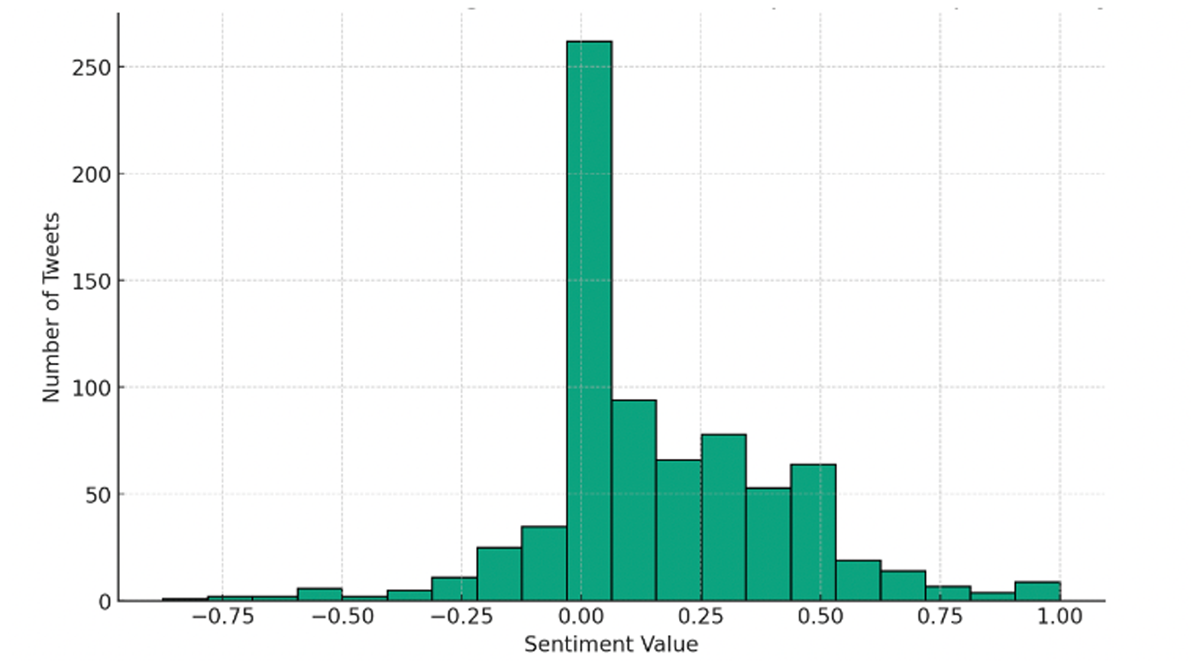
Figure 5.18
Distribution of sentiment score for tweets related to the vote on Proposal #88.
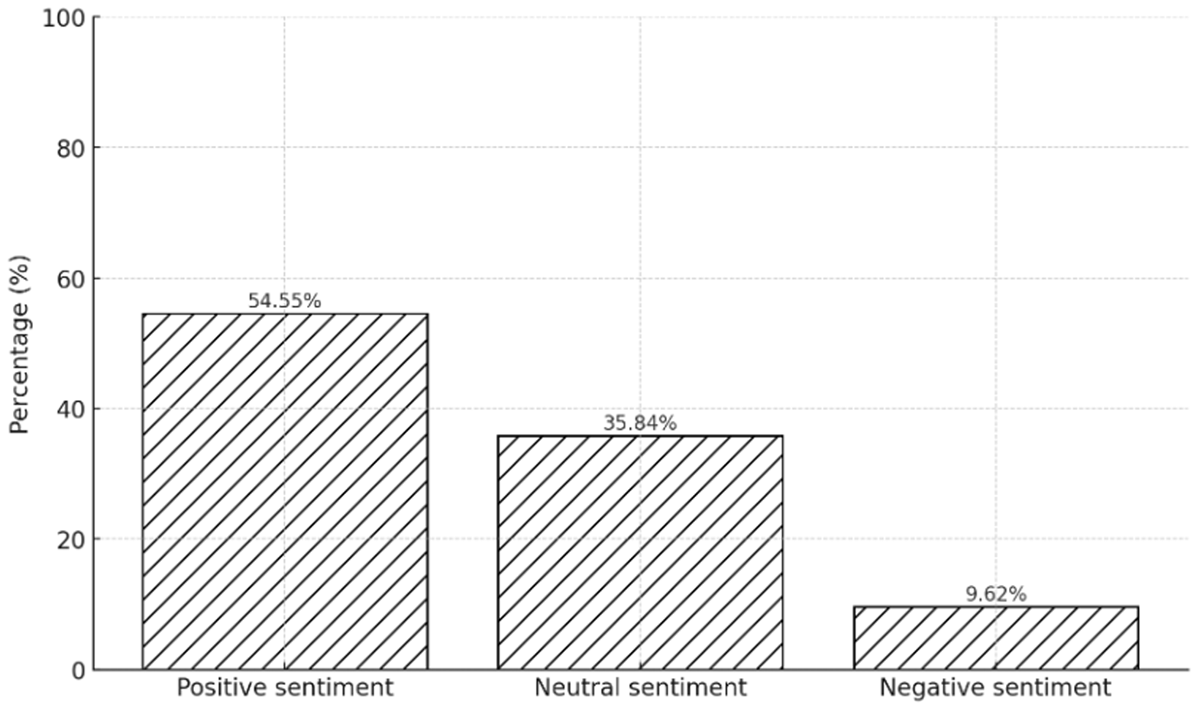
Figure 5.19
Distribution of sentiment classification for tweets related to the vote on Proposal #88.
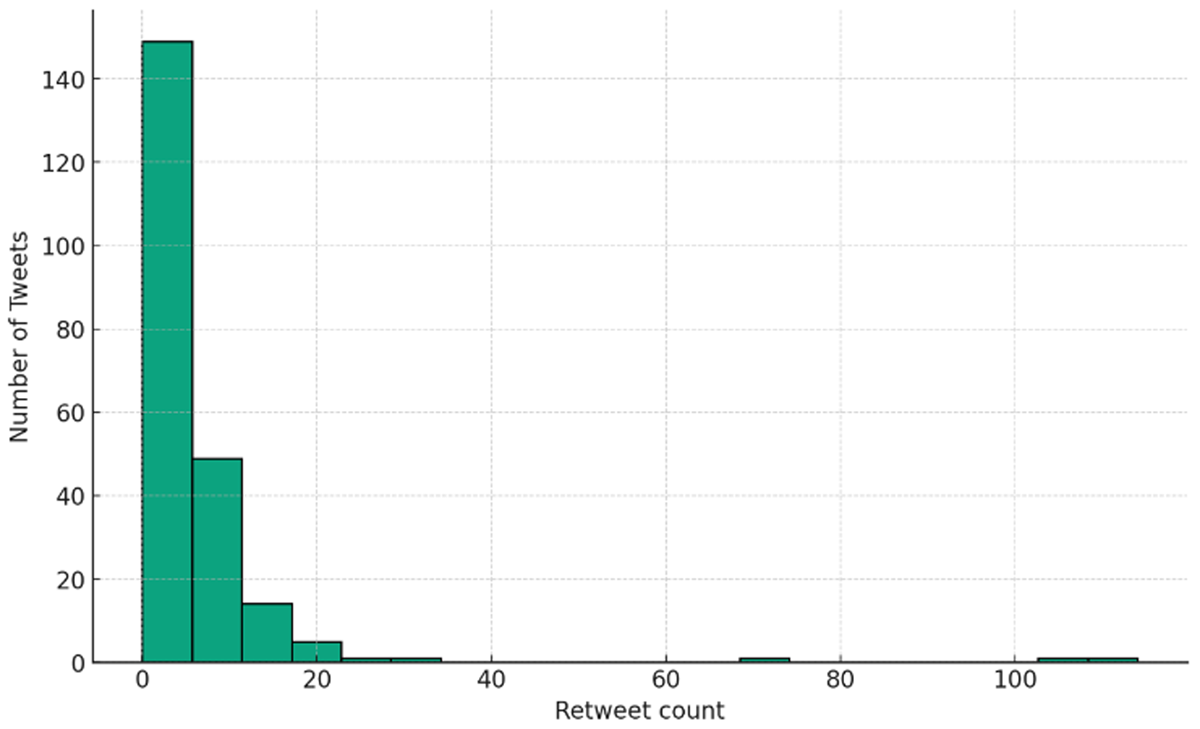
Figure 5.20[a]
Distribution of retweets for tweets related to the vote on Proposal #88.
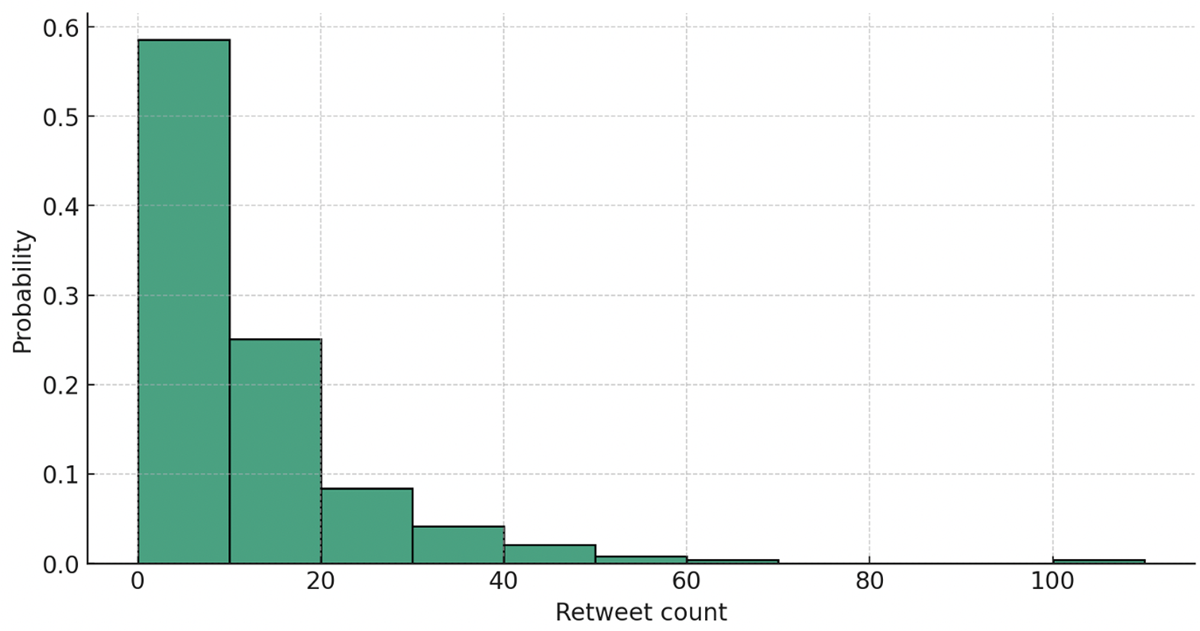
Figure 5.20[b]
Normalized distribution of retweets for tweets related to the vote on Proposal #88.
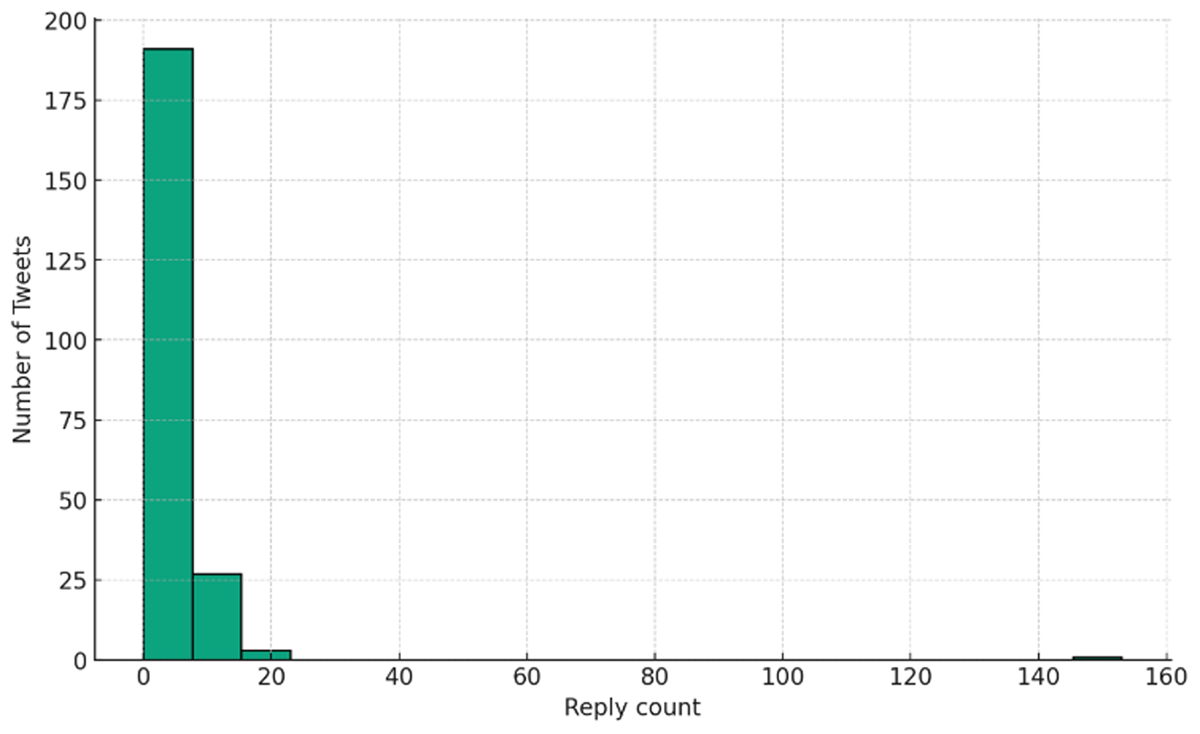
Figure 5.21[a]
Distribution of replies for tweets releated to the vote on Proposition #88.
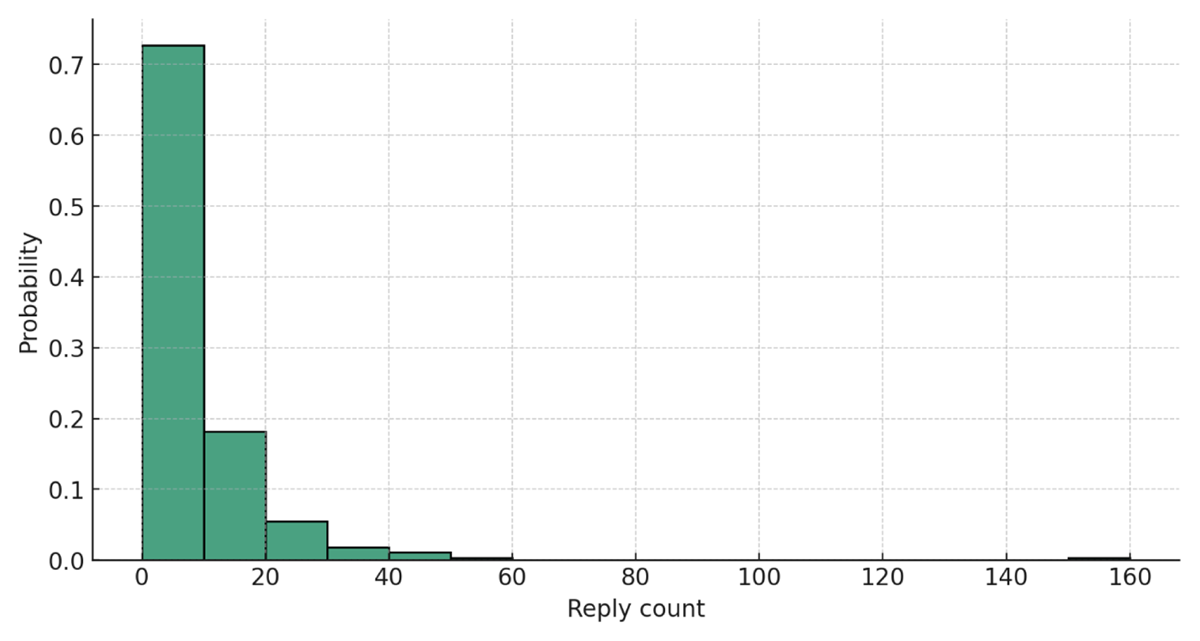
Figure 5.21[b]
Normalized distribution of replies for tweets related to the vote on Proposal #88.
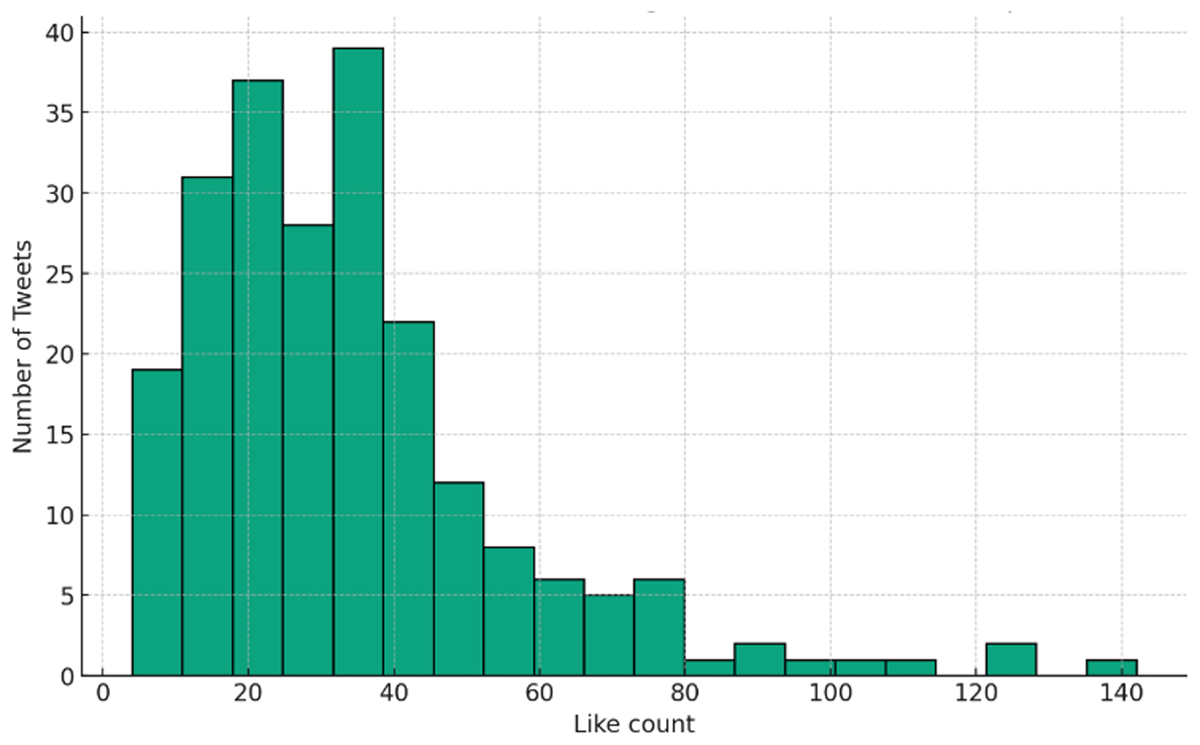
Figure 5.22[a]
Distribution of likes for tweets related to the vote on Proposal #88.
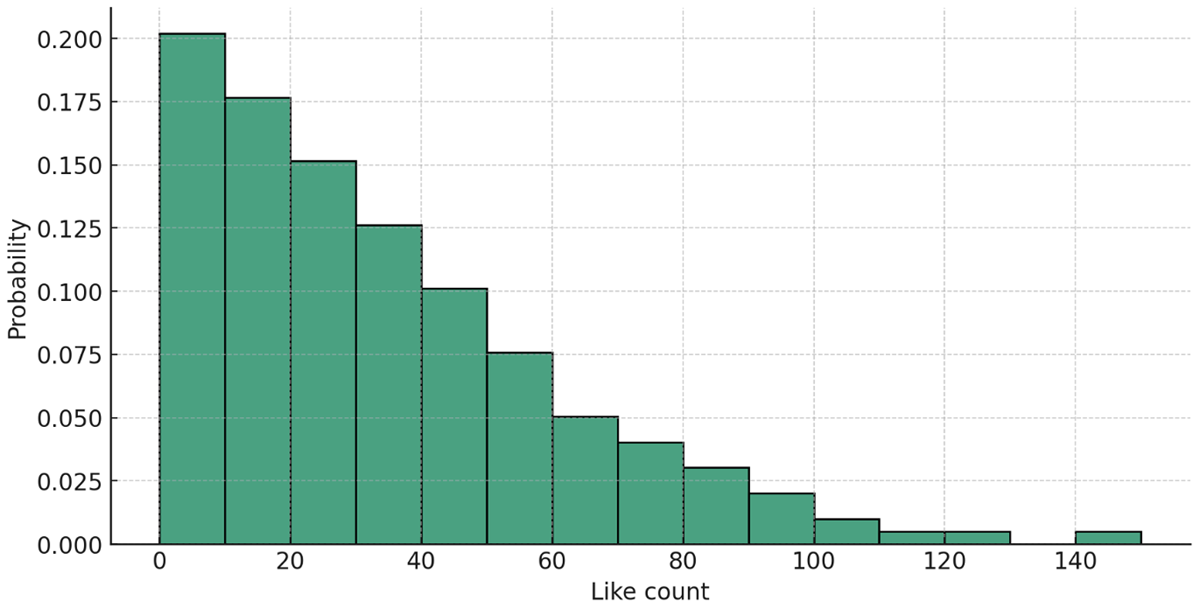
Figure 5.22[b]
Normalized distribution of likes for tweets related to the vote on Proposal #88.
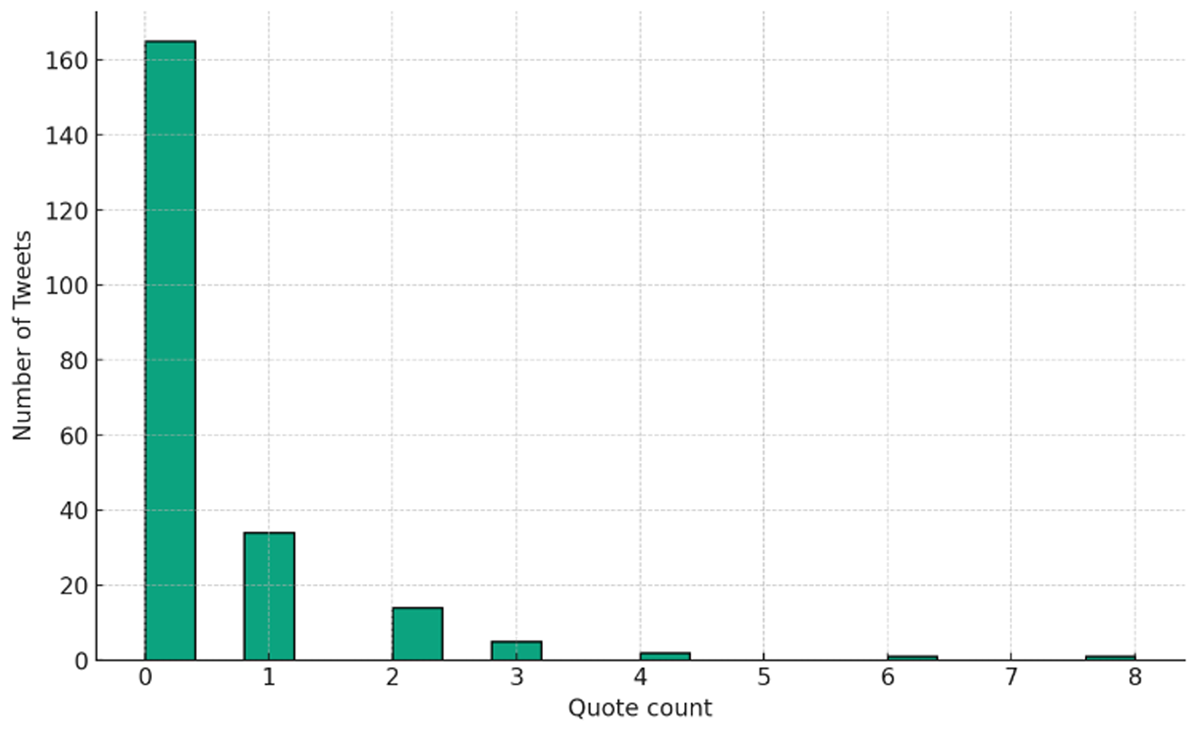
Figure 5.23
Distribution of quotes for tweets related to the vote on Proposal #88.
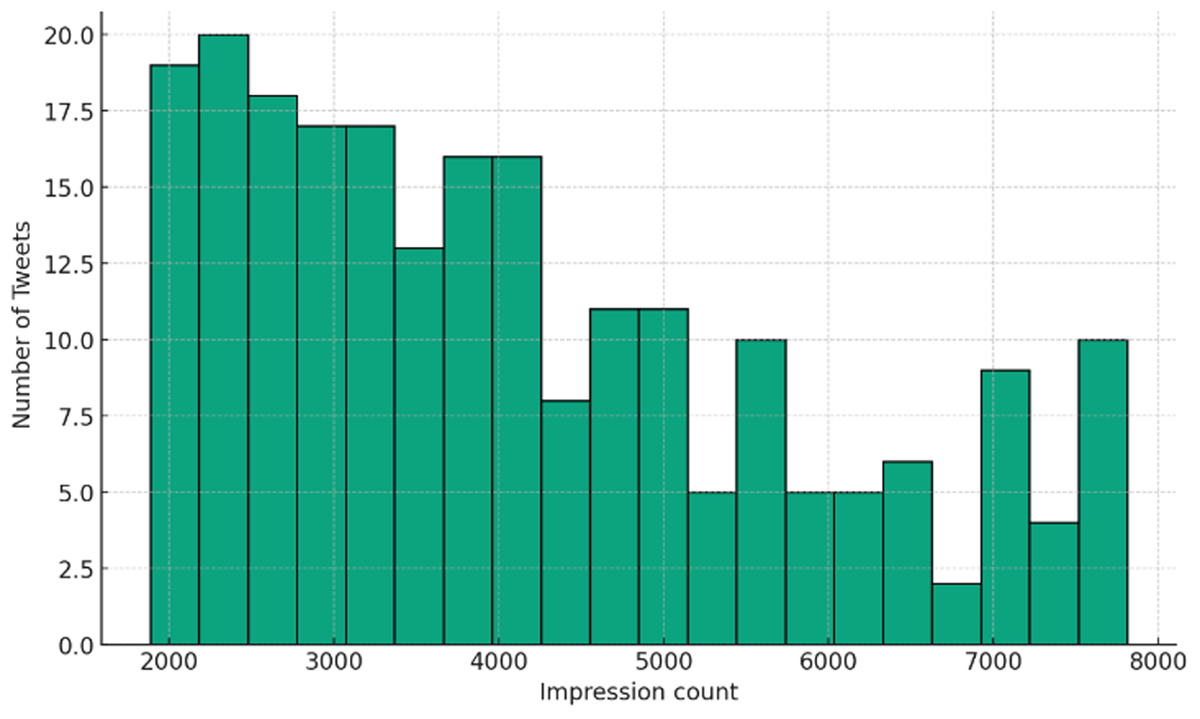
Figure 5.24[a]
Distribution of impressions for tweets related to the vote on Proposal #88.
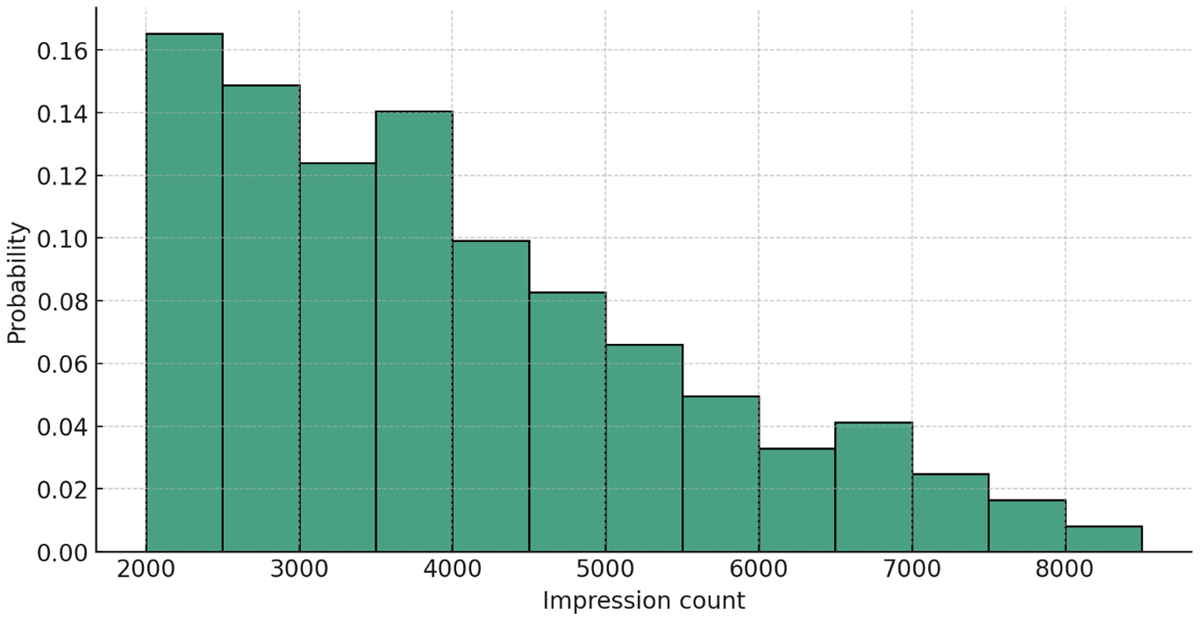
Figure 5.24[b]
Normalized distribution of impressions for tweets related to the vote on Proposal #88.
Table 5.4
Analyzing sentiment of tweets related to Proposal #88.
| Avg. sentiment | 0.154 |
| Positive tweets | 54.55% |
| Neutral tweets | 35.84% |
| Negative tweets | 9.62% |
Table 5.5
Interaction analysis of tweets related to Proposal #88.
| Avg. number of retweets | 6.18 |
| Avg. number of answers | 4.45 |
| Avg. number of likes | 34.55 |
| Avg. number of citations | 0.45 |
| Avg. number of impressions | 4115.19 |
Table 5.6
Comparison with voting results of Proposal #88.
| Votes ‘FOR’ | 99.27% (116,105,830 ATOM) |
| Votes ‘AGAINST’ | 0.67% (787,124 ATOM) |
| VETO votes | 0.06% (68,994 ATOM) |
| Abstentions | 1.55% (1,840,742 ATOM) |
| Turnout | 47.7% (118,802,691 ATOM) |
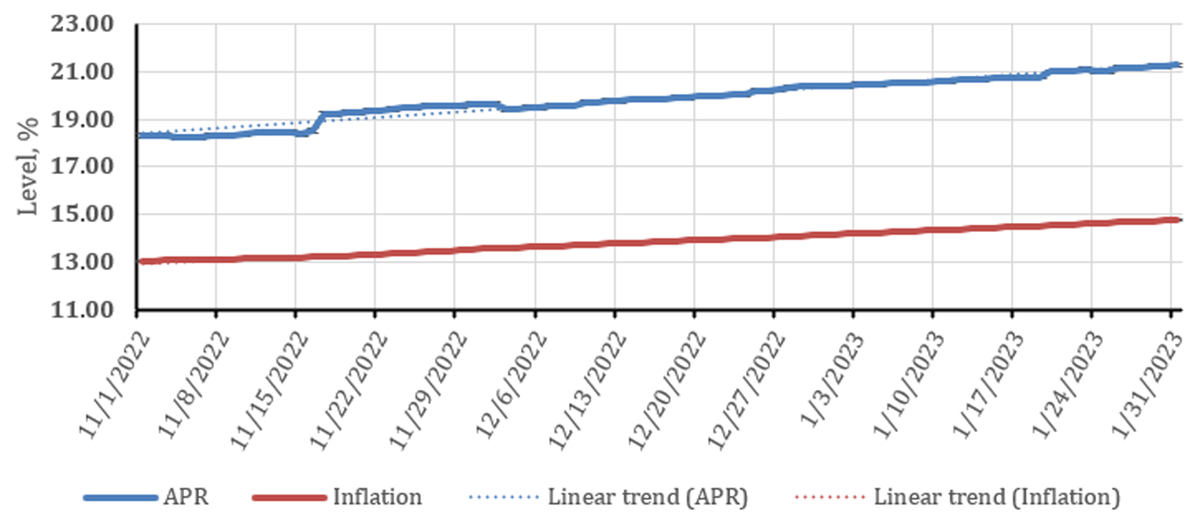
Figure 5.25
Dynamics of change of APR and inflation in time.
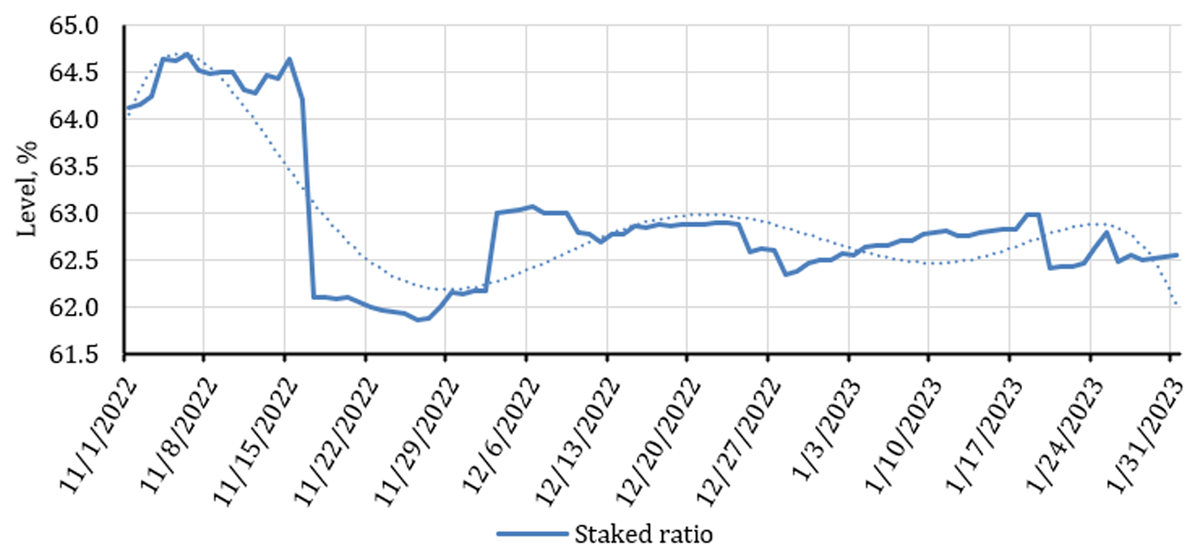
Figure 5.26
Dynamics of change of staked ratio in time.
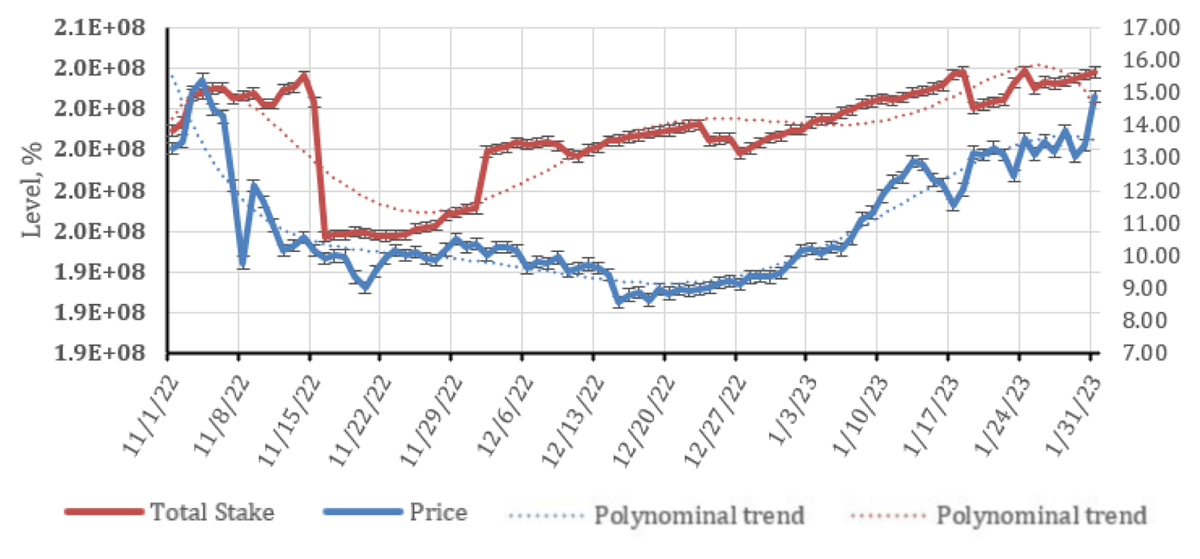
Figure 5.27
Dynamics of change of total stake and price in time.
Table 5.7
Analyzing Sentiment of tweets related to Proposal #797.
| Avg. sentiment | 0.1734 |
| Positive tweets | 66.43% |
| Neutral tweets | 28.67% |
| Negative tweets | 4.90% |
Table 5.8
Interaction Analysis of tweets related to proposal #797
| Avg. number of retweets | 4.23 |
| Avg. number of answers | 3.57 |
| Avg. number of likes | 41.21 |
| Avg. number of citations | 0.78 |
| Avg. number of impressions | 4521.94 |
Table 5.9
Comparison with voting results of Proposal #797
| Votes ‘FOR’ | 86.07% (101,237,334 ATOM) |
| Votes ‘AGAINST’ | 13.92% (16,374,473 ATOM) |
| VETO votes | 0.01% (6,738 ATOM) |
| Abstentions | 12.53% (16,847,684 ATOM) |
| Turnout | 54.7% (134,466,229 ATOM) |
Table 5.10
Analyzing sentiment of tweets related to Proposal #88.
| Avg. sentiment | 0.154 |
| Positive tweets | 54.55% |
| Neutral tweets | 35.84% |
| Negative tweets | 9.62% |