
Table 1
Venues of Sampled Publications.
| PUBLICATION VENUE | COUNT | PERCENT |
|---|---|---|
| ACM Computer and Communications Security Conference (CCS) | 40 | 23% |
| USENIX Security Symposium | 40 | 23% |
| IEEE Symposium on Security and Privacy (SP) | 21 | 12% |
| Network and Distributed System Security Symposium (NDSS) | 17 | 10% |
| ArXiv | 8 | 5% |
| Other (journals, conferences) | 45 | 26% |
| Total | 171 | 100% |
Table 2
Number of Authors in Publications.
| TOTAL NUMBER OF AUTHORS | NUMBER OF PAPERS | PERCENT |
|---|---|---|
| 2 | 20 | 12% |
| 3 | 39 | 23% |
| 4 | 33 | 19% |
| 5 | 21 | 12% |
| 6 | 22 | 13% |
| 7 | 13 | 8% |
| 8 | 12 | 7% |
| 9 | 4 | 2% |
| 10 | 4 | 2% |
| 11 | 2 | 1% |
| 12 | 1 | 1% |
| Mean # authors per paper | 4.81 | |
| Standard deviation | 2.21 |
Table 3
Positions of First Authors in Publications.
| FIRST AUTHOR POSITION | NUMBER OF PAPERS | PERCENT |
|---|---|---|
| Graduate student (PhD) | 128 | 75% |
| Faculty | 18 | 11% |
| Postdoctoral researcher | 8 | 5% |
| Graduate student (MS) | 8 | 5% |
| Other | 9 | 5% |
| Total | 171 | 100% |
Table 4
First Author Positions by Gender.
| FIRST AUTHOR POSITION GENDER | FEMALE | MALE |
|---|---|---|
| Graduate student (MS or PhD) | 18 (13%) | 118 (87%) |
| Faculty | 3 (17%) | 15 (83%) |
| Postdoc | 3 (37%) | 5 (63%) |
| Other | 0 | 9 (100%) |
Table 5
Primary Types of Analysis in Publications.
| TYPE OF ANALYSIS | FREQUENCY | PERCENT |
|---|---|---|
| Prototype and evaluation | 81 | 47% |
| Algorithm development and testing | 42 | 25% |
| Vulnerability analysis | 13 | 8% |
| Conceptual model | 12 | 7% |
| Machine learning application | 8 | 5% |
| Statistical analysis | 8 | 5% |
| Other | 7 | 4% |
| Total | 171 | 100% |
Table 6
Number of Datasets in Each Paper (Ndatasets = 387).
| DATASETS IN EACH PAPER | NUMBER OF PAPERS | PERCENT |
|---|---|---|
| 1 | 61 | 16% |
| 2 | 54 | 14% |
| 3 | 93 | 24% |
| 4 | 36 | 9% |
| 5 | 55 | 14% |
| 6 or more | 88 | 23% |
| Mean | 2.6 |
Table 7
Origin of the Datasets Used in Cybersecurity Research.
| DATA ORIGIN | NUMBER OF DATASETS | PERCENT |
|---|---|---|
| Existing | 211 | 55% |
| Collected | 105 | 27% |
| Simulated | 17 | 4% |
| Synthetic | 10 | 3% |
| Other | 44 | 11% |
| Total | 387 | 100% |
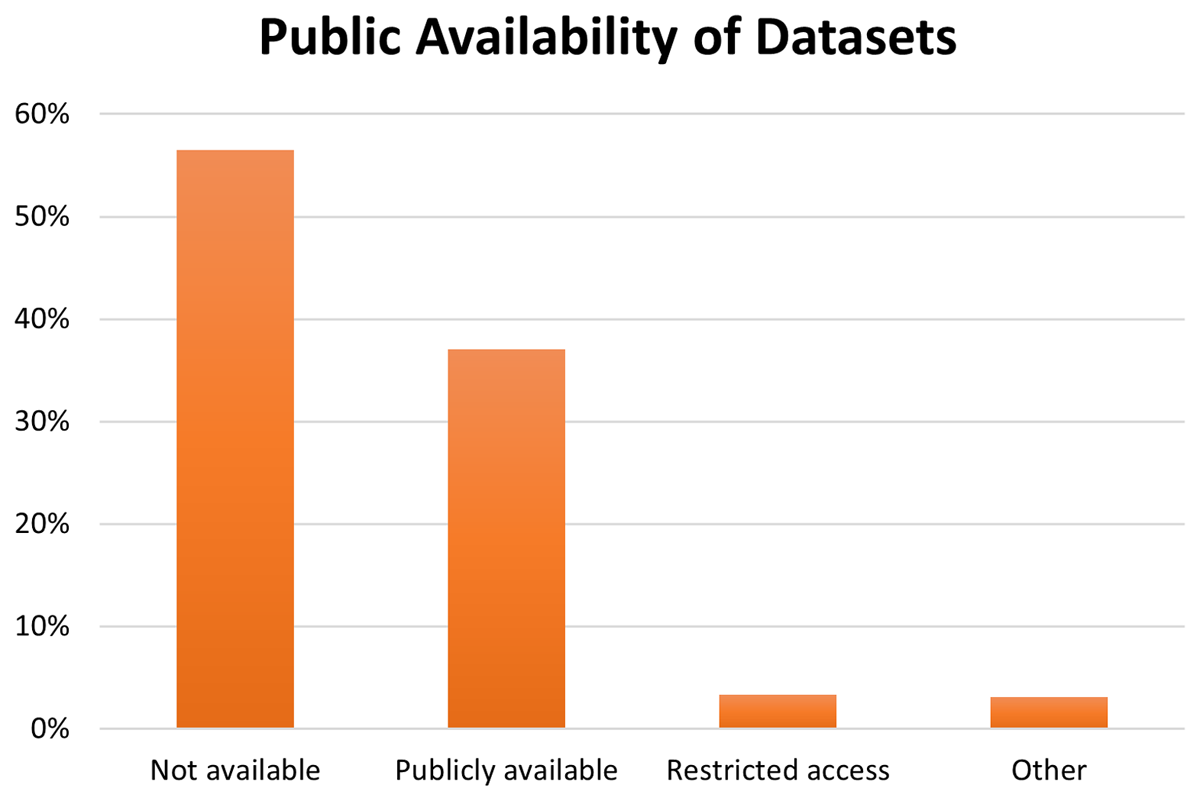
Figure 1
Public Availability of Datasets in The Sample.
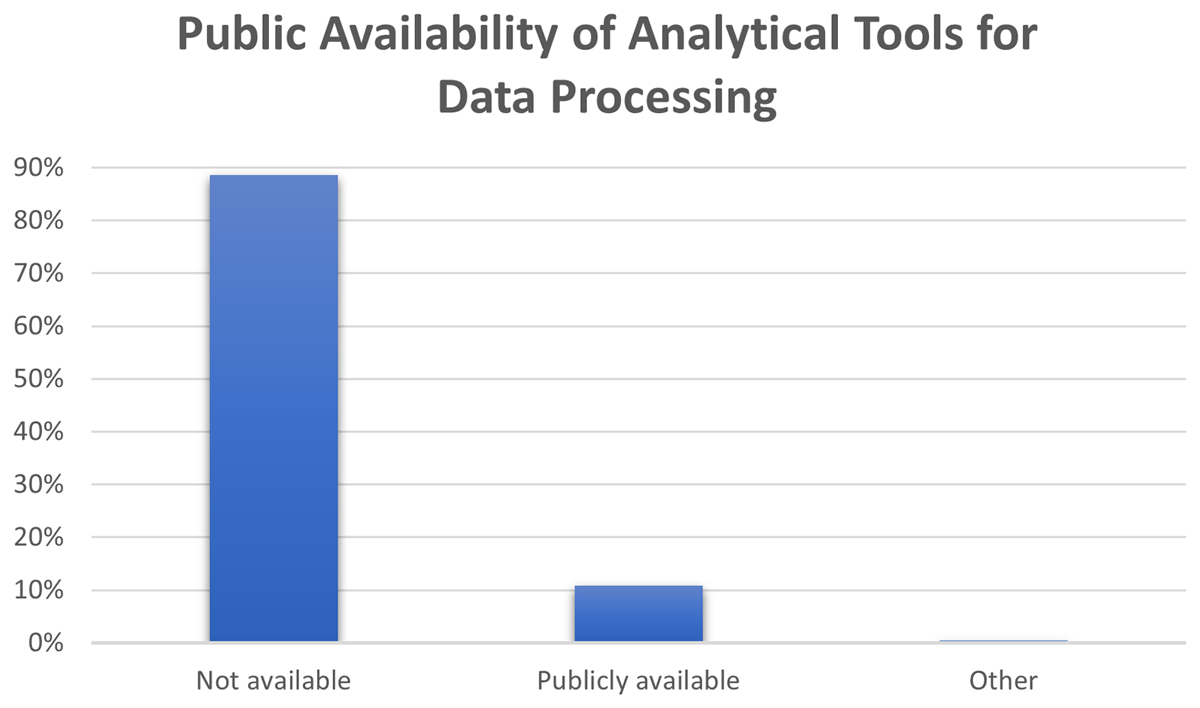
Figure 2
Public Availability of Computing and Analytical Tools for Data Processing.
Table 8
Types of Data Availability in Publications.
| TYPE OF DATA AVAILABILITY | NUMBER OF DATASETS | PERCENT |
|---|---|---|
| URL to a repository | 47 | 28% |
| Citation, no URL | 40 | 24% |
| No URL or citation | 40 | 24% |
| URL to dataset | 21 | 13% |
| Broken link | 16 | 10% |
| DOI | 1 | 1% |
| Total | 165 | 100% |
Table 9
Availability of the Previously Existing Datasets.
| EXISTING DATASETS | DATASETS IN PUBLICATIONS | PERCENT |
|---|---|---|
| Public | 119 | 56% |
| Not available | 75 | 36% |
| Restricted access | 13 | 6% |
| Other | 4 | 2% |
| Total | 211 | 100% |
Table 10
Nature of the Existing Cybersecurity Datasets per Zheng et al. (2018) Classification.
| CATEGORY | EXAMPLES | NUMBER OF DATASETS | PERCENT |
|---|---|---|---|
| User and organization characteristics | Patient or financial records, social media, reviews | 57 | 27% |
| Attacker-related | Malware, vulnerability data, security certificates | 49 | 23% |
| Internet characteristics | Network traces, IP packets, access logs | 49 | 23% |
| Defender artifacts | Security alerts, non-leaked password databases | 13 | 6% |
| Other | Images, citation data, web pages | 43 | 20% |
| Total | 211 | 100% |
Table 11
Nature of the Existing Cybersecurity Datasets per Sauerwein et al. (2019) Classification.
| CATEGORY | EXAMPLES | NUMBER OF DATASETS | PERCENT |
|---|---|---|---|
| Asset | Whitelists, network traffic, emails, images | 150 | 71% |
| Threat | Security alerts, data breaches | 32 | 15% |
| Countermeasure | Spam samples, VirusTotal samples, security certificates | 13 | 6% |
| Attack | DDoS attack data | 7 | 4% |
| Vulnerability | Vulnerability data | 8 | 4% |
| Risk | Market transactions | 1 | |
| Total | 211 | 100% |
Table 12
Availability of the Collected Datasets.
| CATEGORY | NUMBER OF DATASETS | PERCENT |
|---|---|---|
| Not available | 91 | 87% |
| Public | 12 | 12% |
| Available upon request | 2 | 1% |
| Total | 104 | 100% |
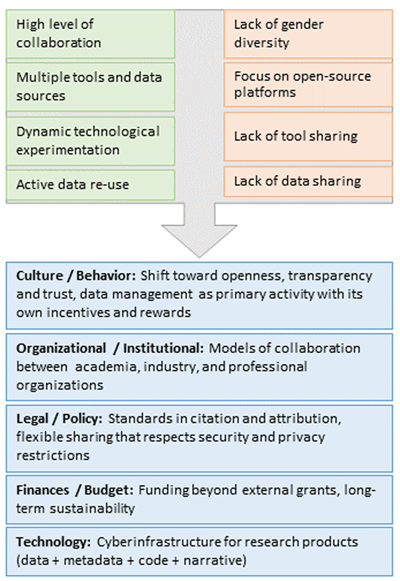
Figure 3
Data and Cybersecurity Research, from Present to Future.