
Table 1
5W Plus rule.
| RULE | DESCRIPTION |
|---|---|
| Who | uses the system and provides or manages the data |
| What | describes the data domain, the system architecture, and functionalities |
| Where | places data in the geographic context (or the user network IP address) |
| When | places data in the temporal context |
| Why | explains the data value and its cause-effects relations |
| How | describes the operation of the system based on data input |
| Other | includes the characterisation of the other system components |
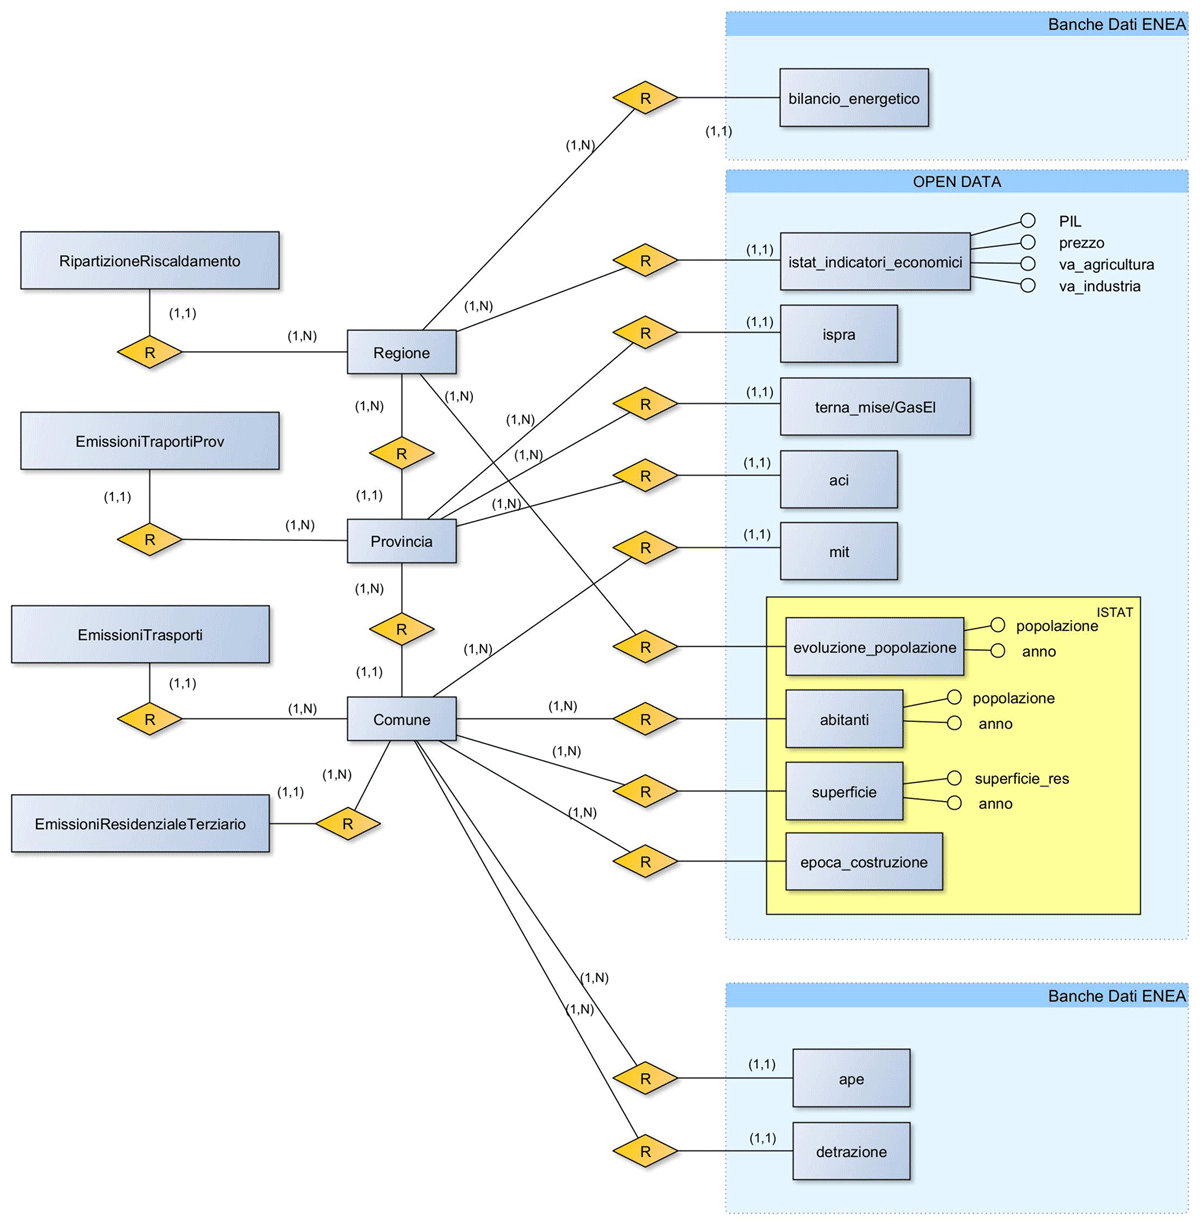
Figure 1
Main part of the Entity – Relationship schema.
Table 2
Open data sources: Key field and granularity.
| SOURCE | AGGREGATION LEVEL | KEY |
|---|---|---|
| ISTAT | M | Istat code |
| ACI | P | Name |
| MIT | M | Name |
| TERNA | M | Name |
| ISPRA | P | Name |
| ENEA | M, R | Istat code |
Table 3
Market share for different fuel/energy carriers in Sicily.
| CARRIER | SHARE |
|---|---|
| Diesel | 0.0% |
| LPG | 14.7% |
| Electricity | 24.1% |
| Natural Gas | 52.2% |
| Biomass | 7.9% |
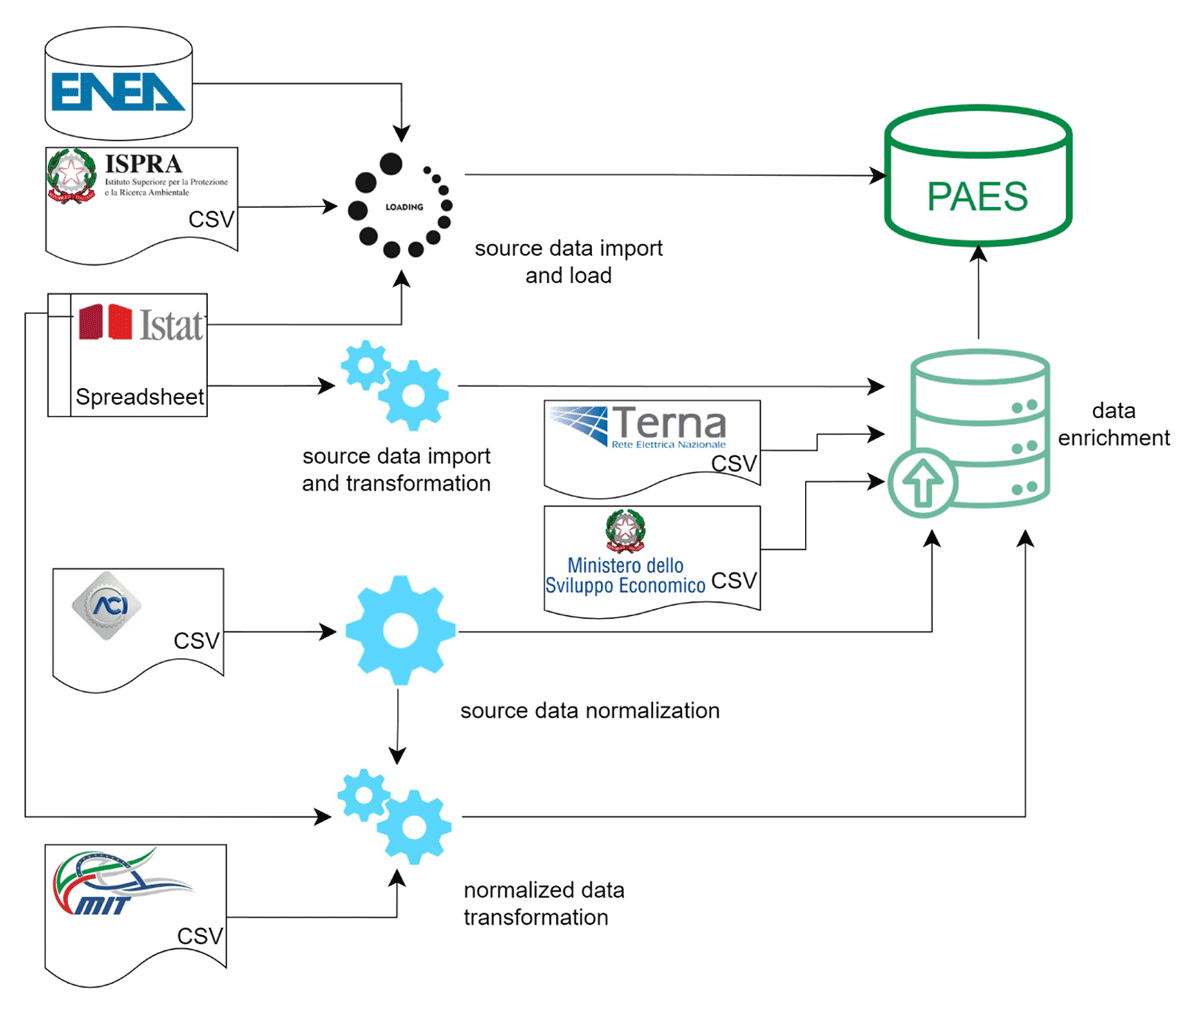
Figure 2
Open data ETL system into PAES database.
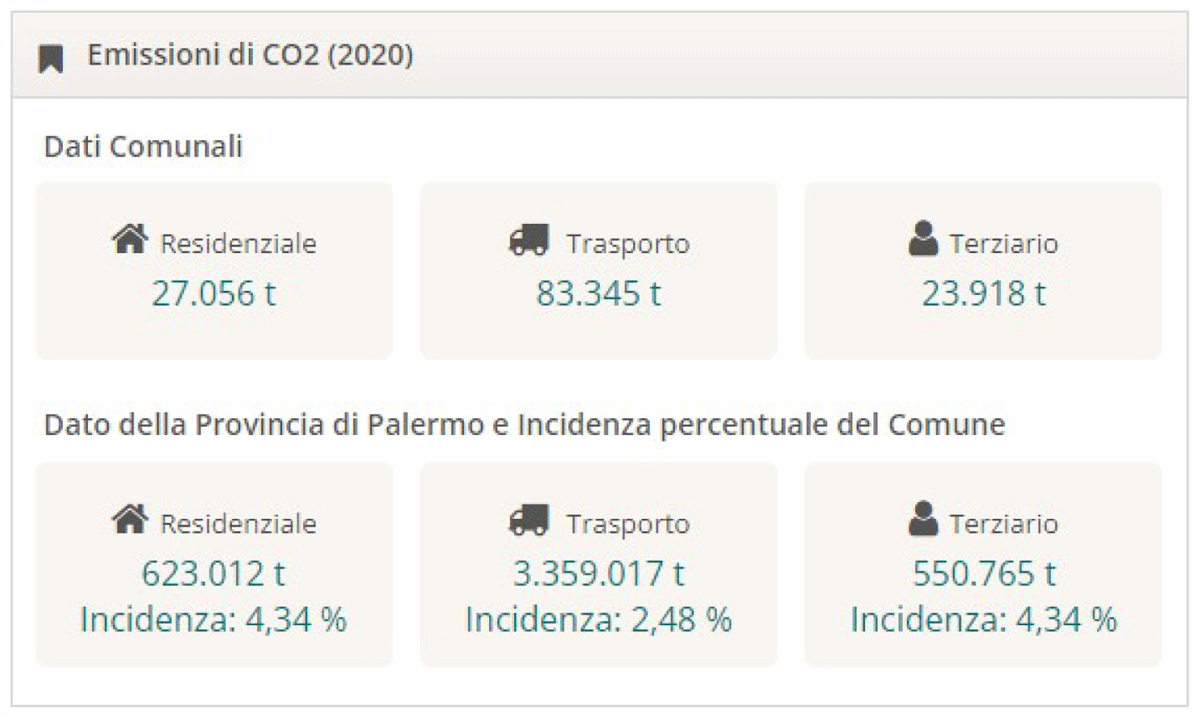
Figure 3
Example of CO2 emissions divided by the sectors residential, transport and tertiary (respectively ‘residenziale,’ ‘trasporto,’ and ‘terziario’) for Bagheria municipality (‘dati comunali’) in comparison with Province of Palermo (Sicily Region).
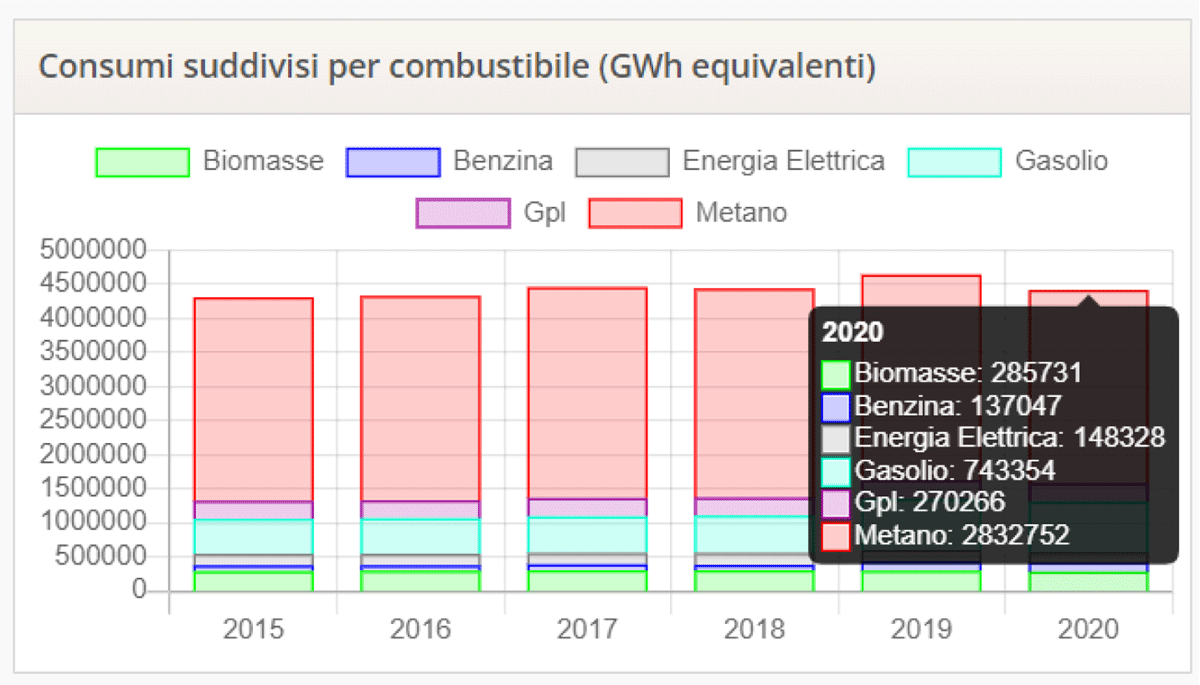
Figure 4
Fuel consumption disaggregated by fuel, measured in equivalent GWh.
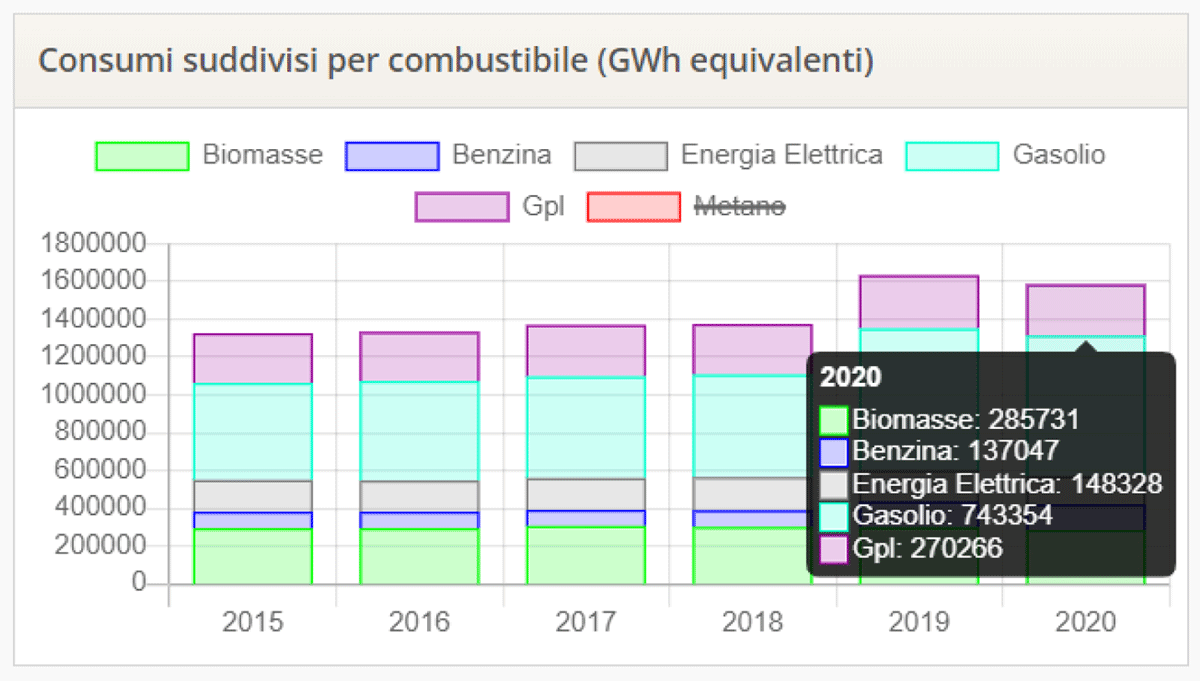
Figure 5
Fuel consumption disaggregated by fuel, measured in equivalent GWh and with natural gas toggled off.
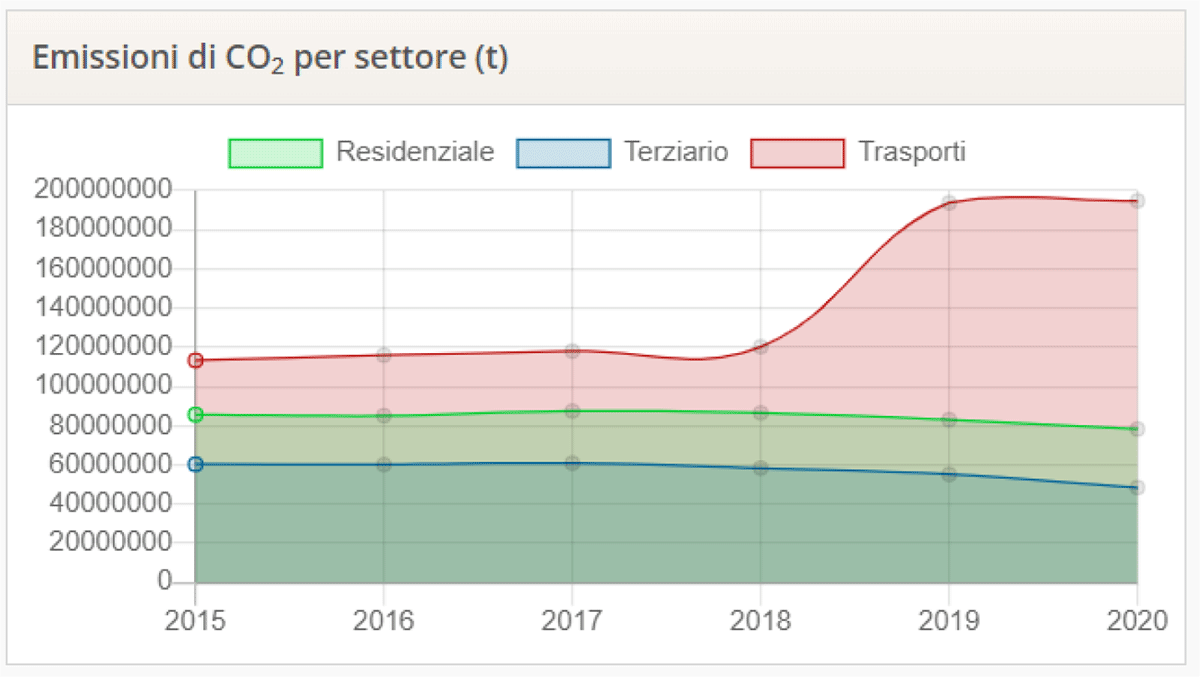
Figure 6
Example of CO2 emissions history disaggregated by sector, measured in ton.
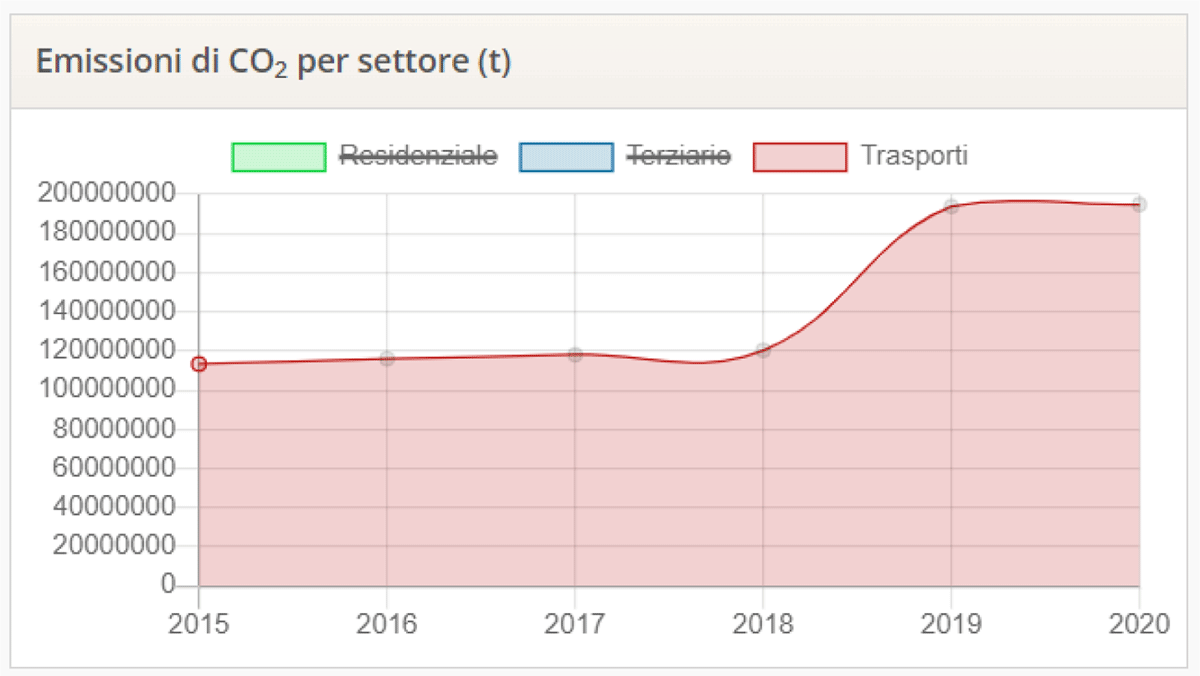
Figure 7
Example of CO2 emissions history disaggregated by sector, measured in ton and with two series toggled off.
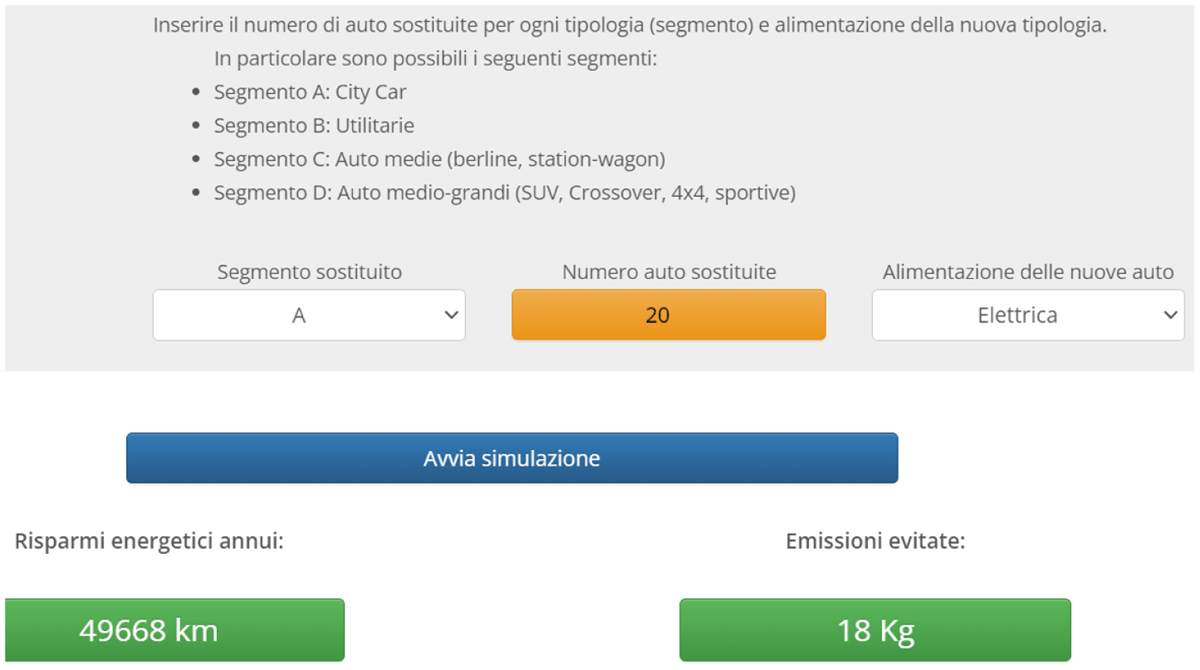
Figure 8
Technology upgrade of the transport sector BP: simulation of the vehicle fleet replacement.
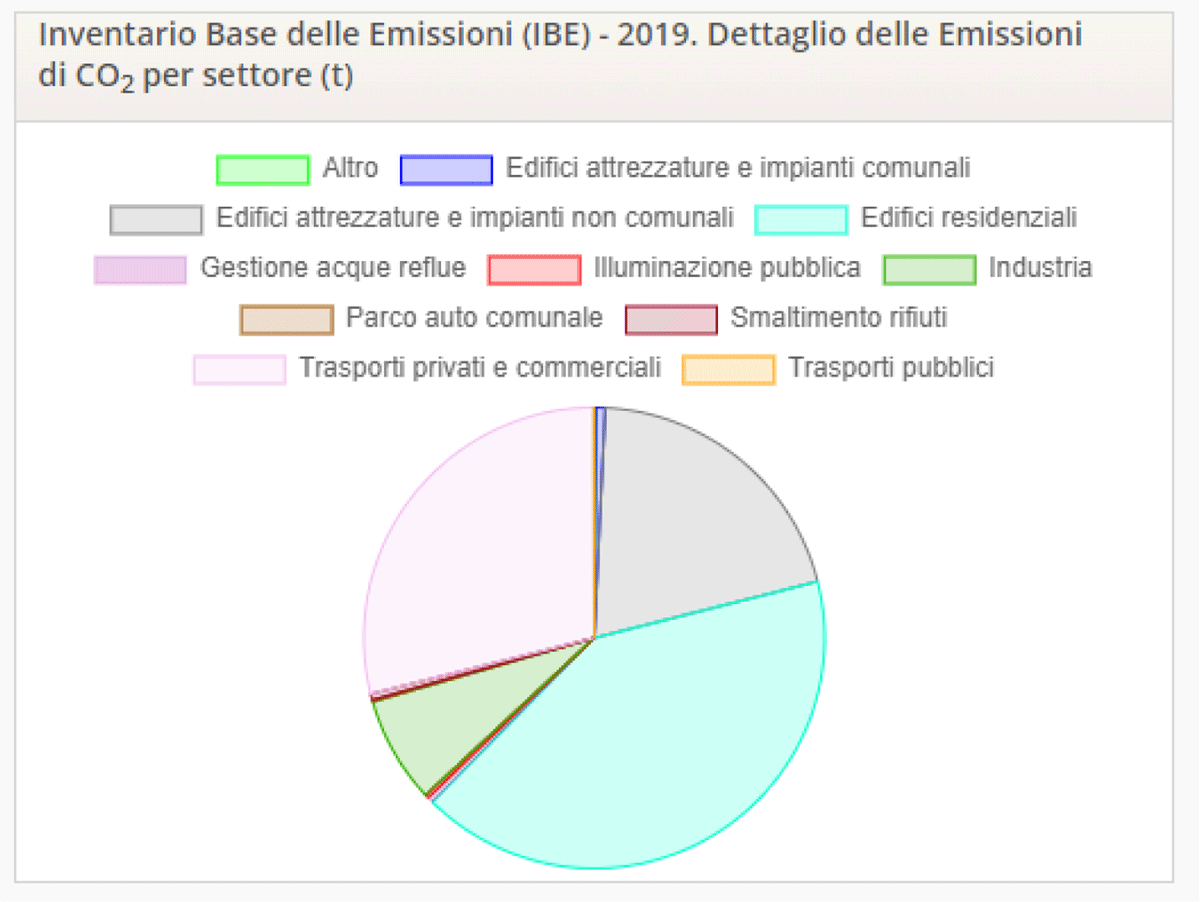
Figure 9
BEI pie chart with details of CO2 emissions avoided by sectors (measured in ton). Classifications are building equipment and municipal facilities (‘edifici attrezzature e impianti comunali’), building equipment and non-municipal municipal facilities (‘edifici attrezzature e impianti non comunali’), residential buildings (‘edifici residenziali’), wastewater management (‘gestione acque reflue’), public lighting (‘illuminazione pubblica’), industry (‘industria’), municipal car fleet (‘parco auto comunale’), garbage disposal (‘smaltimento rifiuti’), private and commercial transport (‘trasporti private e commerciali’), public transportation (‘trasporti pubblici’), other (‘altro’).