
Table 1
Quantitative characteristics of the analyzed datasets. #patients: number of patients. #features: number of clinical features. #missing values: number of missing data instances.
| DATASET NAME | REFERENCE | #PATIENTS | #FEATURES | #MISSING VALUES | TABLE |
|---|---|---|---|---|---|
| dataBB2013 | Banelli et al. (2013) | 121 | 11 | 50 | Table 2 |
| dataCK2018 | Kim et al. (2018) | 20 | 16 | 29 | Table 3 |
| dataEV2013 | Villamón et al. (2013) | 19 | 11 | 13 | Table 4 |
| dataYBC2019 | Choi et al. (2019) | 7 | 10 | 0 | Table 5 |
| dataYM2018 | Ma et al. (2018) | 169 | 13 | 52 | Table 6 |
| interval | [7, 169] | [10, 16] | [0, 52] | ||
| mean | 67.2 | 12.2 | 28.8 |
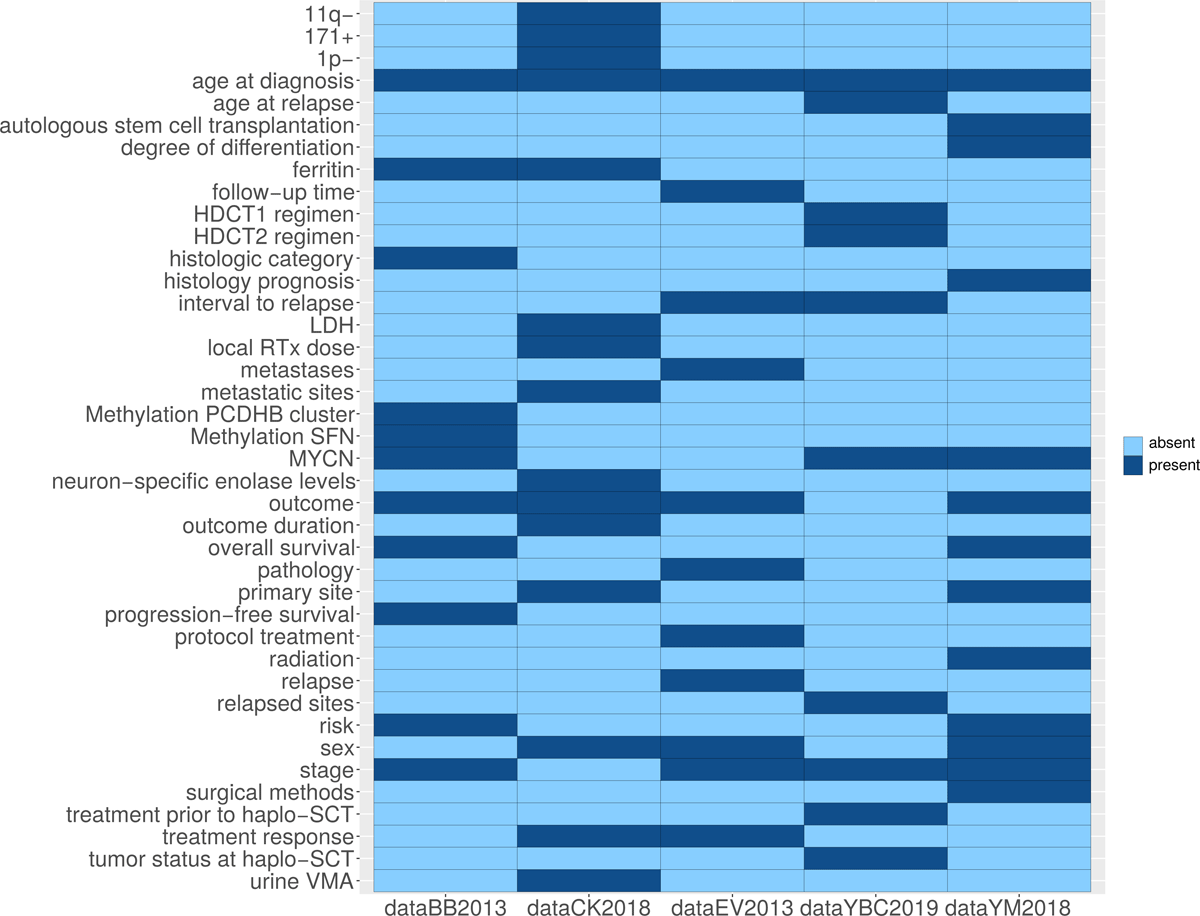
Figure 1
Presence and absence of the clinical features in the five analyzed datasets. x axis: datasets names. y axis: clinical features of the datasets. dataBB2013: Banelli et al. (2013) (Table 2). dataCK2018: Kim et al. (2018) (Table 3). dataEV2013: Villamón et al. (2013) (Table 4). dataYBC2019: Choi et al. (2019) (Table 5). dataYM2018: Ma et al. (2018) (Table 6).
Table 2
Meaning and values of the features of the dataBB2013 dataset. Number of patients: 121. Number of features: 11. AICR: alive in complete remission. AWD: alive with disease. AWSD: alive with stable disease. CR: complete remission. DOD: Dead of disease. GNB: ganglioneuroblastoma. HR: high risk. INRG: International Neuroblastoma Risk Group MYCN: MYCN oncogene. NaN: not a number. NB: neuroblastoma. NS: not specified, it was impossible to make a more precise diagnosis (Romani, 2021). OS: overall survival. PCDDHB: Protocadherin Beta Cluster. PFS: progression-free survival. SFN: Stratifin gene. Additional information can be found in the dataset original article by Banelli et al. (2013).
| DATABB2013 | |||
|---|---|---|---|
| FEATURE | MEANING | TYPE | VALUES |
| age at diagnosis | age at diagnosis | integer | 2, …, 196 |
| ferritin | ferritin serum level | ng/ml | –99, 19, …, 2250 |
| histological category | histological category of the neuroblastoma | categorical | NS, NB, GNB |
| INRG Risk classification | risk group: HR high risk and I/LR intermediate/low risk | categorical | 0, 1 |
| INSS Stage | stage of the tumor (only stage 4 patients) | categorical | 1 |
| MYCN amplification | status of nMYC oncogene: 0, amplified, 1, unamplified; | binary | 0, 1 |
| Methylation PCDHB cluster (%) | methylation of 17 genes of the Protocadherin B cluster | percentage | 29.44, …, 88.93 |
| Methylation SFN (%) | methylation of the SFN gene | percentage | 36.6, …, 99 |
| OS | overall survival | float | 0.27, …, 164.47 |
| outcome | clinical outcome | categorical | AICR, AWD, |
| AWSD, CR, DOD | |||
| PFS | progression free survival | float | 3.7, …, 74.7, NaN |
Table 3
Meaning and values of the features of the dataCK2018 dataset. Number of patients: 20. Number of features: 16 BM: bone marrow. CR: complete response. CT: chemotherapy. DT: differentiation therapy. F: female. gy: gray units. ID: identifier. LDH: lactic acid dehydrogenase. LN: lymph node. LSE: neuron-specific enolase. M: male. MR: mixed response. PR: partial response. S: surgery. U/L: units per liter. VGPR: very good partial response. VMA: vanillylmandelic acid. mg: milligrams. mo: months ng/mL: nanograms per milliliter. no: number. In the original article dataset, sex and age are joined in a unique feature called ‘Sex/age (mo)’, and outcome and outcome months are joined in a unique feature called ‘Outcome (mo)’. Additional information can be found in the dataset original article by Kim et al. (2018).
| DATACK2018 | |||
|---|---|---|---|
| FEATURE | MEANING | TYPE | VALUES |
| 11q– | presence of chromosomal aberration at 11q site | Boolean | yes, no, – |
| 17q+ | presence of chromosomal aberration at 17q site | Boolean | yes, no, – |
| 1p– | presence of chromosomal aberration at 1p site | boolean | yes, no, – |
| age | age at diagnosis | months | 0, …, 10.2 |
| ferritin | ferritin levels | ng/mL | 15, …, 1638.6 |
| LDH | lactic acid dehydrogenase level | U/L | 539, …, 6200 |
| local RTx dose (gy) | dosage of radiation | float | 15, 23.4, 25.2, – |
| BM, bone, kidney, liver, LN, | |||
| metastatic sites | site of metastsoization | categorical | lung, mediastinum, muscle, |
| pleura, skin | |||
| NSE | neuron-specific enolase levels | ng/mL | 7.3, …, 947 |
| outcome | event-free survival (EFS) or No Evidence of Disease | Boolean | EFS, NED |
| outcome_mo | follow-up | months | 17, …, 91 |
| primary site | tumor primary site | binary | abdomen, mediastinum |
| sex | male or female | binary | M, F |
| tumor response after CT & S | response after chemotherapy and surgery | categorical | CR, MR, PR, VGPR |
| tumor response after DT | response after differentiation theraphy (DT) | categorical | CR, MR, PR, VGPR |
| urine VMA | vanillylmandelic acid levels in urine | mg/day | 0.5, …, 53.9 |
Table 4
Meaning and values of the features of the dataEV2013 dataset. Number of patients: 19. Number of features: 11. ADF: alive disease-free. AWD: alive with disease. B: bone. BM: bone marrow. CR: complete response. DOD: died of disease. DOS: died of sepsis. DP: disease progression. DTC: died of treatment complication. F: female. HR-NBL1: High-Risk Neuroblastoma Study 1. INES: Infants Neuroblastoma European Study, SIOPEN protocols. LN: lymph nodes. M: male. N-II-92 and NAR-99: names of national clinical trials in Spain (Noguera 2021). PR: partial response. ST: soft tissue. SurPR: surgical partial resection. VGPR: very good partial response. nGNB: nodular ganglioneuroblastoma. pdNB: poorly differentiated NB. uNB: undifferentiated neuroblastoma. VGPR: very good partial response. Additional information can be found in the dataset original article by Villamón et al. (2013).
| DATAEV2013 | |||
|---|---|---|---|
| FEATURE | MEANING | TYPE | VALUES |
| age at diagnosis | age | months | 9, …, 108 |
| follow-up time | overall survival | months | 1, …, 132 |
| metastases | presence of metastasis | boolean | yes, no |
| outcome | clinical outcome | categorical | ADF, AWD, DOD, DOS, DTC |
| pathology | pathological category | categorical | nGNB, pdNB, uNB |
| protocol treatment | treatment protocol | categorical | HR-NBL1, INES, LNESG1, N-II-92, NAR-99 |
| relapse | if the cancer relapsed or not | boolean | yes, no |
| sex | male or female | binary | M, F |
| stage | stage of the tumor | categorical | 1, 2, 3, 4 |
| time to first relapse | time to first relapse | months | 4, …, 28 |
| treatment response | response to first line treatment | categorical | CR, DP, PR, SurPR, VGPR |
Table 5
Meaning and values of the features of the dataYBC2019 dataset. Number of patients: 7. Number of features: 10. A: amplified. BM: bone marrow. CEC: carboplatin, etoposide, and cyclophosphamide CR: complete response. CT×5: five cycles of chemotherapy. CT×6: six cycles of chemotherapy. CT×7: seven cycles of chemotherapy. Dx: diagnosis. HDCT: high-dose chemotherapy. L-RT: local radiotheraphy. LNs: lymph nodes. MEC: melphalan, carboplatin, and etoposide. MIBG-TM: high-dose 131I-metaiodobenzylguanidine treatment, thiotepa, and melphalan NA: not amplified. PR: partial response. SCT: stem cell transplantation. TTC: topotecan, thiotepa, and carboplatin. VGPR: very good partial response. m: months. y: years. Additional information can be found in the dataset original article by Choi et al. (2019).
| DATAYBC2019 | |||
|---|---|---|---|
| FEATURE | MEANING | TYPE | VALUES |
| age at Dx. | age at diagnosis | years | 1.5, …, 3.5 |
| age at relapse | age at relapse | years | 4.1, …, 8.6 |
| HDCT1 regimen | first high-dose chemotherapy | binary | TTC, CEC |
| HDCT2 regimen | second high-dose chemotherapy | binary | MEC, MIBG-TM |
| interval to relapse | interval to relapse | months | 12, …, 75 |
| MYCN status | amplified (A) or not amplified (NA) | binary | A, NA |
| relapsed sites | relapse sites in the body | categorical | Primary, Brain, Bone, LNs, BM |
| stage at Dx | only metastistic tumors | categorical | 4 |
| treatment prior to haplo-SCT | treatment prior to haploidentical SCT | categorical | Surgery, L-RT, CT×5, CT×6, CT×7 |
| tumor status at haplo-SCT | tumor status at haploidentical SCT | categorical | PR, CR, VGPR |
Table 6
Meaning and values of the features of the dataYM2018 dataset. Number of patients: 169. Number of features: 13. FH: favorable histology. MYCN: MYCN oncogene. UH: unfavorable histology. Additional information can be found in the dataset original article by Ma et al. (2018).
| DATAYM2018 | |||
|---|---|---|---|
| FEATURE | MEANING | TYPE | VALUES |
| age | 0: < 12 months; 1: 12–60 months; 2: ≥ 60 months. | integer | 0, 1, 2 |
| autologous stem | autologous stem cell transplantation: 0: no; 1: yes. | binary | 0, 1 |
| cell transplantation | |||
| degree of differentiation | 0: undifferentiated; 1: poorly differentiated; 2: differentiated. | categorical | 0, 1, 2 |
| histology prognosis | 1: FH favorable histology, 0: UF unfavorable histology | binary | 0, 1 |
| MYCN status | status of nMYC oncogene: 0: amplified; 1: unamplified. | binary | 0, 1 |
| outcome | clinical outcome: 1, dead of disease, 0, alive or lost follow-up. | binary | 0, 1 |
| radiation | if the patient had radiation | boolean | 0, 1 |
| risk | risk group: 0: intermediate-risk; 1: high-risk. | categorical | 0, 1 |
| sex | 0: male; 1: female. | integer | 0, 1 |
| site | primary tumor site: 0: adrenal gland; 1: mediastinum; 2: others. | categorical | 0, 1, 2 |
| stage | stage of the tumor | categorical | 1, 2, 3, 4 |
| surgical methods | total or partial resection | binary | 0, 1 |
| time | overall survival | months | 1, …, 100 |