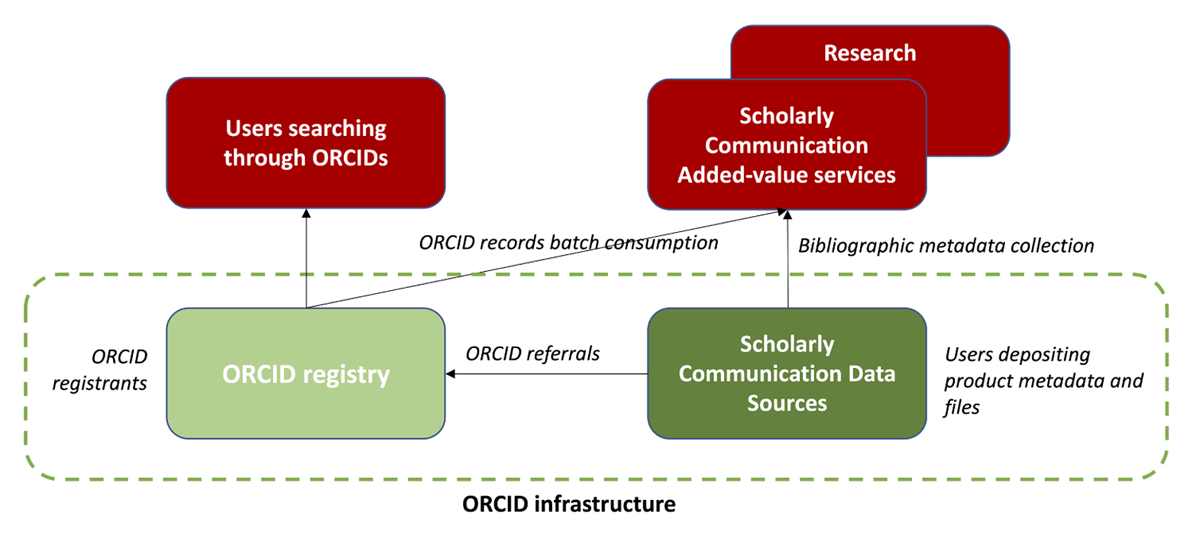
Have a personal or library account? Click to login
We Can Make a Better Use of ORCID: Five Observed Misapplications Cover

We Can Make a Better Use of ORCID: Five Observed Misapplications

Open Access
|Dec 2021

Figures & Tables

Figure 1

ORCID infrastructure: services and usages.
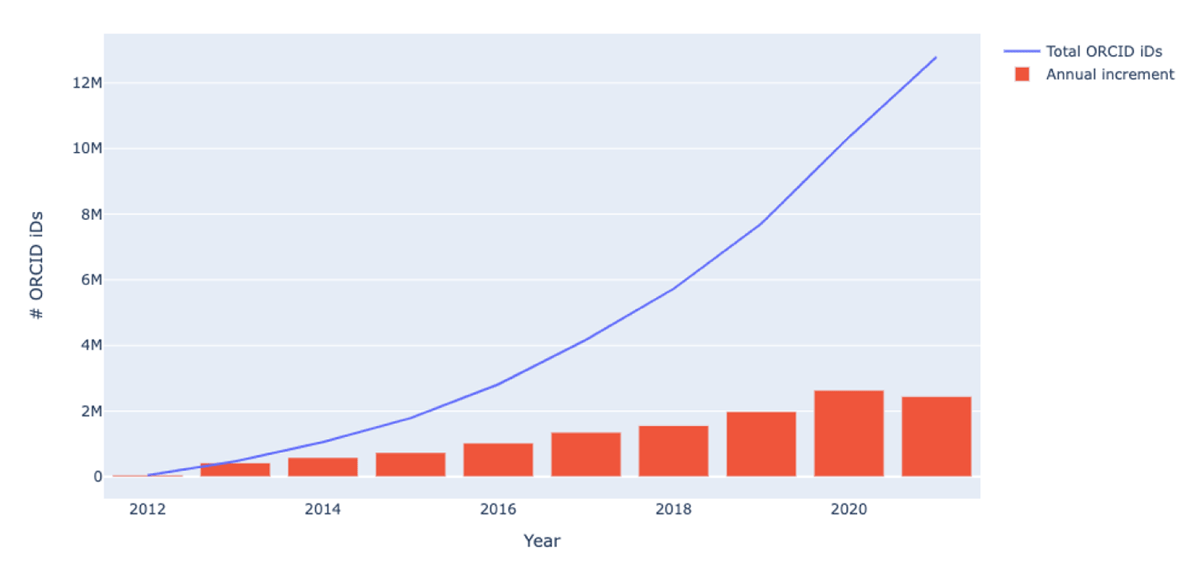
Figure 2

Number of ORCID records per year. The bar plot indicates the annual increment, while the line reports the total number of ORCID iDs through the years. (source: ORCID’s public data file, October 2021).
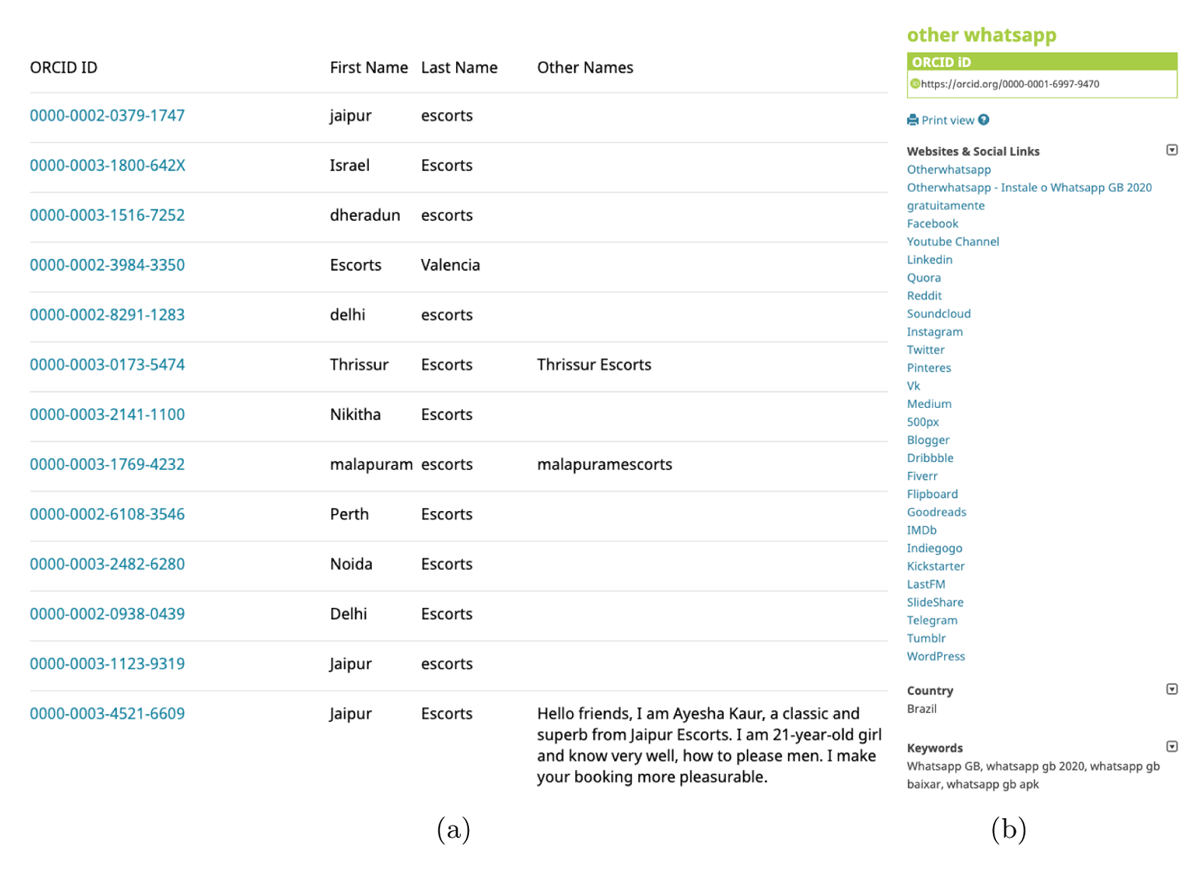
Figure 3

Fake records returned by the query “escorts” (a) and details of a fake record (b).
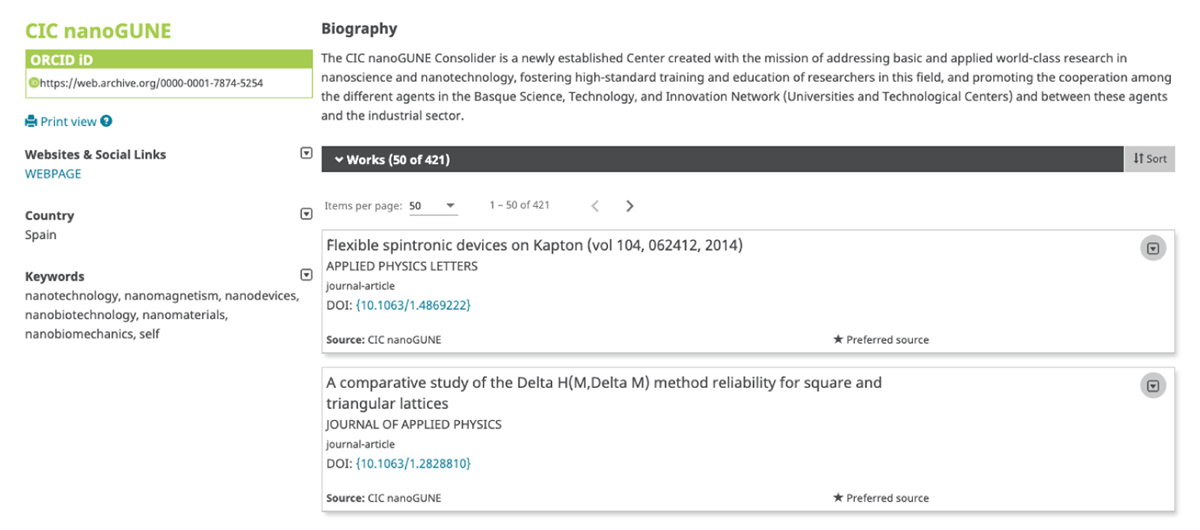
Figure 4

Overloaded ORCID record associated to a research organisation.

Figure 5

Referral to a syntactically wrong ORCID iD.
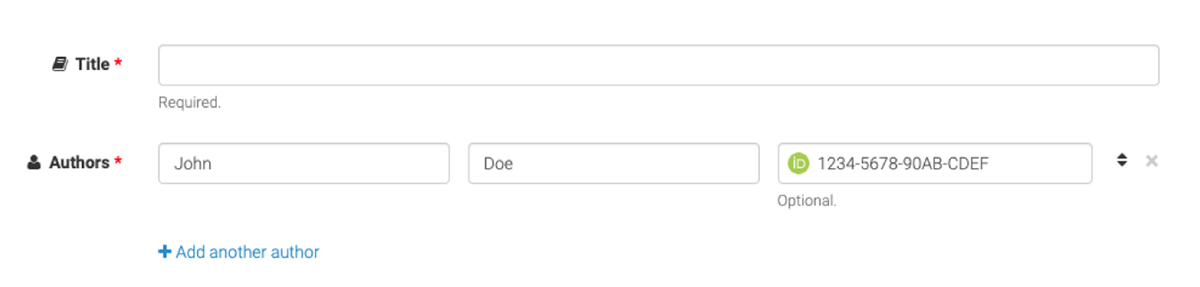
Figure 6

Unrestricted ORCID field in Zenodo.

Language: English
Page range: 38 - 38
Submitted on: Jul 21, 2021
Accepted on: Dec 17, 2021
Published on: Dec 31, 2021
Published by: Ubiquity Press
In partnership with: Paradigm Publishing Services
Publication frequency: 1 issue per year

© 2021 Miriam Baglioni, Paolo Manghi, Andrea Mannocci, Alessia Bardi, published by Ubiquity Press
This work is licensed under the Creative Commons Attribution 4.0 License.