
Table 1
Number of SARS-CoV-2 genome sequences with less than 10% (A) and less than 1% (B) unknown nucleotides used in this study.
Unknown: genome sequences for which continent was not registered.
| (A) NUMBER OF SEQUENCES WITH LESS THAN 10% UNKNOWN NUCLEOTIDES | ||||||||
|---|---|---|---|---|---|---|---|---|
| CLADE\CONTINENT | ASIA | EUROPE | NORTH AMERICA | OCEANIA | AFRICA | SOUTH AMERICA | UNKNOWN | TOTAL |
| S | 794 | 1,860 | 3,449 | 664 | 110 | 74 | 0 | 6,951 |
| L | 823 | 3,196 | 600 | 65 | 4 | 11 | 0 | 4,699 |
| V | 247 | 4,687 | 402 | 253 | 13 | 23 | 0 | 5,625 |
| G | 979 | 20,928 | 6,568 | 1,106 | 1,141 | 461 | 0 | 31,183 |
| GH | 2,058 | 10,325 | 23,916 | 964 | 232 | 176 | 0 | 37,671 |
| GR | 2,657 | 42,888 | 5,251 | 11,135 | 1,632 | 1,129 | 0 | 64,692 |
| GV | 3 | 12,229 | 3 | 14 | 0 | 0 | 0 | 12,249 |
| O | 2,220 | 1,127 | 553 | 531 | 60 | 25 | 0 | 4,516 |
| Non-human host | 35 | 247 | 19 | 0 | 1 | 4 | 13 | 319 |
| #Total | 9,816 | 97,487 | 40,761 | 14,732 | 3,193 | 1,903 | 13 | 167,905 |
| (B) NUMBER OF SEQUENCES WITH LESS THAN 1% UNKNOWN NUCLEOTIDES | ||||||||
| CLADE\CONTINENT | ASIA | EUROPE | NORTH AMERICA | OCEANIA | AFRICA | SOUTH AMERICA | UNKNOWN | TOTAL |
| S | 731 | 1,047 | 3,056 | 466 | 71 | 58 | 0 | 5,429 |
| L | 760 | 1,964 | 549 | 49 | 2 | 10 | 0 | 3,334 |
| V | 228 | 3,036 | 366 | 207 | 10 | 17 | 0 | 3,864 |
| G | 877 | 15,200 | 5,071 | 858 | 634 | 300 | 0 | 22,940 |
| GH | 1,923 | 8,365 | 19,014 | 717 | 191 | 150 | 0 | 30,360 |
| GR | 2,425 | 32,518 | 4,549 | 9,166 | 1,180 | 871 | 0 | 50,709 |
| GV | 3 | 10,712 | 3 | 11 | 0 | 0 | 0 | 10,729 |
| O | 1,824 | 522 | 349 | 415 | 30 | 9 | 0 | 3,149 |
| Non-human host | 30 | 176 | 19 | 0 | 1 | 0 | 13 | 239 |
| #Total | 8,801 | 73,540 | 32,976 | 11,889 | 2,119 | 1,415 | 13 | 130,753 |
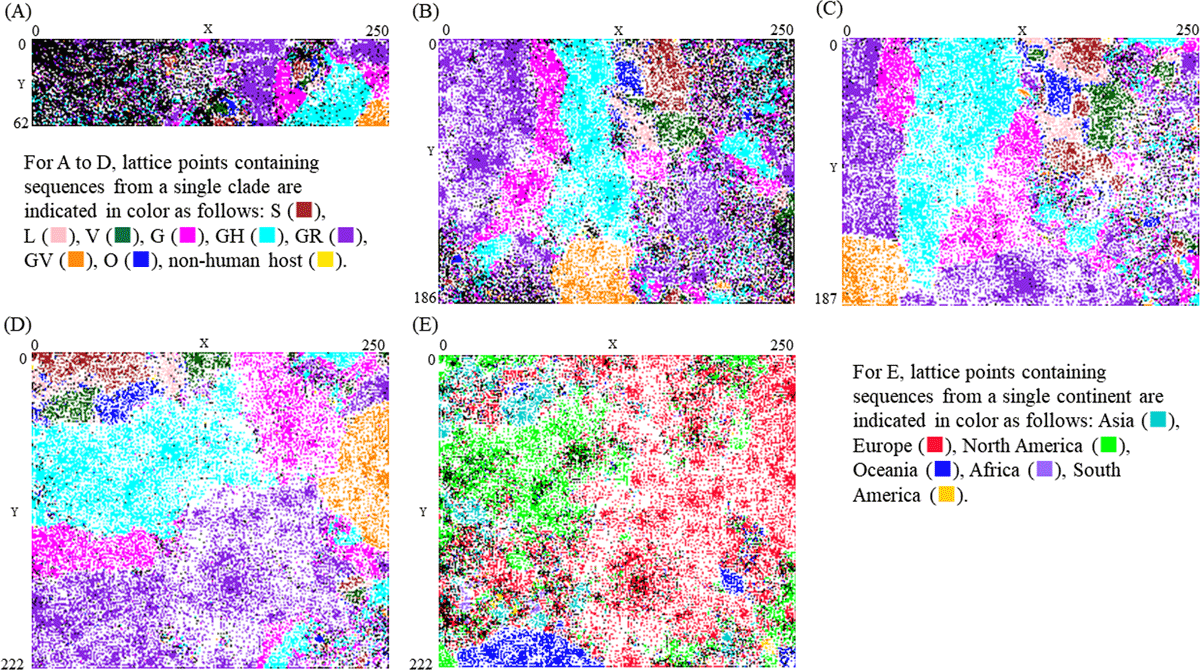
Figure 1
BLSOM for pentanucleotide usage. (A) Pentanucleotide composition and (B) their odds ratio for sequences with less than 10% unknown nucleotides. (C) Pentanucleotide composition and (D) their odds ratio for sequences with less than 1% unknown nucleotides. Lattice points that include sequences from more than one clade are indicated in black, those that contain no genomic sequences are indicated by blank, and those containing sequences from a single clade are indicated in color as follows: S ( ), L (
 ), V (
 ), G (
 ), GH (
 ), GR (
 ), GV (
 ), O (
 ), non-human host (
 ). (E) Distribution of sequences by continent on the BLSOM with the pentanucleotide odds ratio. Lattice points that include sequences from more than one continent are indicated in black, those that contain no genomic sequences are indicated by blank, and those containing sequences from a single continent are indicated in color as follows: Asia (
 ), Europe (
 ), North America (
 ), Oceania (), Africa (
 ), South America (
 ).
).
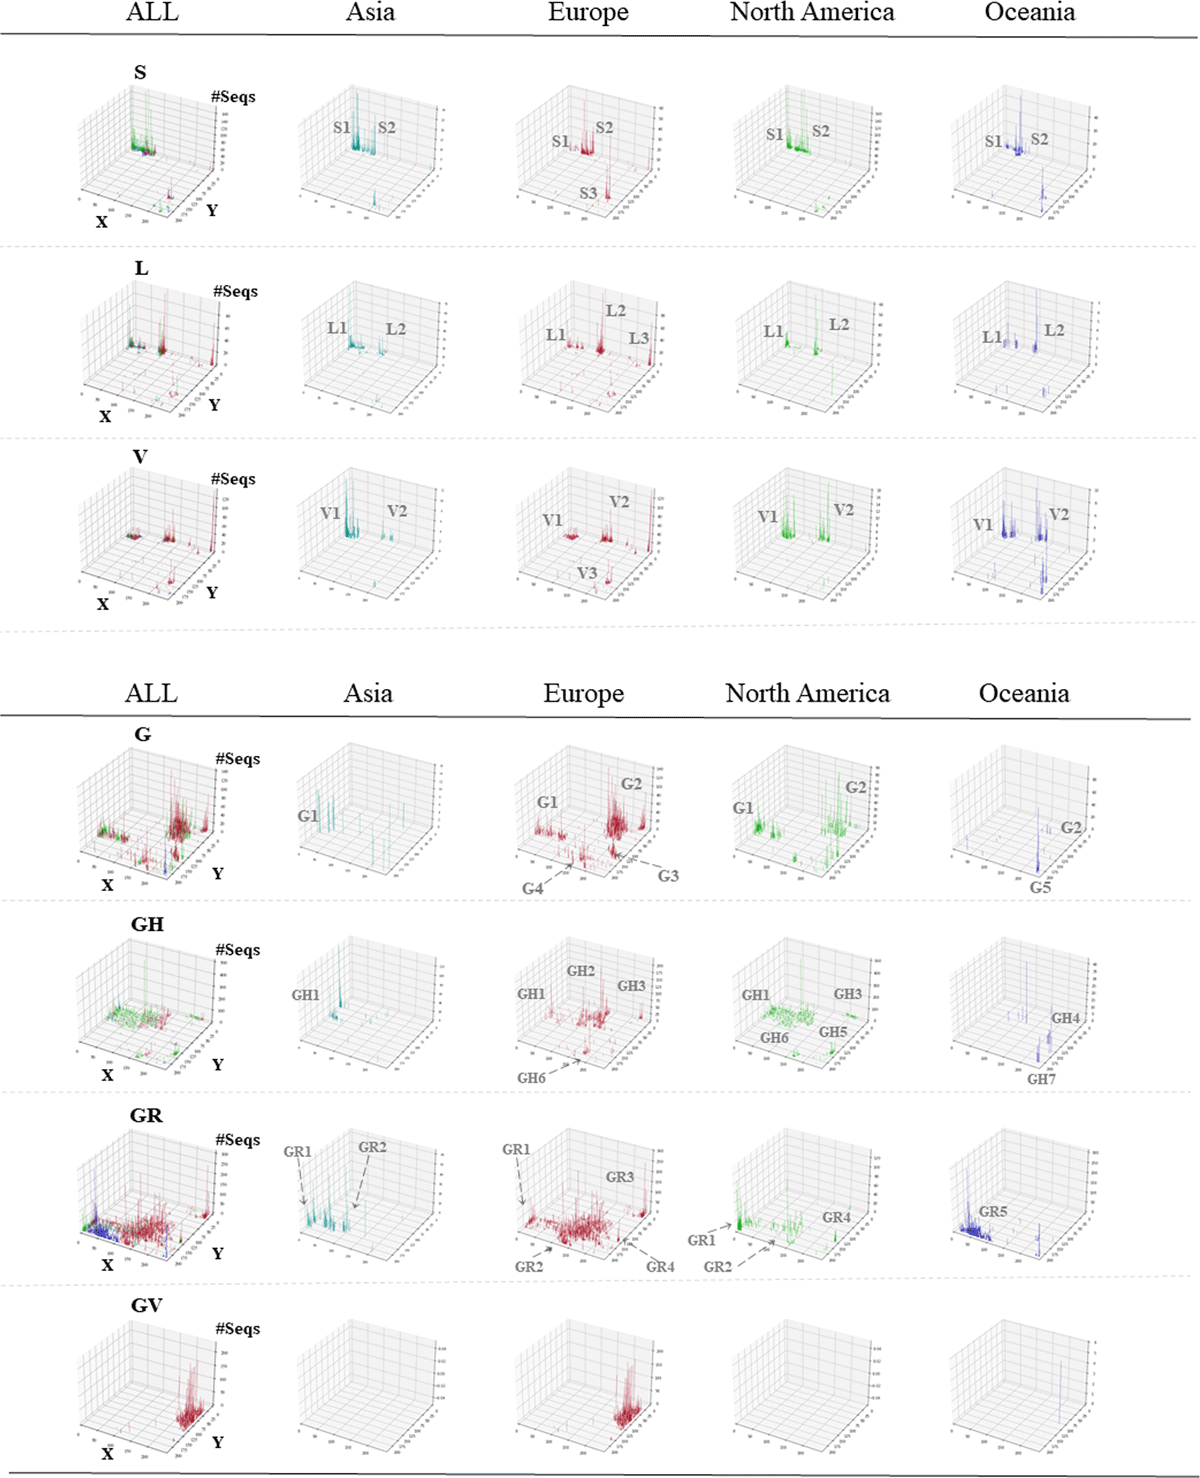
Figure 2
3D display of viral classification by clade and continent. The Z-axis corresponds to the number of sequences attributed to each lattice point. Results for all continents are shown in the ALL panel for each clade. In clades G, GH, GR and GV, lattice points where less than 5 sequences exist are not shown. The vertical bars for individual continents are distinguished by the following colors: Asia (), Europe (), North America (), Oceania (). Different subclusters are given suffix numbers.
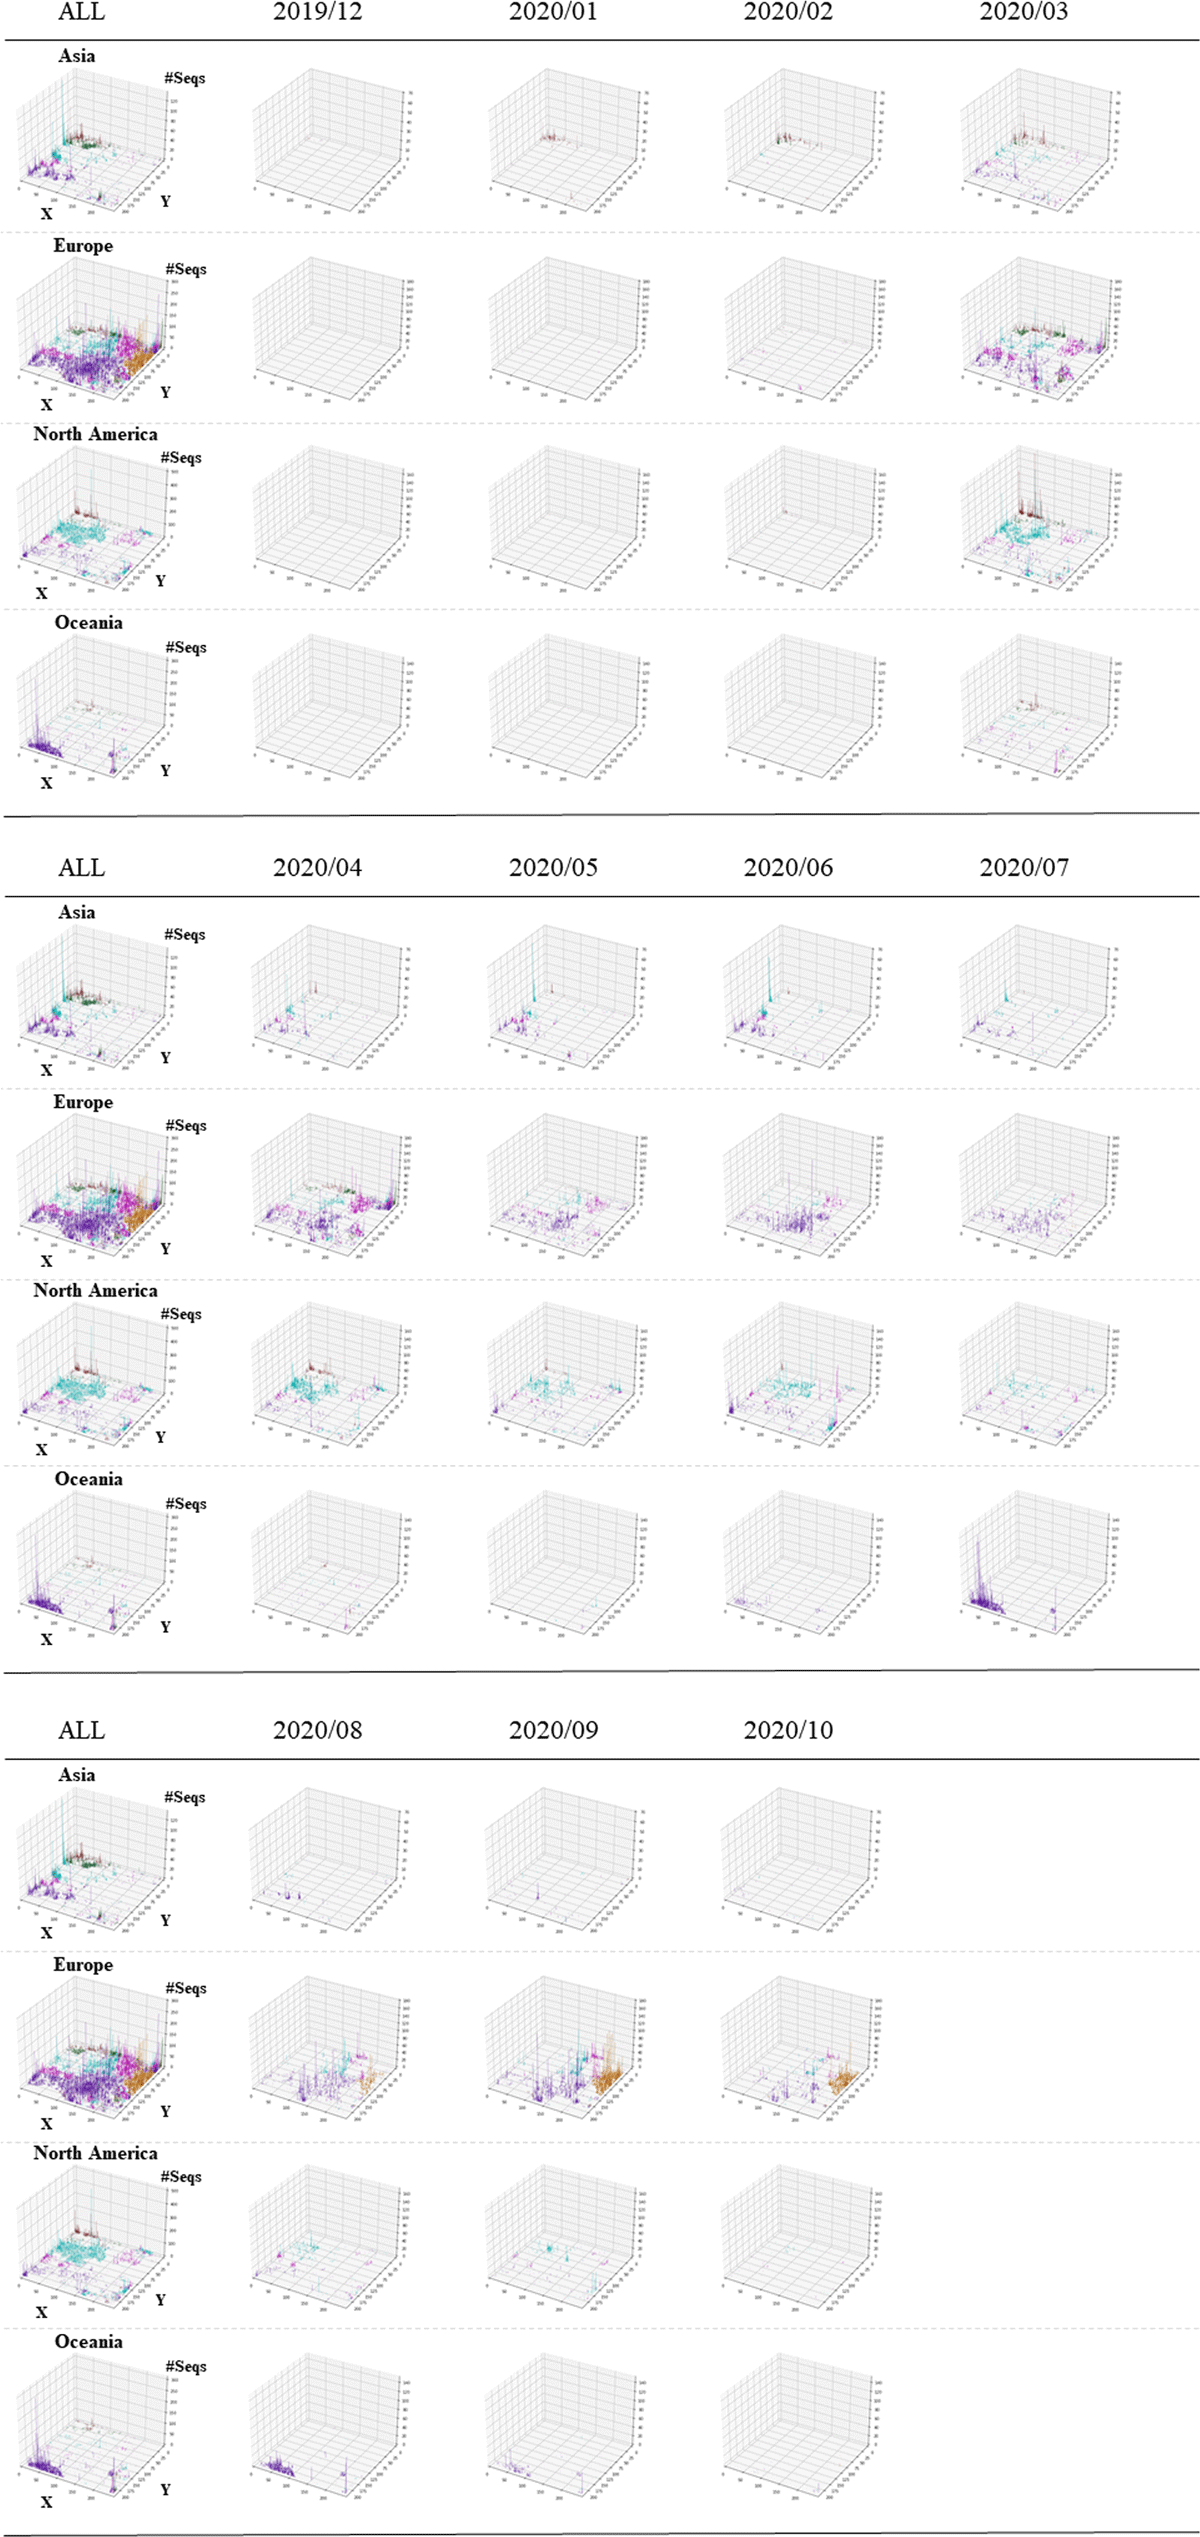
Figure 3
3D display of temporospatial changes. The Z-axis corresponds to the number of sequences attributed to each lattice point. Results for all collection months are shown in the ALL panel for each continent. The vertical bars for individual clades are distinguished by the following colors: S (), L (), V (), G (), GH (), GR (), GV ().
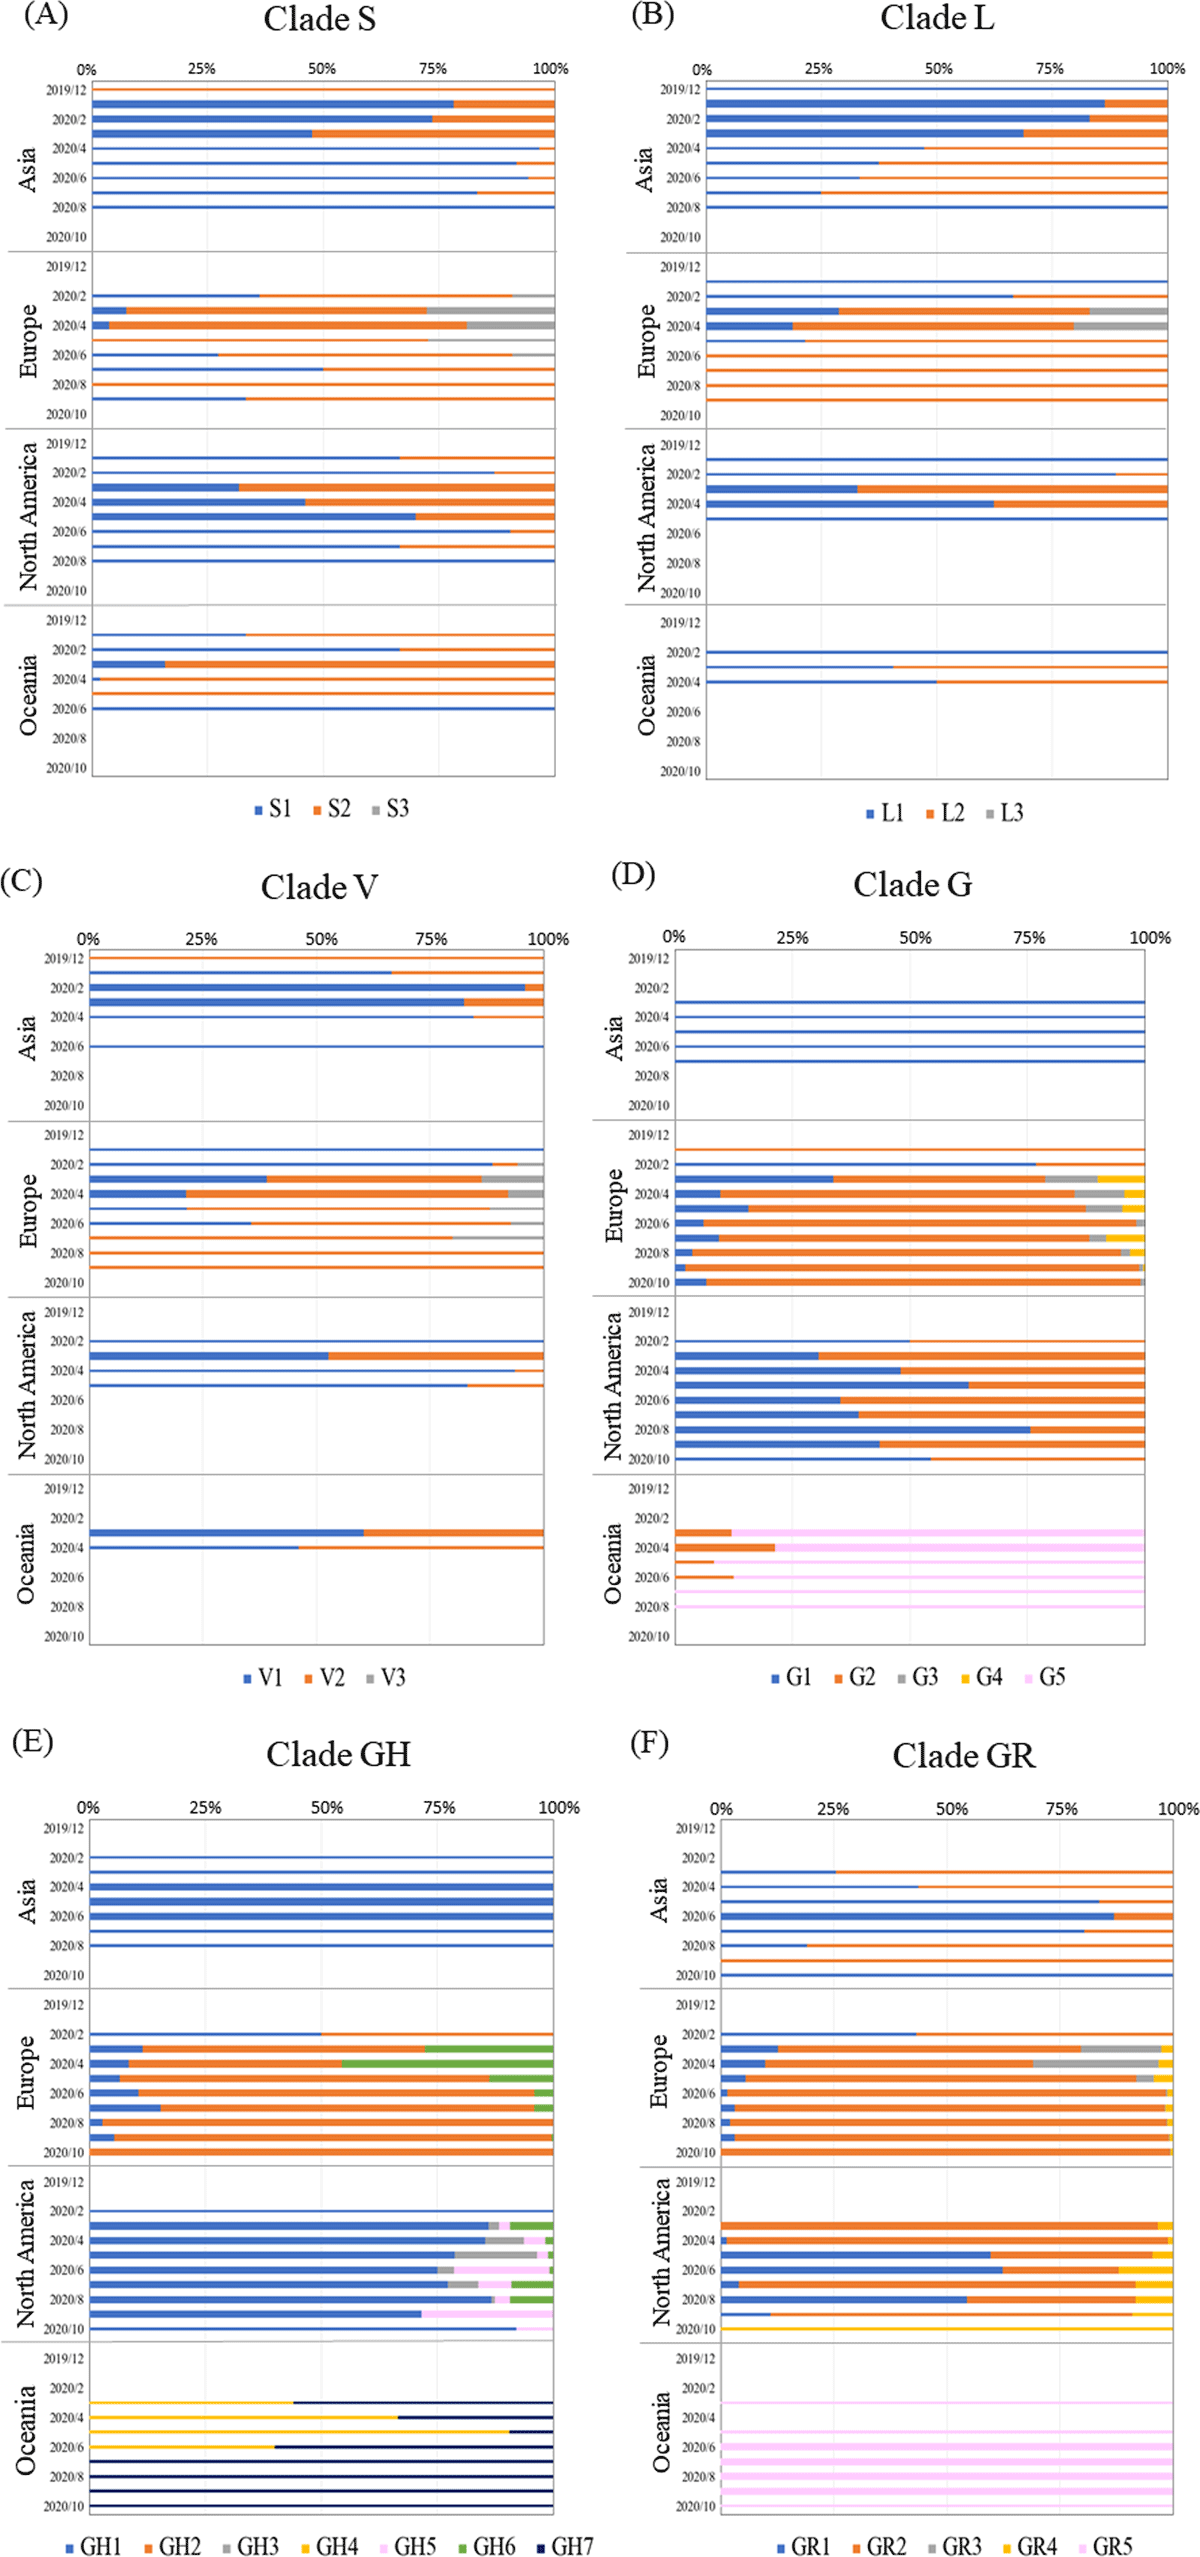
Figure 4
Analysis of 100% stack bar graph for time-series transition in each continent for each subcluster in clades S (A), L (B), V (C), G (D), GH (E), and GR (F). The colors of each subcluster are indicated at the bottom of each figure. The results for months with more than 100 sequences are shown as thick horizontal bars. The number of sequences used in this analysis is given in Supplementary Table S1.