
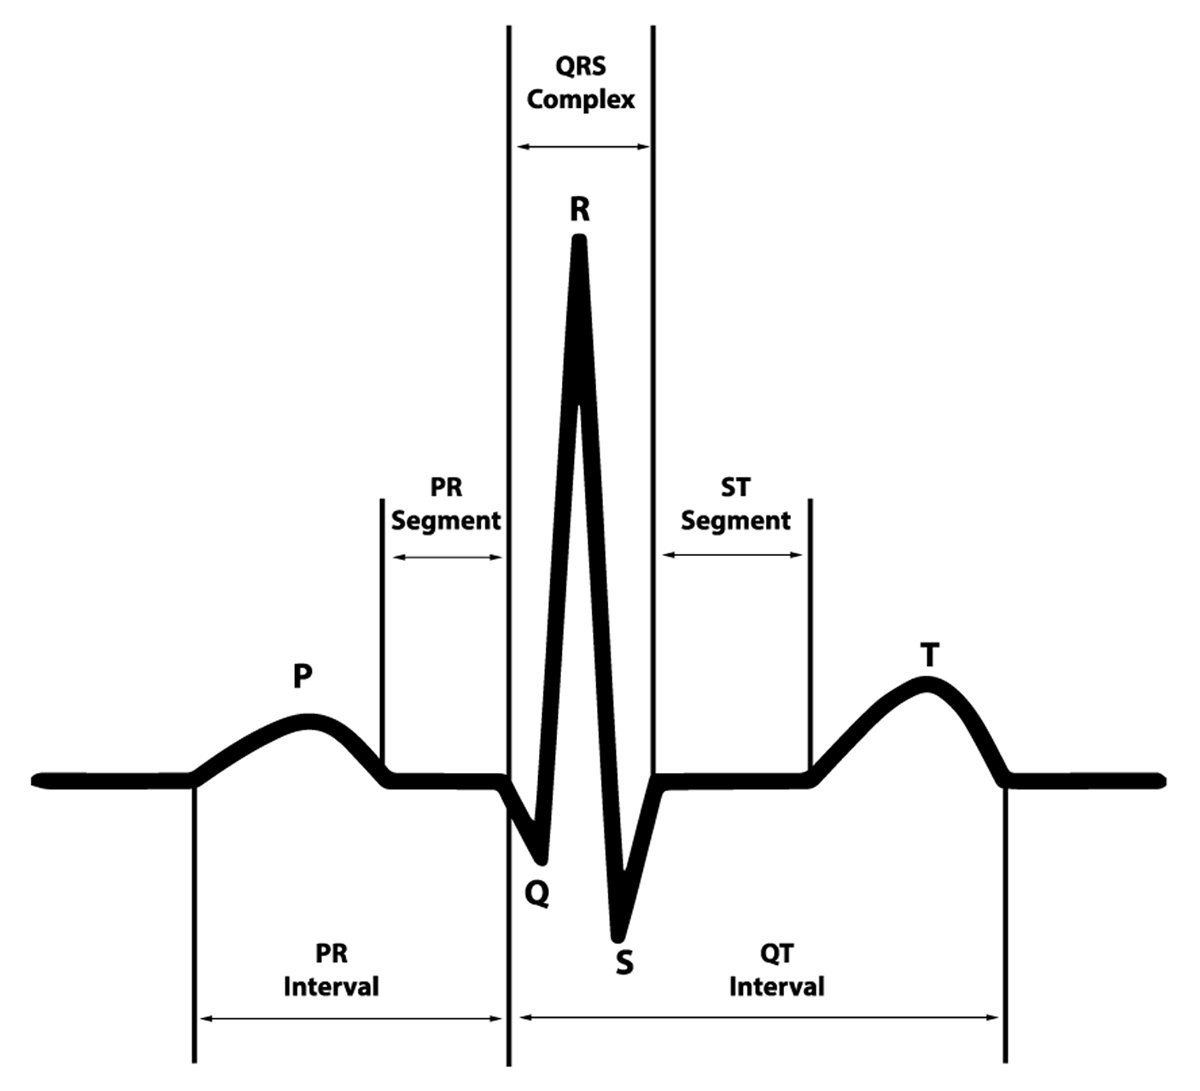
Figure 1
The ECG waveform and segments in lead II that presents a normal cardiac cycle.
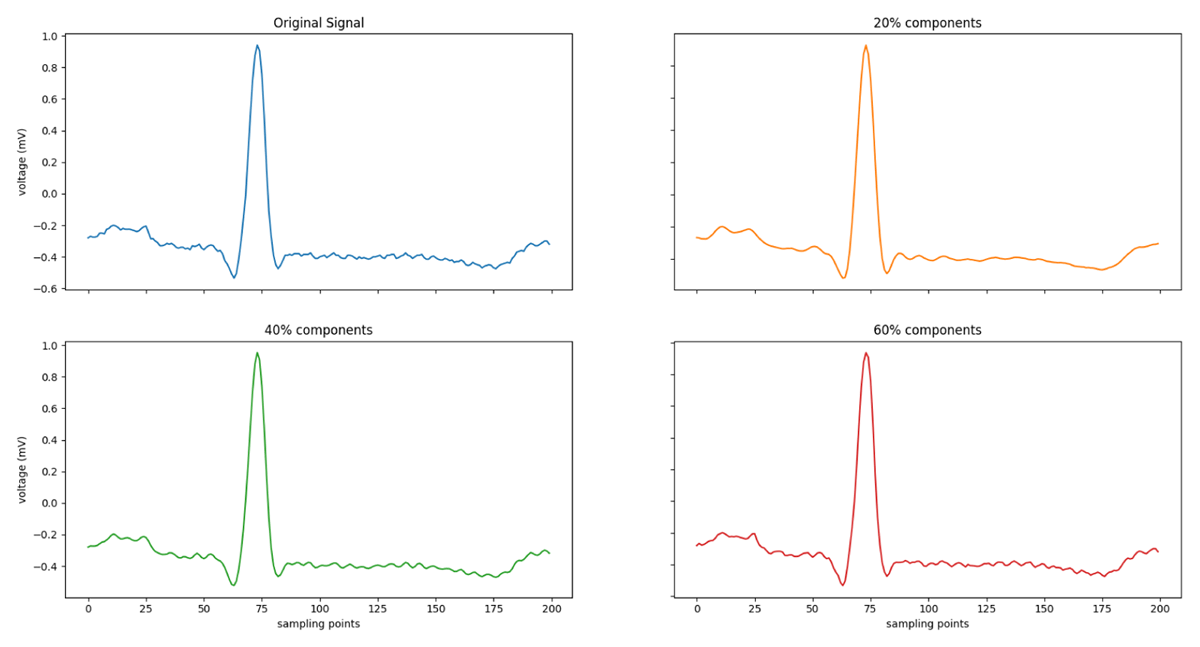
Figure 2
One heartbeat ECG presented by 100%, 20%, 40%, and 60% respectively.
Table 1
Accuracy* comparison between classification models using original variables and principal components**.
| CLASSIFIER NAME | NON PCA | PCA** | THE DIFFERENCE |
|---|---|---|---|
| Random Forest | 0.96 | 0.92 | –0.04 |
| Conditional Random Forest | 0.96 | 0.90 | –0.06 |
| Naive Bayes | 0.92 | 0.87 | –0.05 |
| Multinomial Logistic Regression | 0.94 | 0.94 | –0.001 |
| Quadratic Discriminant Analysis | 0.93 | 0.90 | –0.02 |
[i] * Accuracy is the average of 10 stratified folds.
** Principal components accounting for 99% of the variance used.