
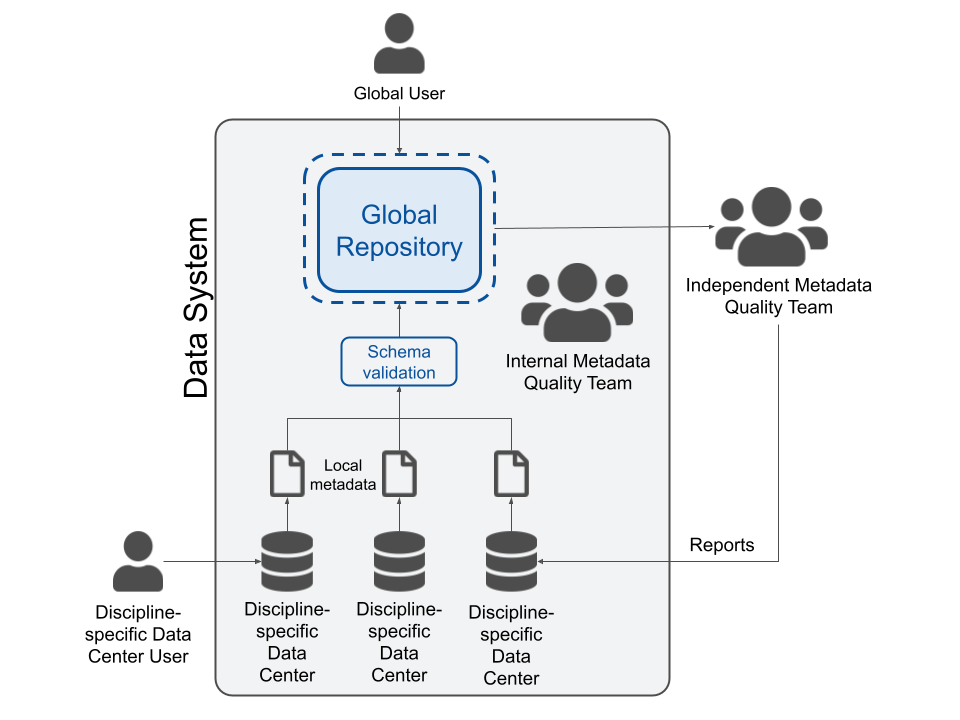
Figure 1
A conceptual model of the metadata quality assessment process within a data system. A data system is made up of discipline-specific centers that contribute metadata to a centralized global catalog. To conduct assessments, an independent quality team systematically reviews metadata within the global catalog and reports findings to the discipline-specific data centers. The discipline-specific data center curators update the metadata and resubmit it to the global catalog, improving the quality. The discipline-specific data centers, the internal metadata quality team and the independent quality team work together to improve the metadata standards and content. For NASA, EOSDIS is the data system, the DAACs are the discipline-specific data centers, EED2 is the internal metadata quality team and ARC is the independent metadata quality team.
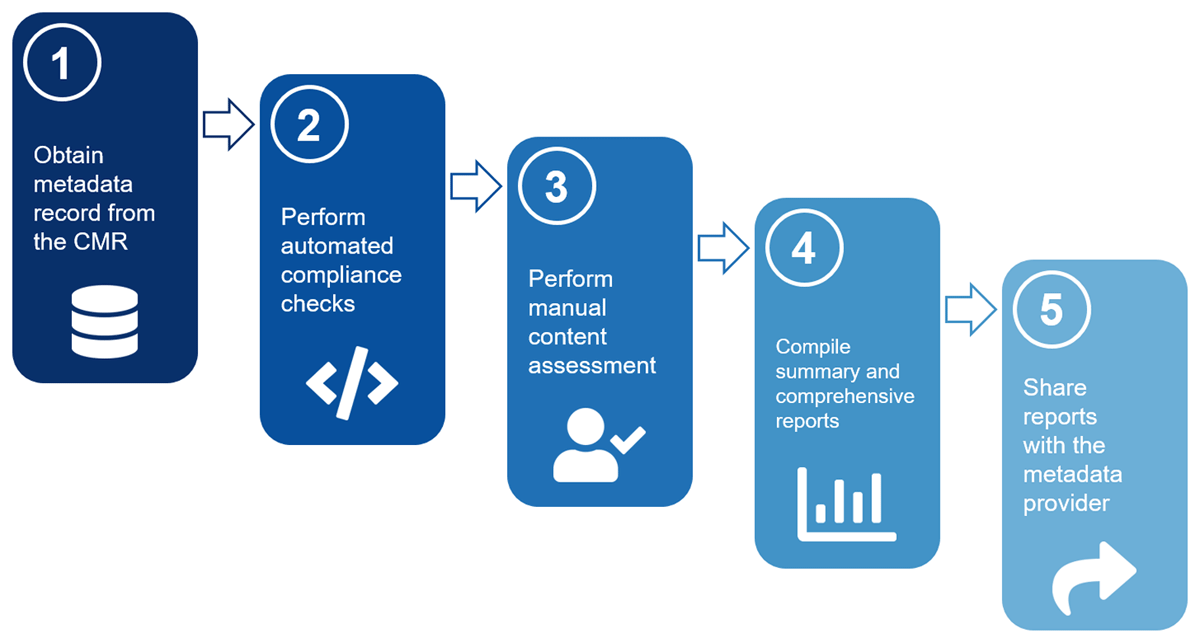
Figure 2
The ARC metadata assessment process.
Table 1
Select automated and manual checks performed by the ARC team during the assessment process.
| AUTOMATED CHECKS | MANUAL CHECKS | |
|---|---|---|
| Data Identification |
|
|
| Descriptive Keywords |
|
|
| URLs |
|
|
| Acquisition Information |
|
|
Table 2
The ARC team’s assessment priority matrix. A priority matrix is documented for each metadata concept and identifies the criteria that indicate whether a finding should be flagged as high, medium or low priority.
| PRIORITY CATEGORIZATION | JUSTIFICATION |
|---|---|
| Red = High Priority Findings | Emphasizes metadata completeness, accuracy
and data accessibility. Metadata that fails to meet CMR requirements
or that are factually incorrect constitute a high priority finding.
Examples:
Metadata fields flagged as red are required to be addressed by the data center. |
| Yellow = Medium Priority Findings | Emphasizes metadata completeness and
consistency - recommendations focus on ways to help improve data
discoverability and usability that go beyond CMR requirements.
Examples:
Data centers are highly encouraged to address yellow findings and are encouraged to provide a rationale for unaddressed items. |
| Blue = Low Priority Findings | Documents minor metadata consistency,
completeness and accuracy issues. Examples:
Addressing blue findings are optional and up to the discretion of the data center. |
| Green = No Findings/Issues | Metadata elements flagged green are free of issues and require no action on behalf of the data center. |
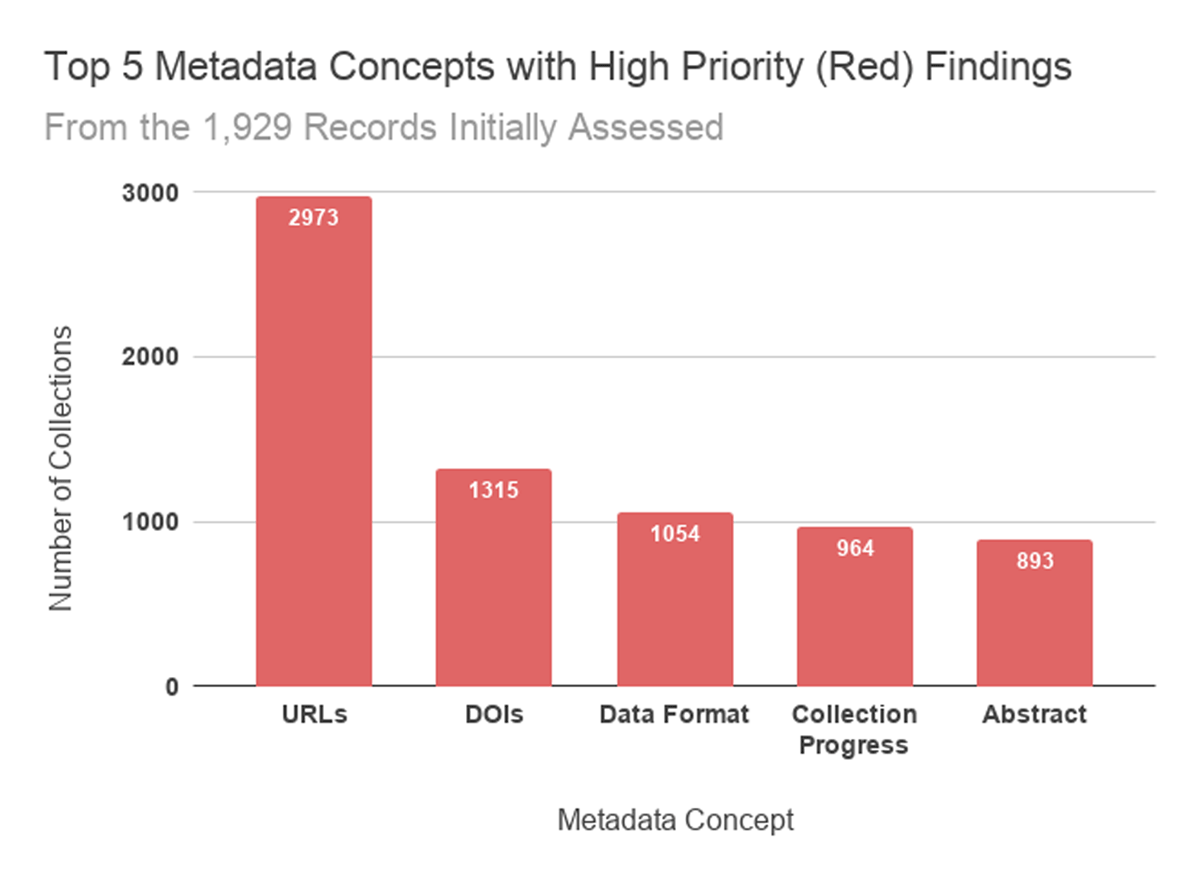
Figure 3
The five collection level metadata concepts that received the most high priority recommendations from the ARC team. Since URLs appear in multiple UMM metadata elements, the number of reported findings shown is more than the number of records reviewed.
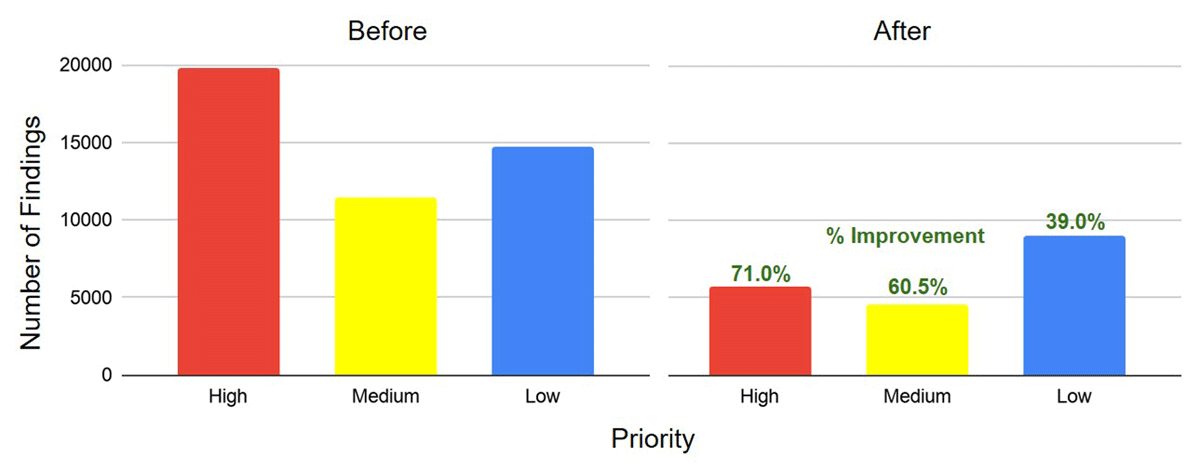
Figure 4
The cumulative number of findings in the high (red), medium (yellow) and low (blue) categories for the nine data centers upon initial assessment (left) and after reassessment (right). The percent improvement in the number of findings is shown above the right three columns.