
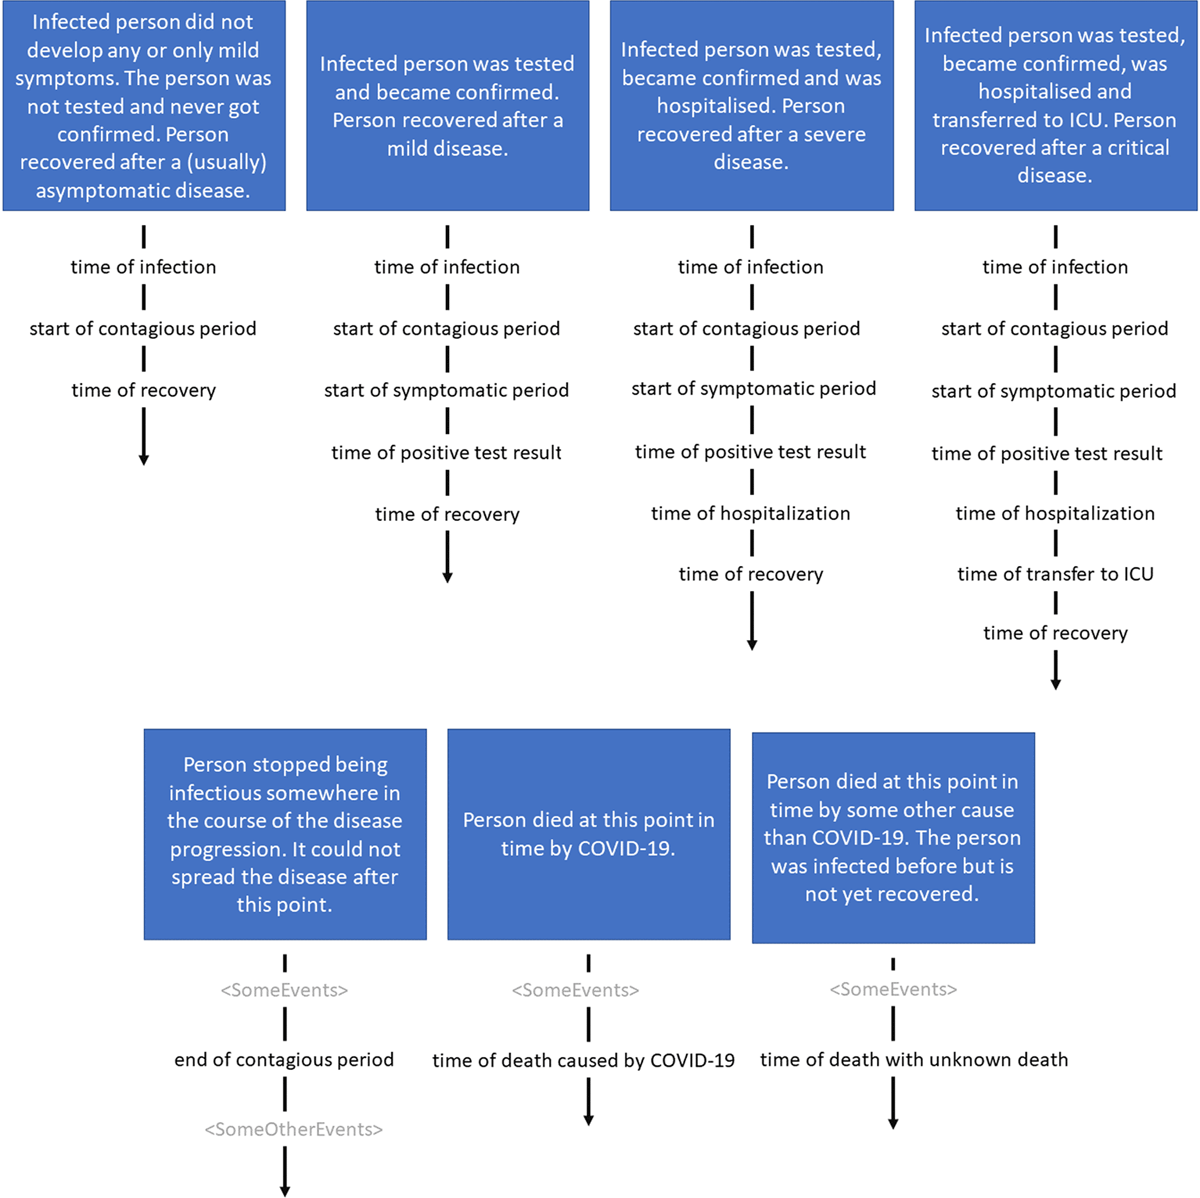
Figure 1
Illustration of different disease and treatment pathways from an agent or patient perspective.
Table 1
Data fields contained in an excerpt of a case reporting database.
| COLUMN NAME | DESCRIPTION |
|---|---|
| patient ID | Random index or identifier. |
| age group | Age of the patient aggregated in six groups (<20, 20–34, 35–49, 50–64, 65–79, >79). |
| gender | Gender of the patient. |
| province | Regional attribution of the patient. |
| region code | Additional regional attribution of the patient as 3-digit code. The used regional structuring does not align with administrative structuring but was developed by Austrian health care institutions to fit their specific needs Federal Ministry of Social Affairs Health Care and Consumer Protection 2020c). |
| region name | Additional regional attribution of the patient as name. See notes above. |
| time of diagnosis | Week of the year when the patient was officially diagnosed with COVID-19 by a certified health care facility. This field is available for all recorded patients. |
| time of death | Date when the patient deceased. A patient is registered as deceased only if the passing was officially related to COVID-19 by an authorized institution. Otherwise this field is empty. |
| time of recovery | Date when the patient was considered recovered. A patient is considered recovered either if sufficient negative test-results were obtained or if the patient was in quarantine for two weeks after the initial diagnosis. The latter is relevant in particular for patients with mild symptoms. Either a recovery date or a deceased date must be present. |
Table 2
Fields in a synthetic data set generated with an agent-based simulation model. The data is available in (Rippinger et al. 2020). Additional information on the data fields and their interpretation is available in the same reference and in the following sections of this paper.
| COLUMN NAME | DESCRIPTION |
|---|---|
| patient ID | Agent identifier. |
| date of birth | Date when the virtual person was born. |
| gender | Gender of the virtual patient. |
| time of infection | Date of the patient (agent) getting infected. This timestamp is available for every patient contained in the synthetic case-reporting data set. This information is not observable in reality. |
| start of contagious period | Point in time when the patient starts being contagious. Corresponds to the end of the latent period. This information is not observable in reality. |
| end of contagious period | Point in time when the patient stops being contagious. |
| start of symptomatic period | Corresponds to the timestamp when the patient is due to get tested. Hence, we implicitly assume that all persons experiencing symptoms are getting tested. Vice versa, most often the cause for initiating a test is the patient experiencing symptoms. However, we do not differentiate between the motives for initiating the testing process (e.g. being traced as a contact partner, being screened randomly, or actively suspecting a possible infection due to prior contacts). If present, this date is always two days after the agent became infectious, which corresponds to the average pre-symptomatic phase (incubation period) as reported in studies (Robert Koch Institut 2020). |
| time of positive test result | Timestamp when a positive test result is obtained. |
| time of hospitalization | Timestamp of hospitalization of the patient. This event to occur requires previous testing. |
| time of transfer to ICU | Timestamp of transfer to intensive care unit. This event to occur requires previous hospitalization. |
| time of recovery | Date when the virtual patient recovers from COVID-19. A recovery event implies that symptoms and infectiousness stop. Analogous to original data set. |
| time of death caused by COVID-19 | Date when the virtual patient dies of an infection with the SARS-CoV-2 virus. Due to model limitations, this event and timestamp is determined retrospectively. |
| time of death with unknown cause | Time of death that is not caused by COVID-19 but implied by the population dynamics. Only one of recovery, death by COVID-19 and death by unknown cause can apply. |
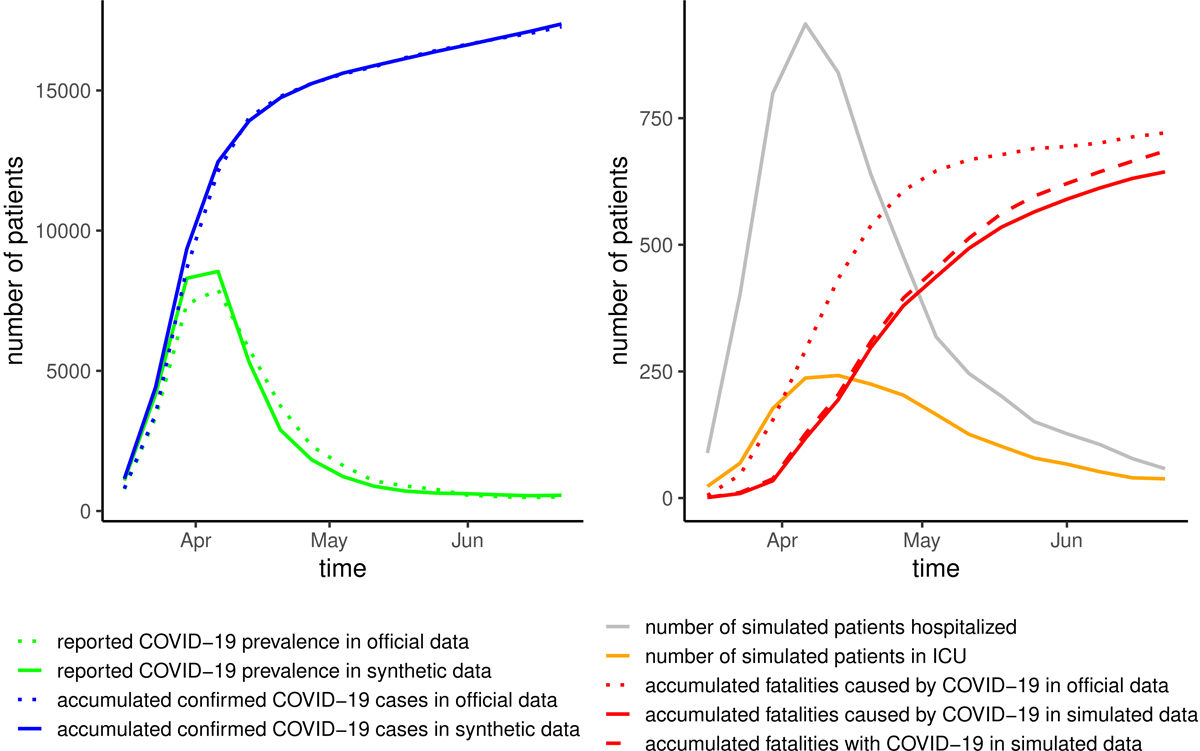
Figure 2
Comparison of real and synthetic data. On the left: The simulation model is calibrated to correctly reproduce the reported prevalence and accumulated number of COVID-19 cases. Right-hand side: The number of reported fatalities caused by COVID-19 is closely approximated in dynamic simulations. The synthetic data provides additional figures on hospitalization that are not included in the original data set.
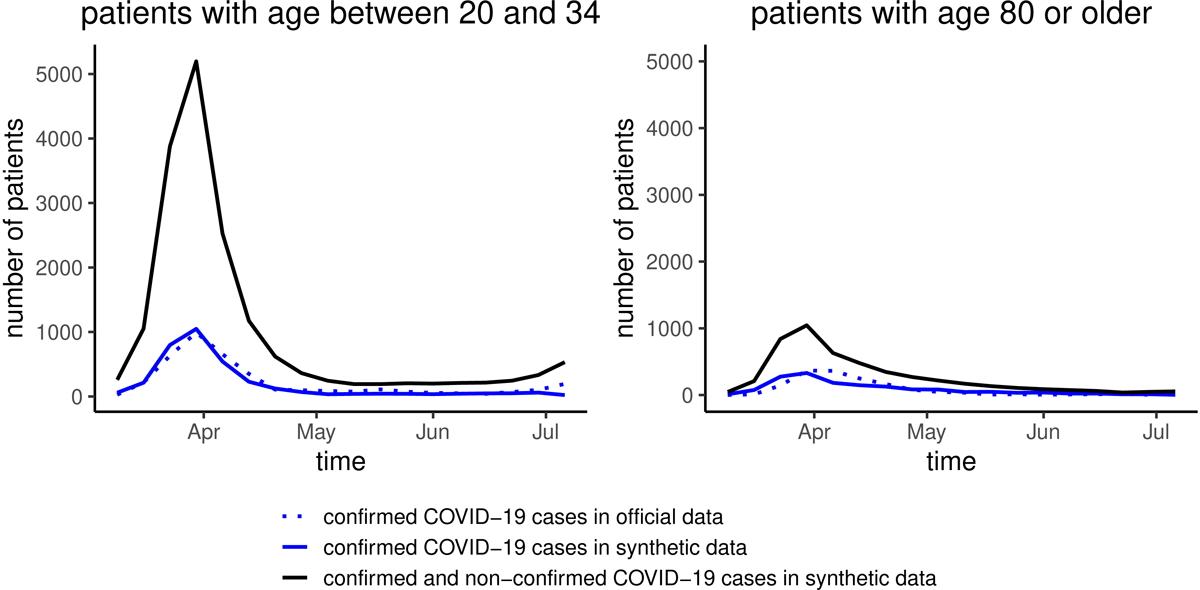
Figure 3
Number of confirmed and unconfirmed cases in different risk groups according to age (low risk: 20–34, high risk: 80+). In contrast to real data, the simulation model also provides the number of unconfirmed cases. We observe that the relative number of unconfirmed cases is higher in the low risk group.