
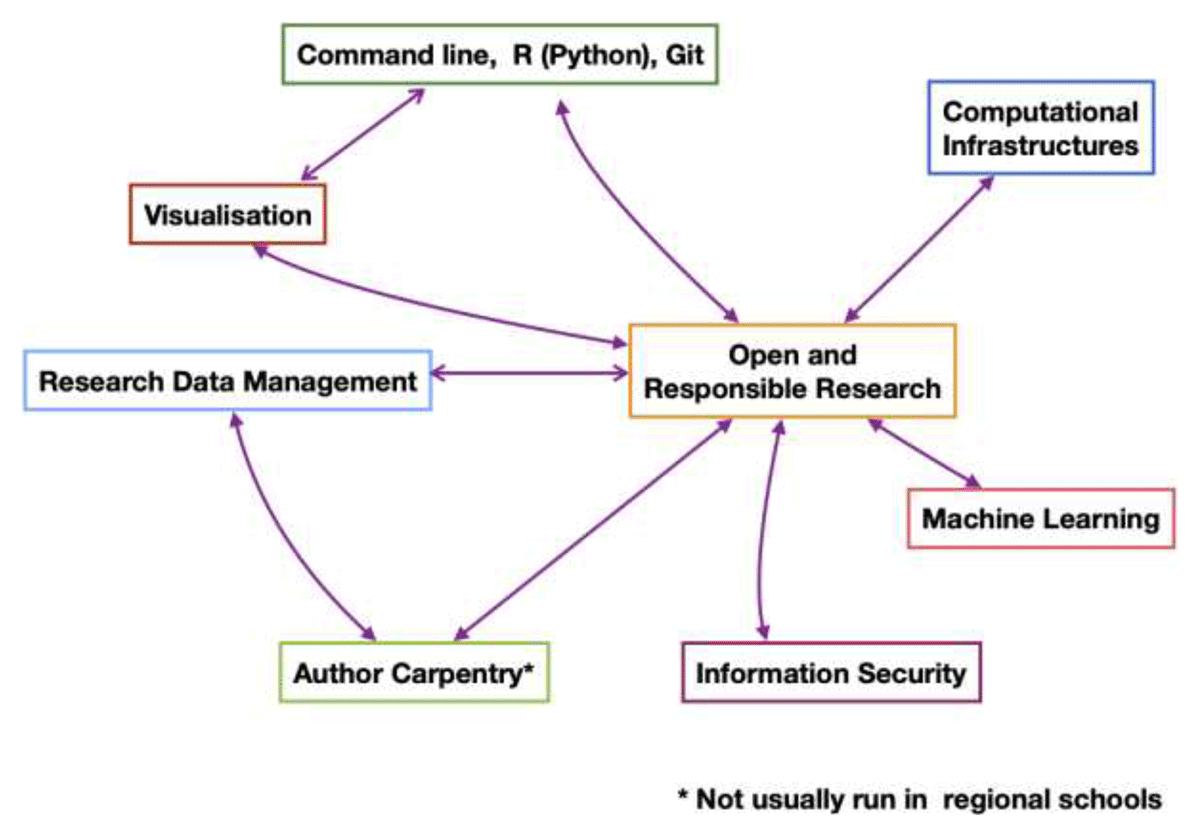
Figure 1
Diagrammatic representation of modules run in the ECR strand of the CODATA-RDA schools.
Table 1
Distribution of survey responses according to specific SRDS.
| SPECIFIC SRDS | PERCENTAGE OF RESPONSES |
|---|---|
| Trieste 2016 | 7% |
| Trieste 2017 | 16% |
| São Paulo 2017 | 8% |
| Trieste 2018 | 13% |
| São Paulo 2018 | 10% |
| Kigali 2018 | 5% |
| Trieste 2019 | 21% |
| Addis Ababa 2019 | 13% |
| San Jose 2019 | 8% |
Table 2
Countries of citizenship represented amongst respondents.
| NUMBER OF RESPONSES | COUNTRY OF CITIZENSHIP |
|---|---|
| 26 | Ethiopia |
| 22 | Brazil |
| 18 | Costa Rica |
| 10 | India, Nigeria |
| 8 | Morocco |
| 6 | Ghana, Iran |
| 5 | Kenya |
| 4 | Sudan |
| 3 | Colombia, Indonesia, Italy, Philippines, Rwanda, South Africa, Uruguay |
| 2 | Algeria, Canada, Cuba, Dominican Republic, Peru, Tanzania, Tunisia, Uganda, Venezuela |
| 1 | Argentina, Belize, Bolivia, Botswana, Egypt, France, Germany, Ireland, Mexico, Mozambique, Namibia, Nepal, Netherlands, Nicaragua, Pakistan, Slovenia, Spain, Zambia, Zimbabwe |
| 6 | Undisclosed |
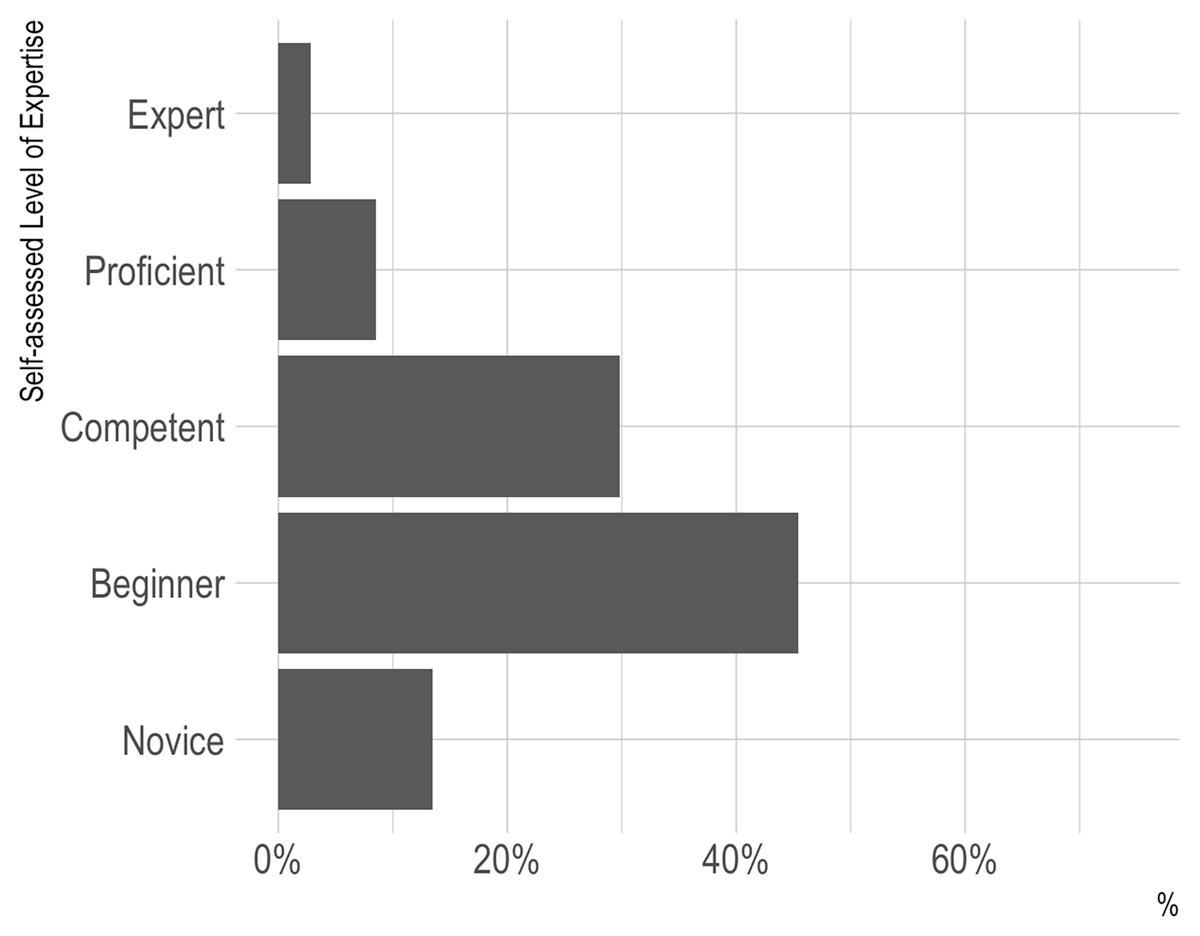
Figure 2
Respondents self-assessed level of expertise in data science before their attendance at SRDS schools.
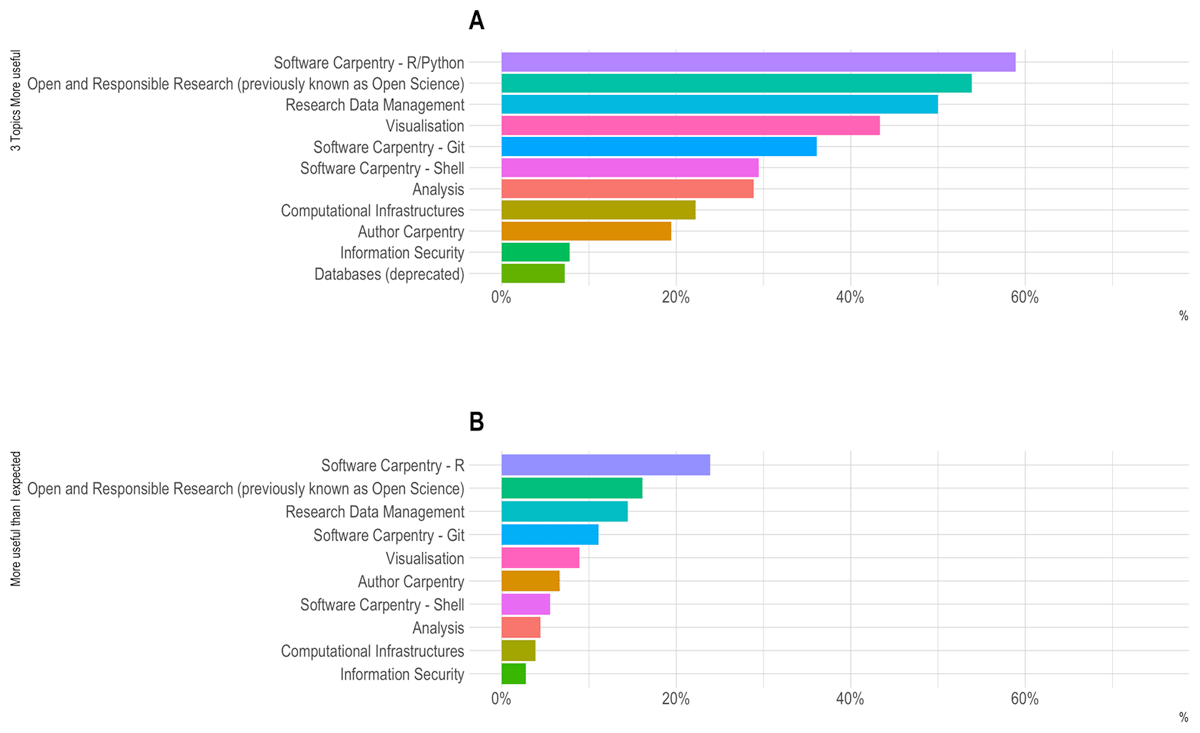
Figure 3
Demonstrating the responses to questions (a) Which three courses were the most useful? (b) Which course was more useful than expected?
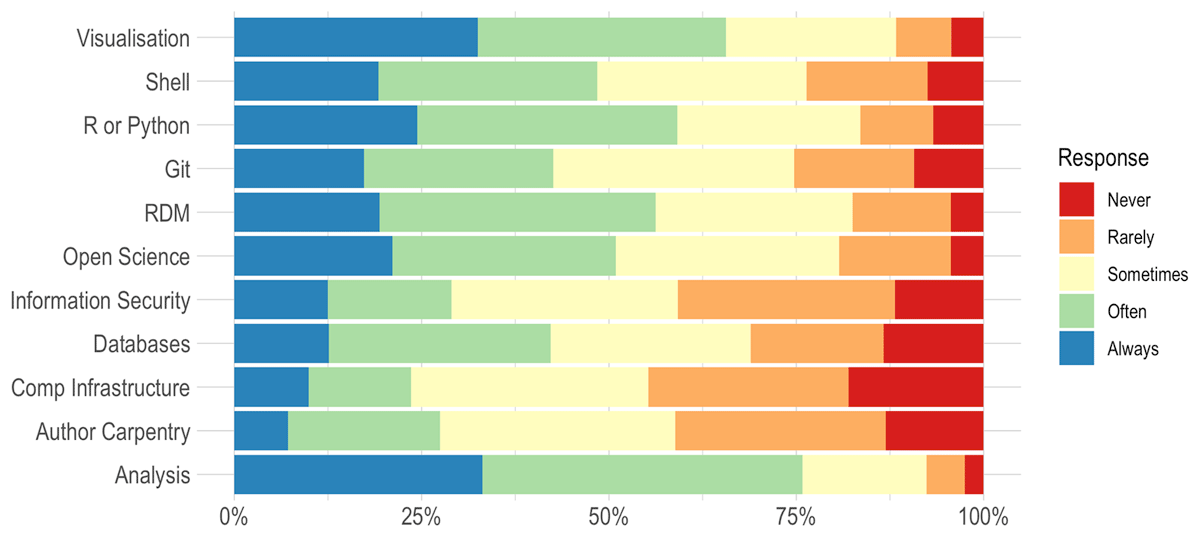
Figure 4
Continued use of tools learnt at SRDS schools.
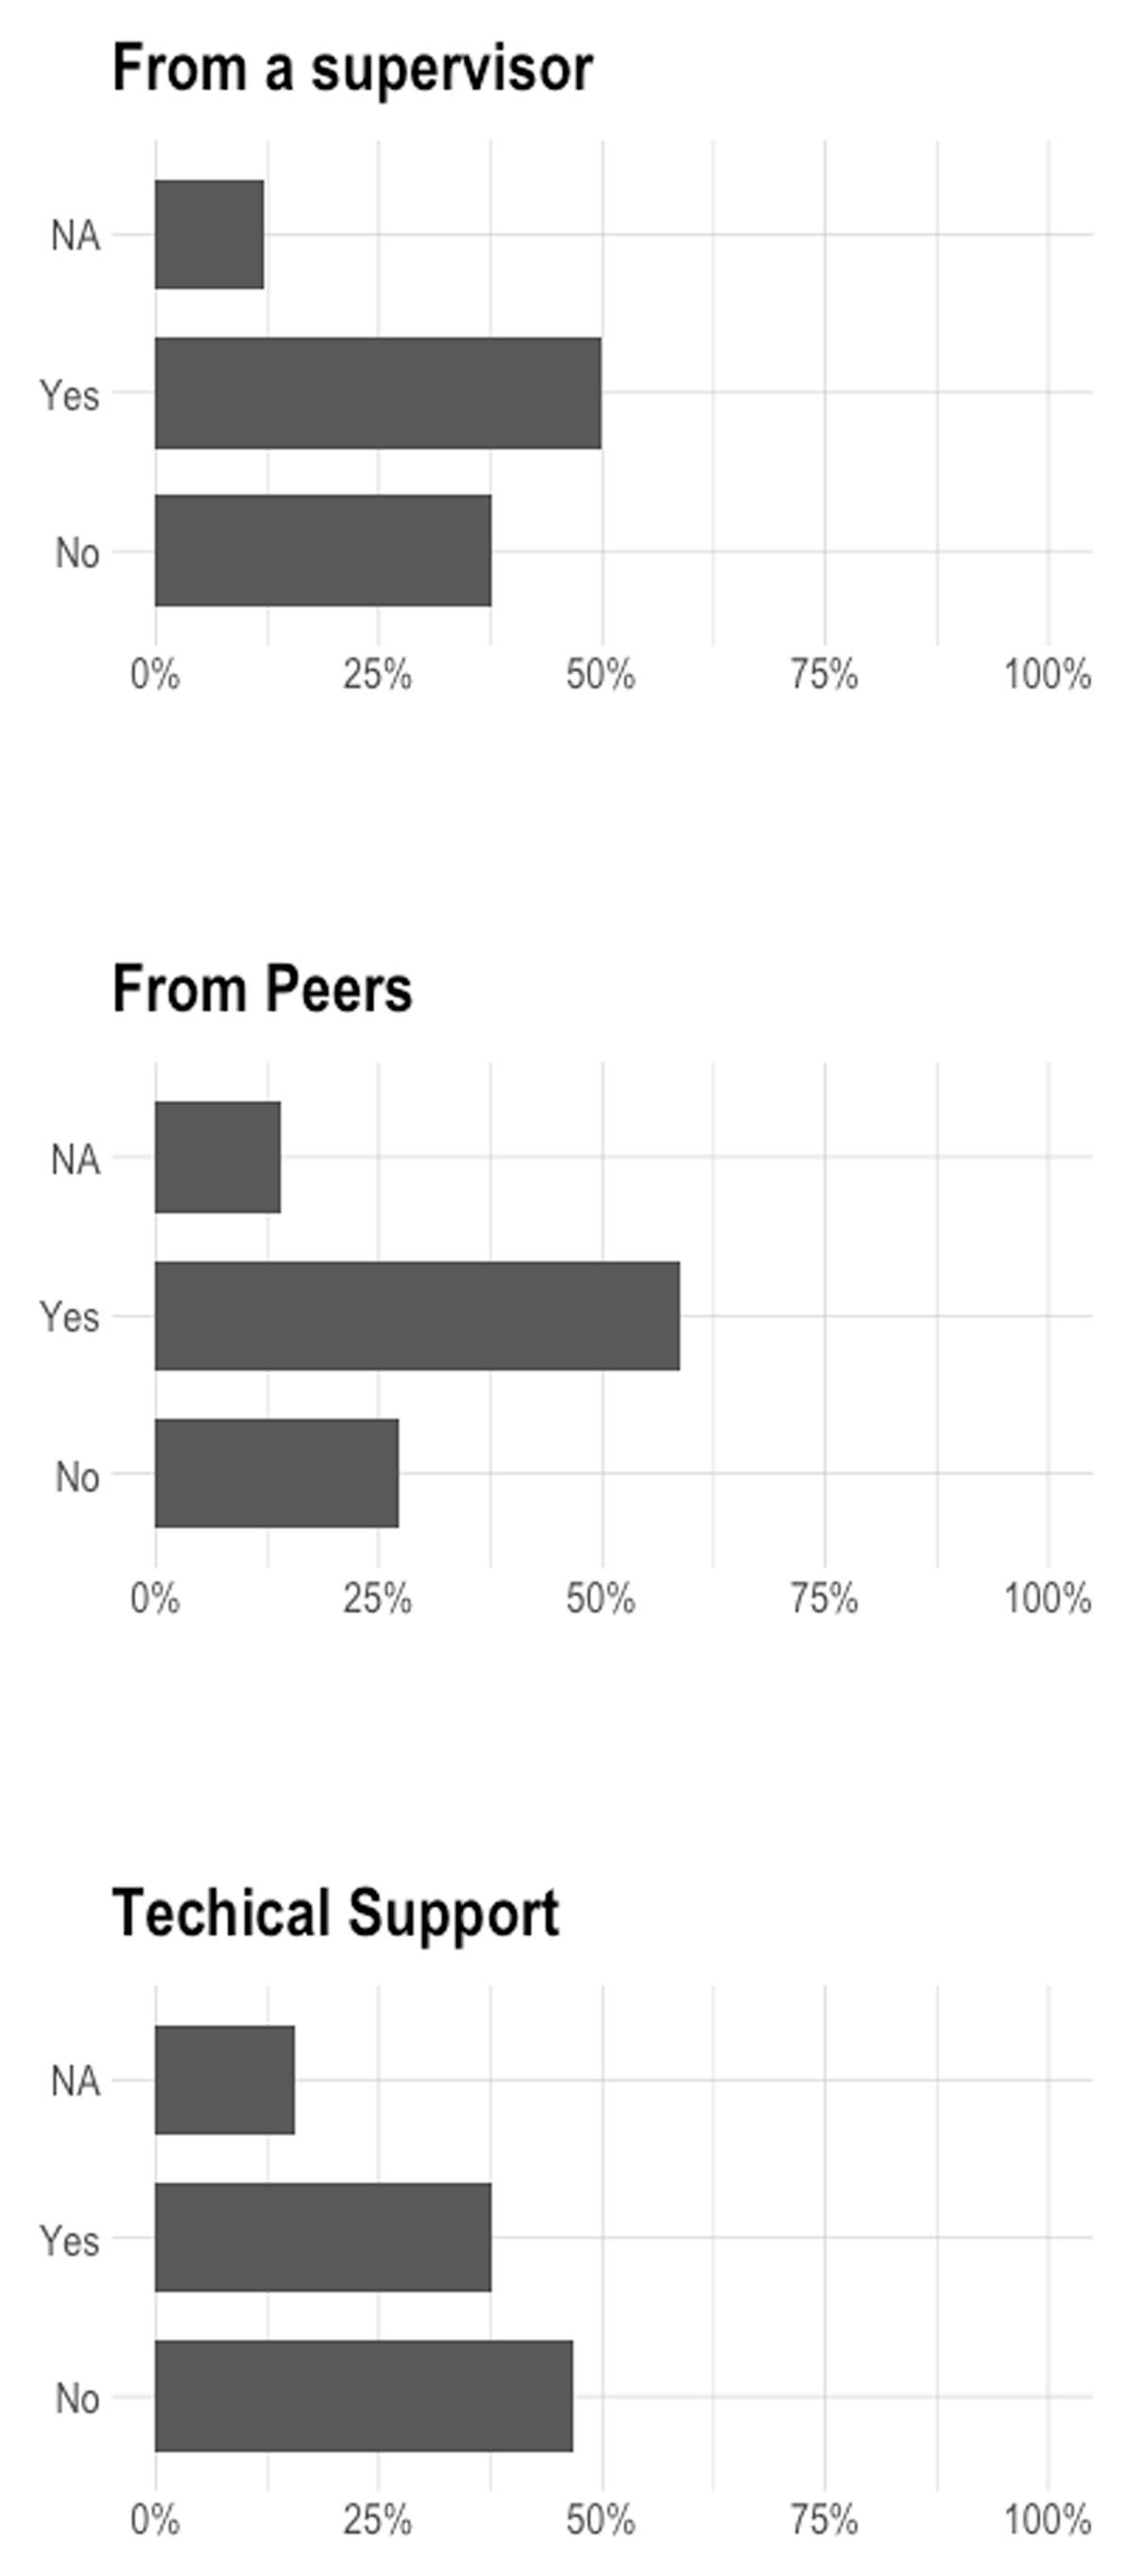
Figure 5
Respondents assessment of the support for data science activities in their home institution.
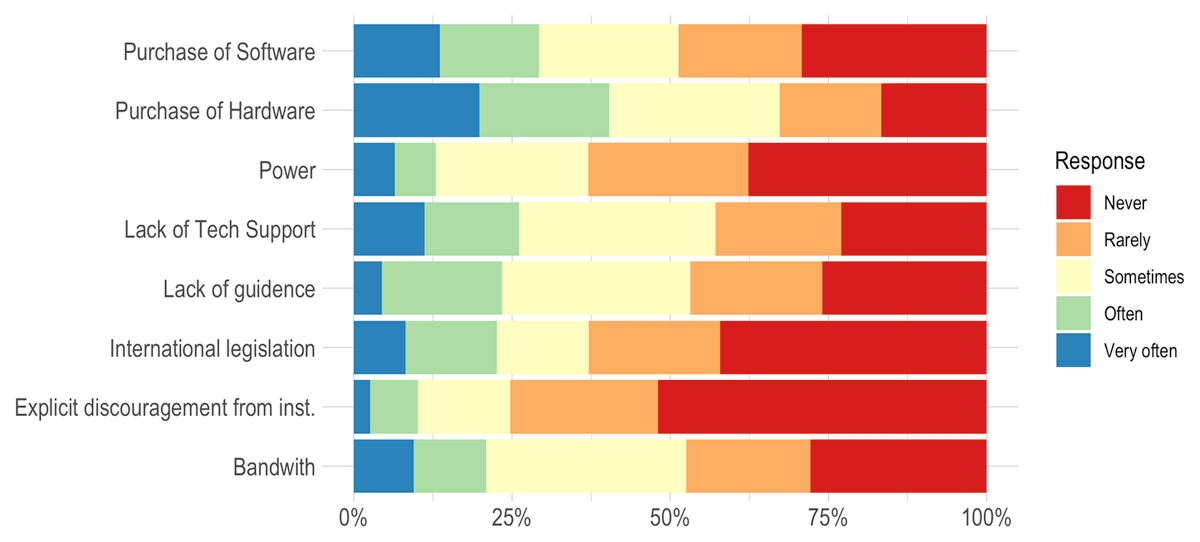
Figure 6
Challenges for using SRDS tools/skills in home institution.
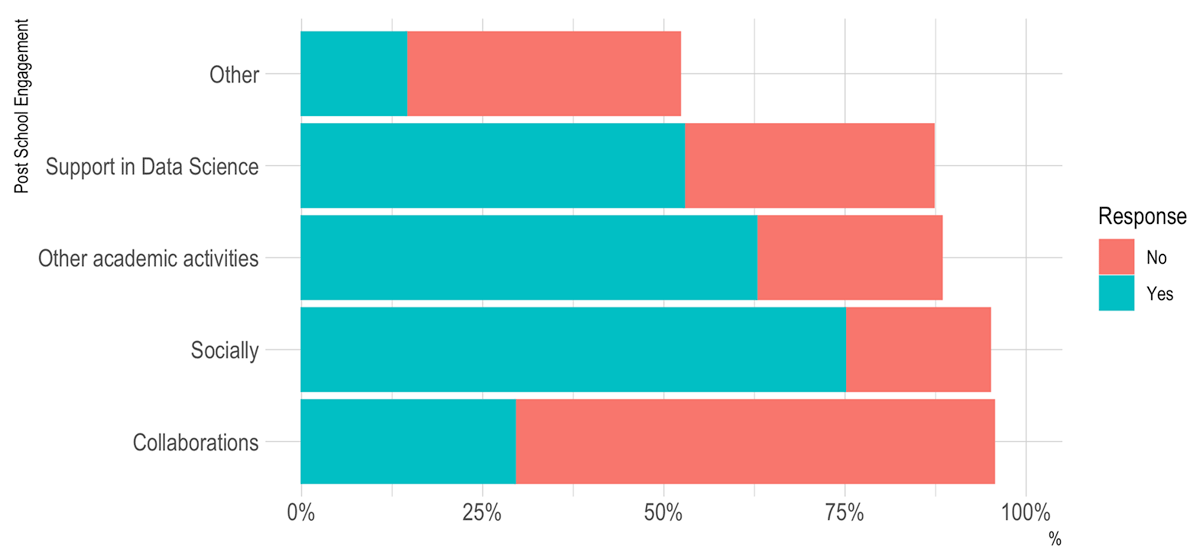
Figure 7
(a) Level of post-school social engagement (b) Level of post-school collaboration with peers and instructors.
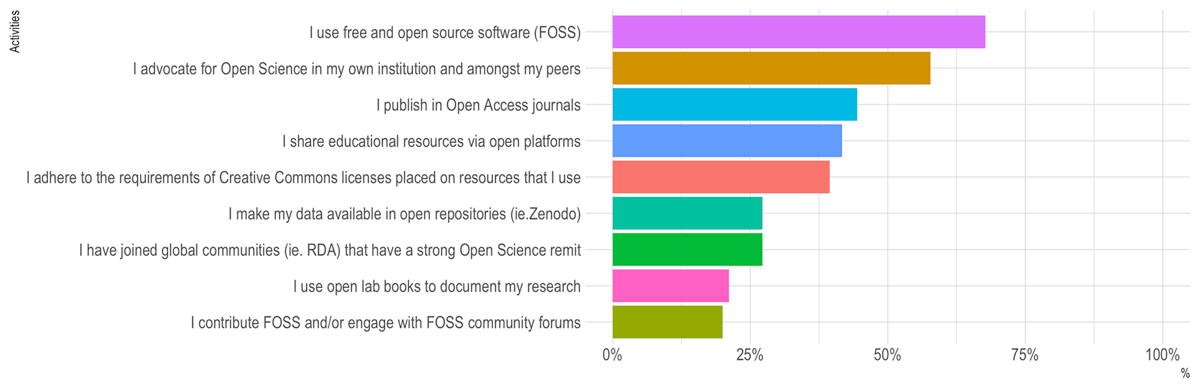
Figure 8
The range of Open Science activities in which respondents engaged after their attendance at the SRDS schools.
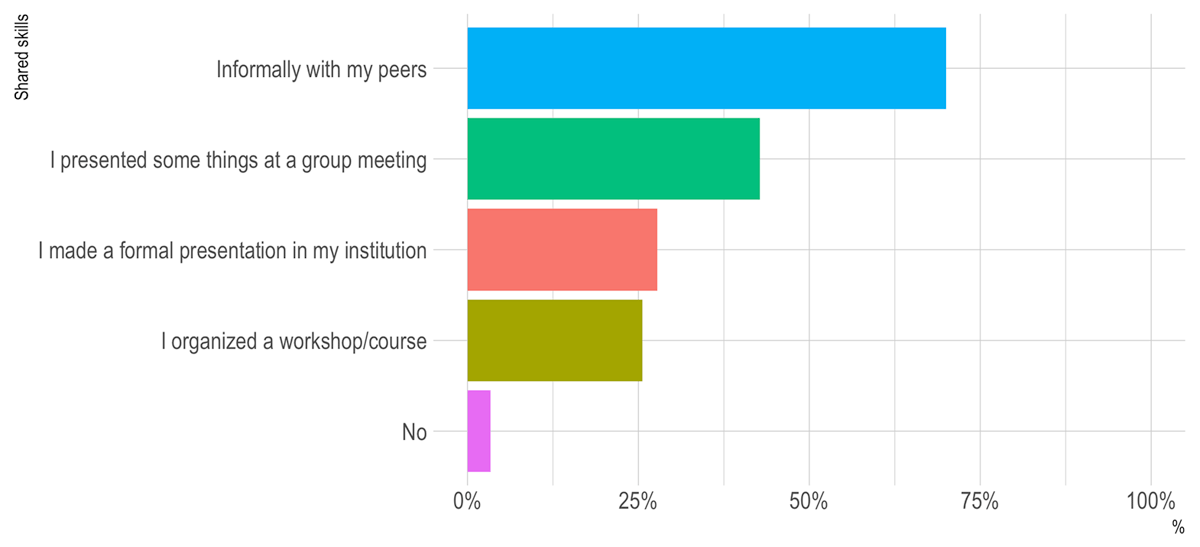
Figure 9
Level at which respondents shared skills learnt at the schools in their home institution.