
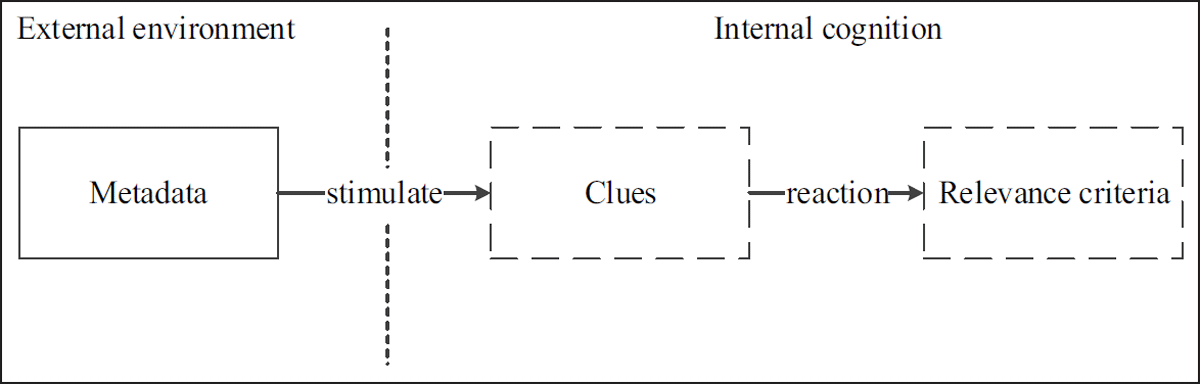
Figure 1
Concept model.
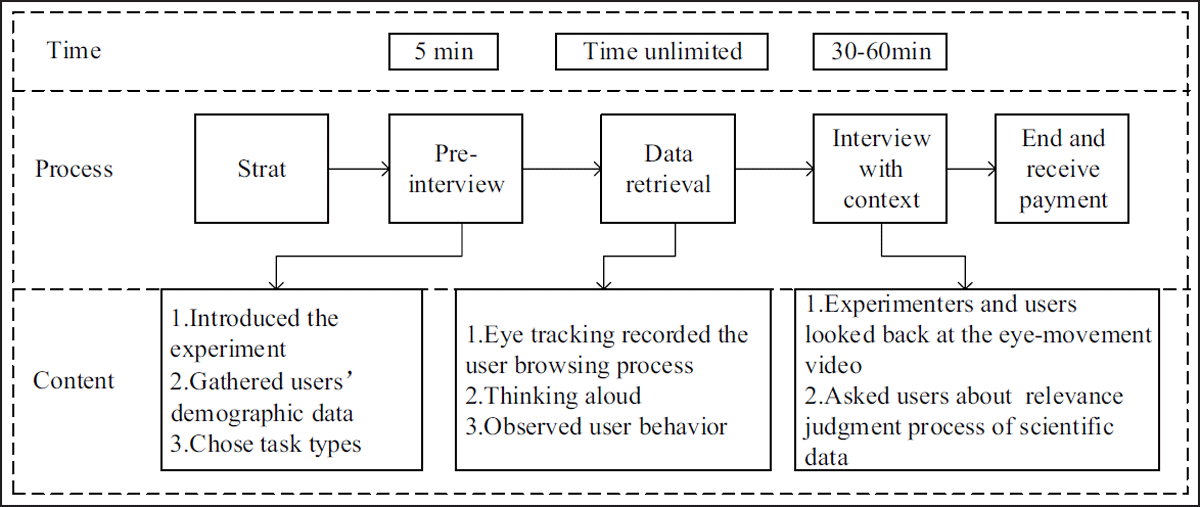
Figure 2
Contextual experiment process.
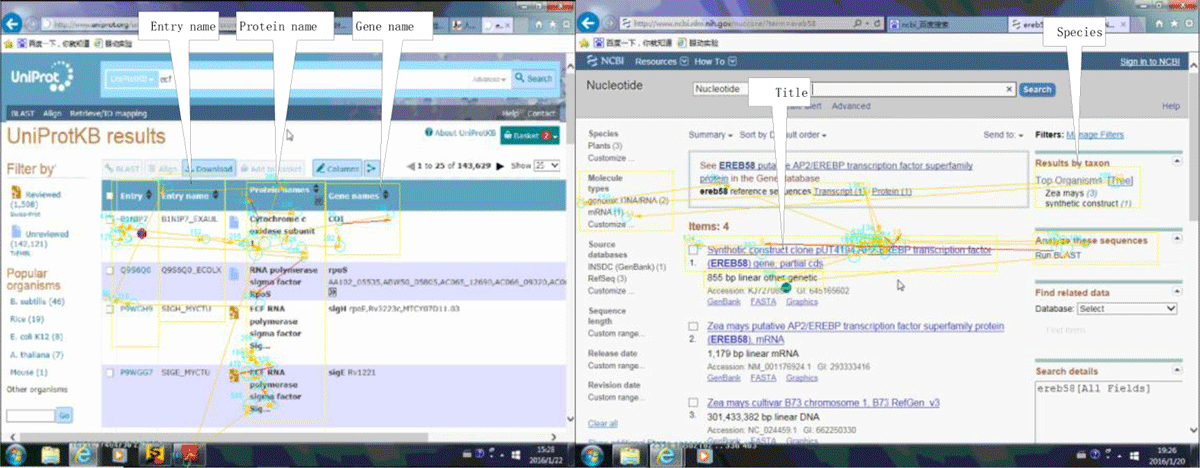
Figure 3
Division of AOIs.
Table 1
Example coding.
| INTERVIEW DATA | METADATA | CLUES | CRITERIA |
|---|---|---|---|
| This is the voltage and also the condition. We need to compare which one works better. | experimental method | more effective | |
| We want to retrieve humidity, temperature. I want these indices. | Name | match my study | topicality |
| Do not need to pay, agricultural academy Intranet can enter. | Share level Free | I can share it whether it is free | availability |
Table 2
Number of coding nodes.
| NODE | MATERIAL SOURCES | NUMBER |
|---|---|---|
| criteria | 33 | 376 |
| clues | 32 | 320 |
| data type | 22 | 31 |
| databases | 18 | 43 |
| metadata | 33 | 628 |
Table 3
Example relation code.
| METADATA | RELATIONSHIP | CLUES | RELATIONSHIP | CRITERIA | |
|---|---|---|---|---|---|
| 1 | Key word Title Name | stimulate | I’m looking for | process | Topicality |
| 2.1 | Data time | stimulate | Time span Update time | process | Topicality Currency |
| 2.2 | Cost | stimulate | Spend money to buy | process | Convenience |
Table 4
Example of partial cross analysis.
| METADATA | CROSSOVER NODES | CLUES | DATA TIME | AUTHOR | PUBLISH TIME |
|---|---|---|---|---|---|
| time dimension | 7 | ||||
| time is new | 1 | 4 | |||
| time is too old | 3 | 2 | |||
| time span | 7 | ||||
| continuous data | 4 | ||||
| difficult to obtain | 1 | ||||
| research content is similar | 1 | ||||
| Skepticism | 1 | ||||
| better known | 2 | ||||
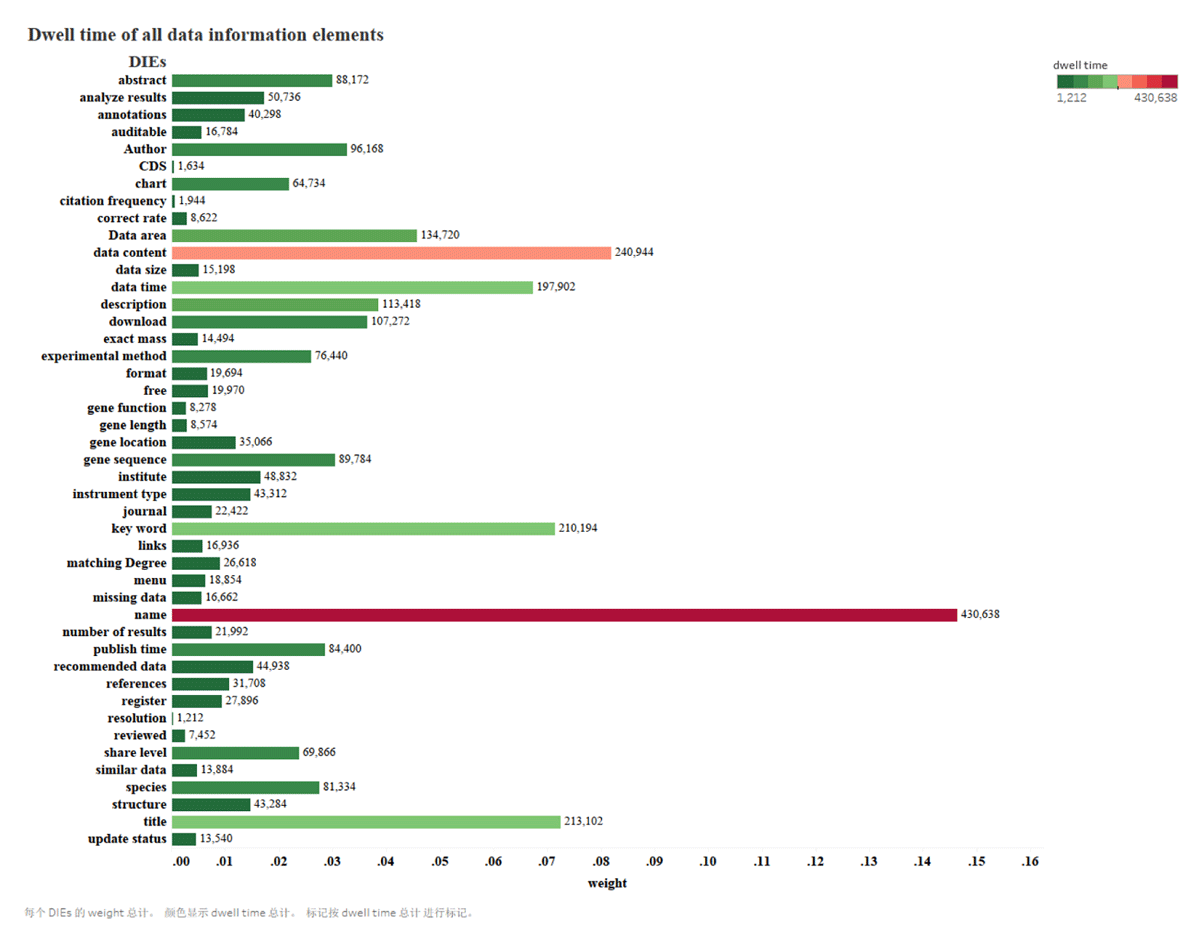
Figure 4
Dwell time for each type of metadata.
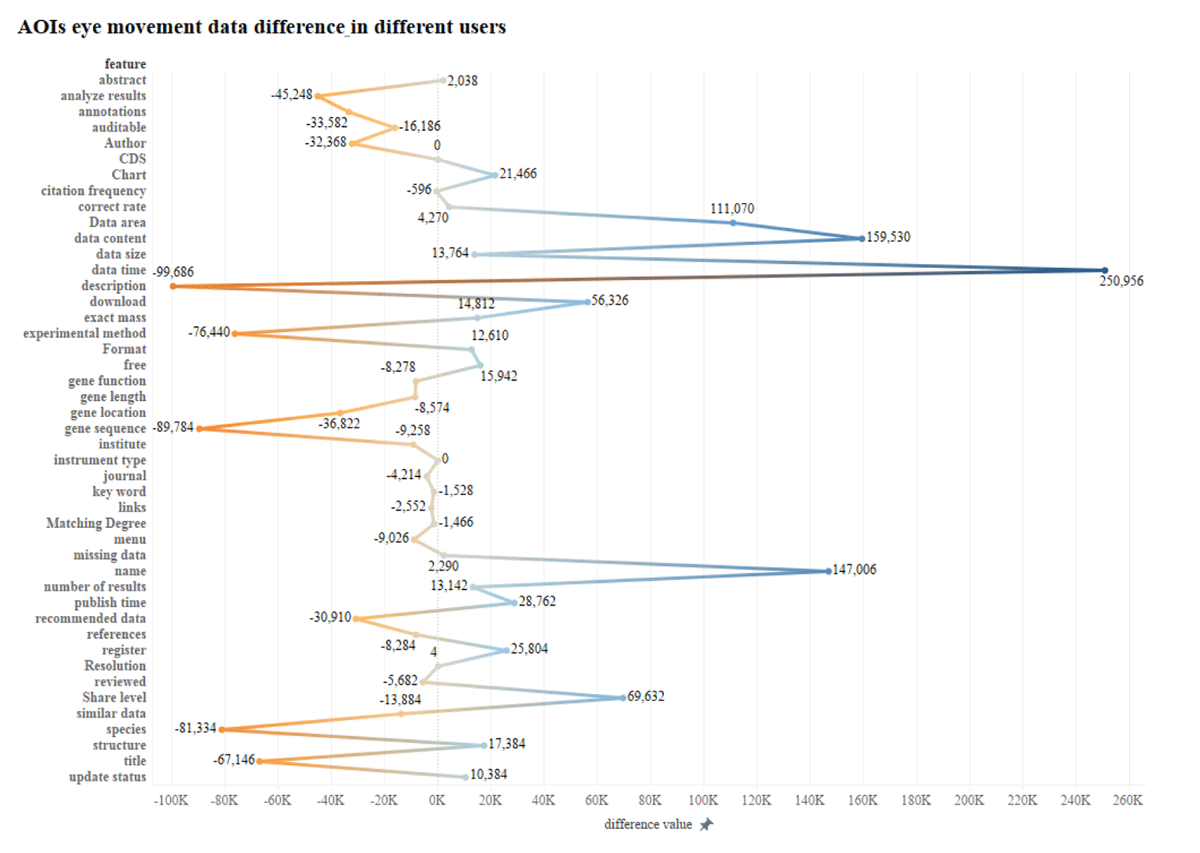
Figure 5
Differences in AOI data for the two groups.
Table 5
Criteria definitions.
| CRITERIA | |
|---|---|
| Topicality | The data is consistent with the user’s research, such as data related in terms of content, time, and region. |
| Availability | The user can obtain the data without any external factors (i.e. no access permission, no download links, high prices, etc.). |
| Quality | The quality of data, for example, whether the data is accurate, correct, and valid. |
| Standardization | The data classification system and collection process are consistent with national requirements. |
| Authority | Users can trust this data, mainly referring to a person or an organization that publishes influential data. |
| Comprehensiveness | The data has full coverage, or the data is complete without missing any elements. |
| Convenience | It is convenient to retrieve, obtain, and use the data. |
| Usability | The data can be used without cognitive limitations or formatting problems. |
| Currency | The data is valuable to the research and valid for only a certain period of time, such as the publication date is recent, or not outdated. |
Table 6
Percentages of relevance criteria nodes.
| RELEVANCE CRITERIA | NODES | PERCENTAGE |
|---|---|---|
| Topicality | 168 | 44.80% |
| Availability | 45 | 12.00% |
| Quality | 42 | 11.20% |
| Completeness | 32 | 8.53% |
| Authority | 29 | 7.73% |
| Currency | 20 | 5.33% |
| Convenience | 16 | 4.27% |
| Usability | 15 | 4.00% |
| Standardization | 8 | 2.13% |
| Total | 375 | 100.00% |
Table 7
Comparison of document and scientific data relevance criteria.
| DOCUMENT RELEVANCE CRITERIA | SCIENTIFIC DATA RELEVANCE CRITERIA | ||
|---|---|---|---|
| Topicality | 65.30% | Topicality | 44.80% |
| Quanlity | 9.40% | Availability | 12.00% |
| Scope | 9.40% | Quality | 11.20% |
| Novelty | 5.30% | Completeness | 8.53% |
| Currency | 2.80% | Authority | 7.73% |
| Discipline | 2.70% | Currency | 5.33% |
| Source | 1.70% | Convenience | 4.27% |
| Authority | 1.10% | Usability | 4.00% |
| Special need | 1.00% | Standardization | 2.13% |
| Time cost | 0.80% | ||
| Availability | 0.20% | ||
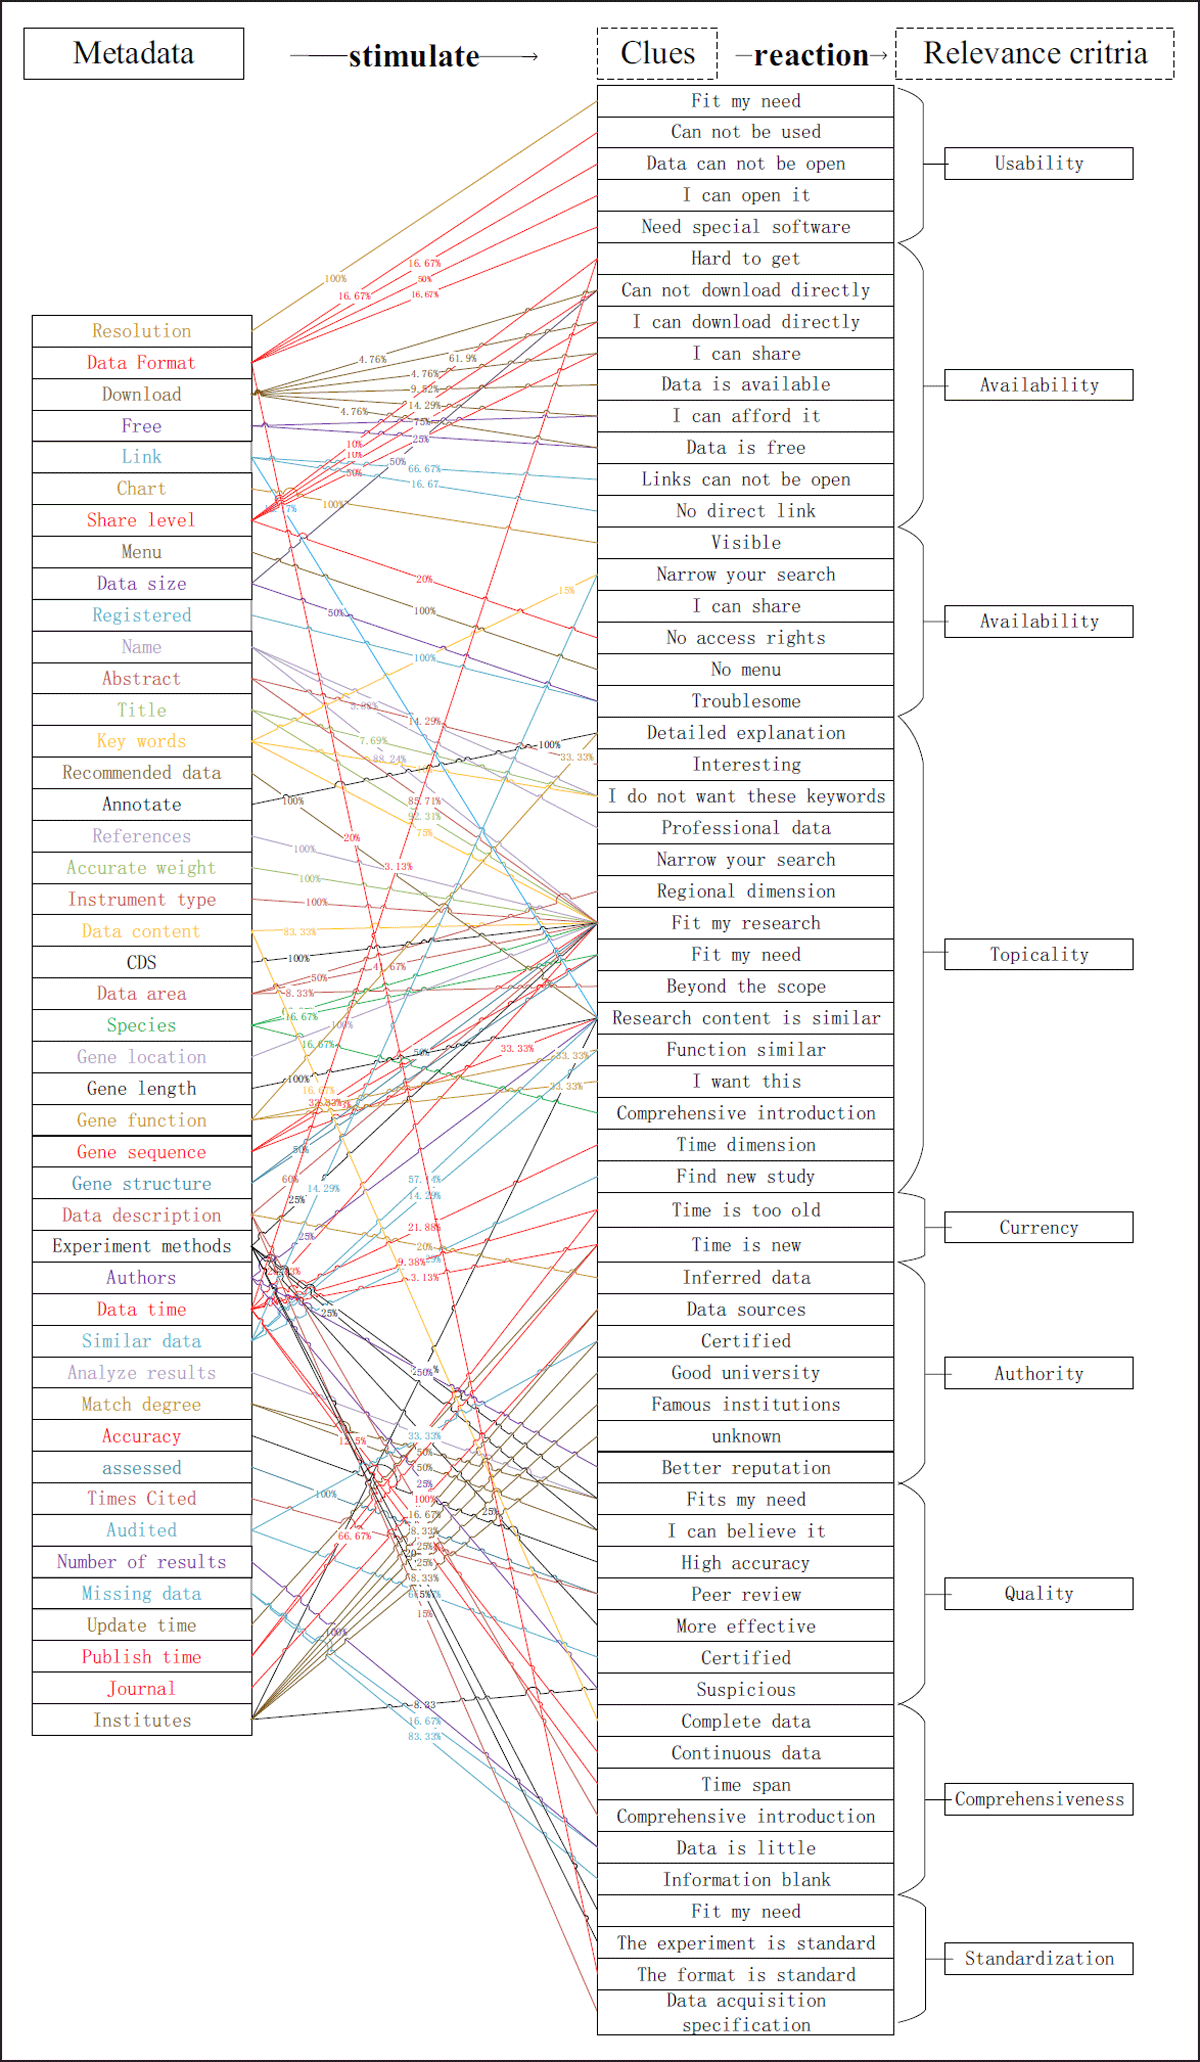
Figure 6
Relationships among metadata, clues, and relevance criteria.
Table 8
Percentage of criteria frequencies and dwell times.
| CRITERIA | NODE NUMBER | PERCENTAGE | CRITERIA | DWELL TIME | PERCENTAGE |
|---|---|---|---|---|---|
| topicality | 168 | 44.80% | topicality | 1932354 | 65.70% |
| availability | 45 | 12.00% | availability | 176395 | 6.00% |
| quality | 42 | 11.20% | quality | 173161 | 5.89% |
| completeness | 32 | 8.53% | convenience | 170221 | 5.79% |
| authority | 29 | 7.73% | completeness | 169633 | 5.77% |
| currency | 20 | 5.33% | authority | 139940 | 4.76% |
| convenience | 16 | 4.27% | currency | 122595 | 4.17% |
| usability | 15 | 4.00% | standardization | 40100 | 1.36% |
| standardization | 8 | 2.13% | usability | 16933 | 0.58% |
| total | 375 | 100.00% | total | 2941332 | 100.00% |
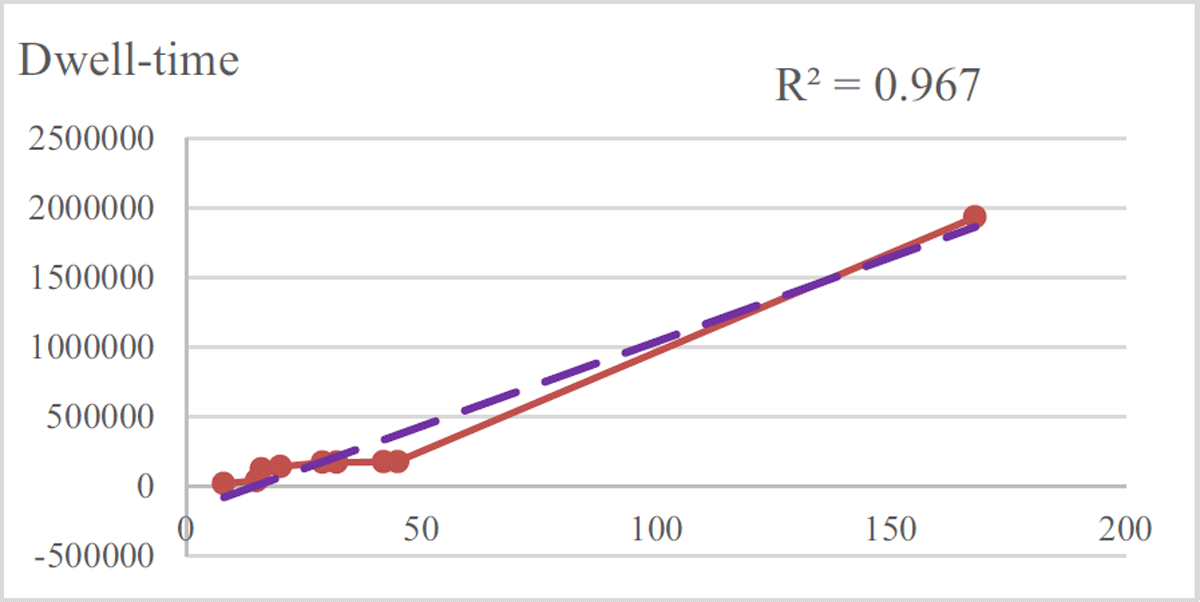
Figure 7
Regression analysis of two groups data.
| criteria | no direct link | unipront |
| authority | no key word | metadata |
| availability | no limited | abstract |
| completeness | no menu | analyze results |
| convenience | no sense | annotations |
| currency | Out of place | auditable |
| standardability | pre-processing | Author |
| quality | professional | CDS |
| topicality | publication is good | Chart |
| usability | reduce the scope | citation frequency |
| clues | Regional dimension | cloudage |
| be discovered | area dimension | correct rate |
| better known | Related to protein information | Data area |
| cannont be used | Research content is similar | data content |
| cannot download directly | skepticism | data size |
| cannot open | someone recommend me data | data time |
| certificated | special software | description |
| complete data | technological improvement | download |
| comprehensive introduction | the discription of title | exact mass |
| continuous data | time dimension | experimental method |
| correct rate is high or low | time is new | Format |
| data be identified | time is too old | free |
| data is little | time span | gene function |
| data sources | Time to close | gene length |
| data was affected | track the study | gene location |
| depth | very troublesome | gene sequence |
| detailed explanation | visual | institute |
| difficult to obtain | whether I can afford | instrument type |
| every body use it | whether I can believe | journal |
| fit my needs | whether it is free | key word |
| functional similarity | Whether it’s available or not | links |
| good university | data type | Matching Degree |
| guessed data | chromatogram map | menu |
| haven’t checked | composition of feed | missing data |
| human review | gene | name |
| I can download | gene physical map | number of results |
| I can open it | geography | publish time |
| I can share it | meteorological data | recommended data |
| I want this | statistics | references |
| information blank | databases | register |
| interest | ABC | Resolution |
| larger organization | China meteorological science data sharing service network. | reviewed |
| little-known | CNKI | Share level |
| long time to check | FAO | similar data |
| match my study | GS Cloud | species |
| whether it matches | National Statistics Bureau | structure |
| more effective | NCBI | title |
| no cloud | soybean databases | update status |