
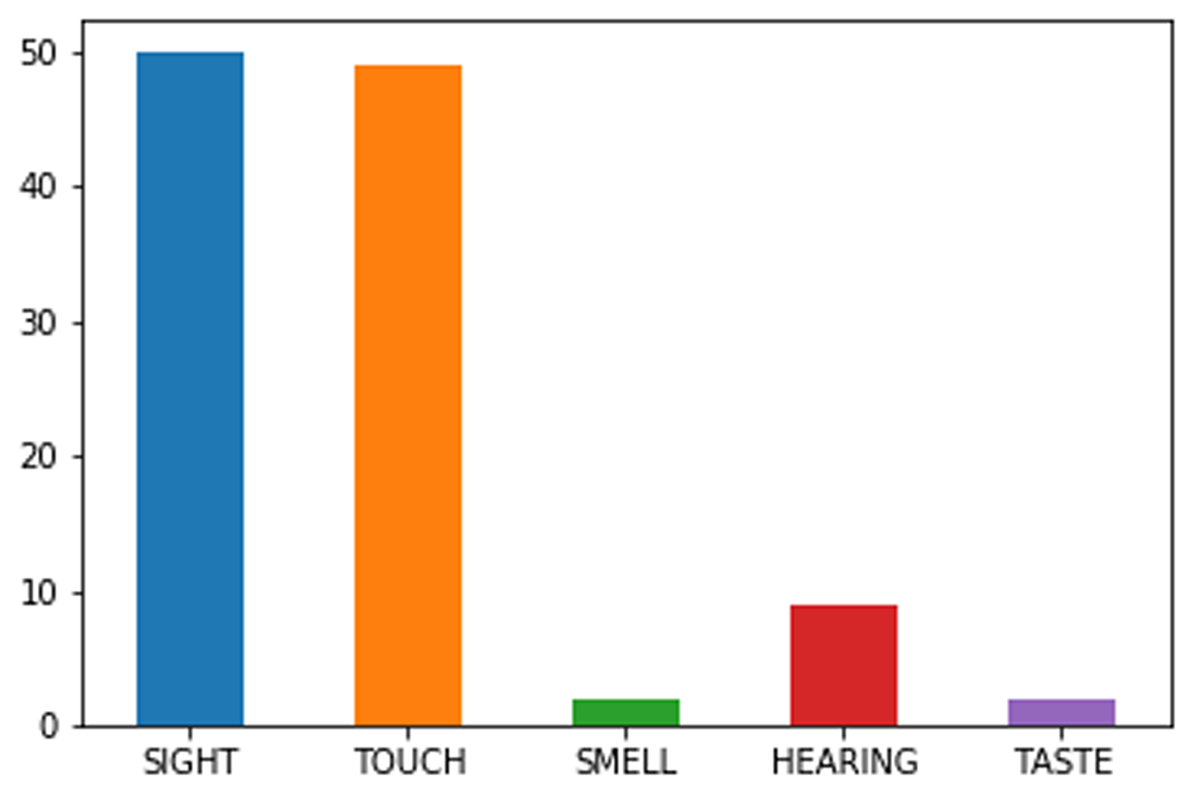
Figure 1
Frequencies of senses usage in the 51 DP papers analysed.
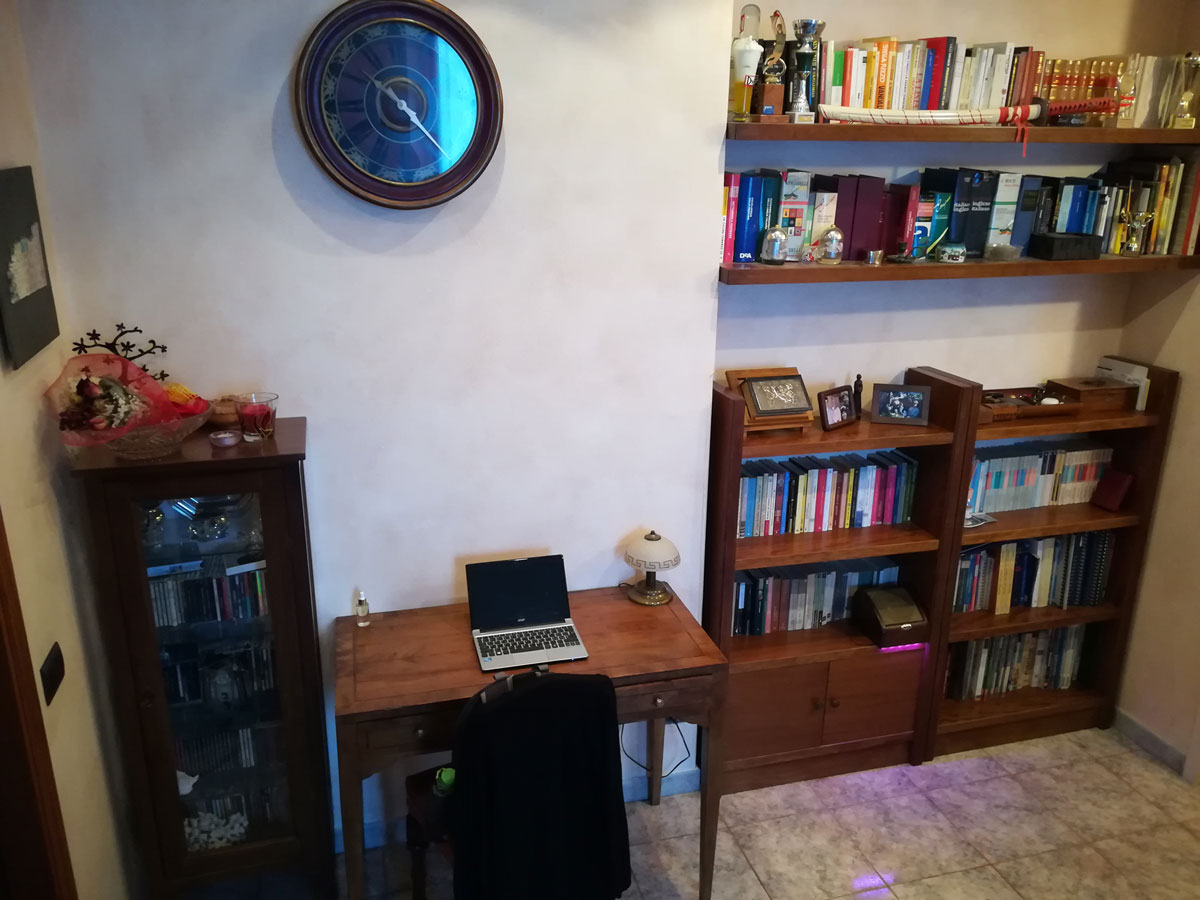
Figure 2
Can you spot the device? (hint: LEDs).
Table 1
The mapping table. L# is the listening order used during the field tests. (*) relative humidity ≥ 85%.
| L# | Mood | Genres | Weather | Colour |
|---|---|---|---|---|
| 1 | Annoyed, frustated, irritated | Classical | Smoke, haze, sand (annoying and polluted weather) | Magenta |
| 2 | Angry, aggressive | Metal | Clear and high humidity (*) | Red |
| 3 | Sleepy, bored, tired | Smooth jazz | Rain, clouds, fog, mist, drizzle | Blue violet |
| 4 | Happy (feeling good, delighted…) | Summer hits (mix of sun and popular music) | Clear | Yellow |
| 5 | Fear | Heavy/extreme metal | Thunderstorm, tornado, squall, ash, dust (dangerous weather) | Dark green |
| 6 | Sad, depressedv | lo fi | Rain, clouds, fog, mist, drizzle and high humidity (*) | Dark blue |
| 7 | Xmas is coming | Christmas songs | Snow | White |
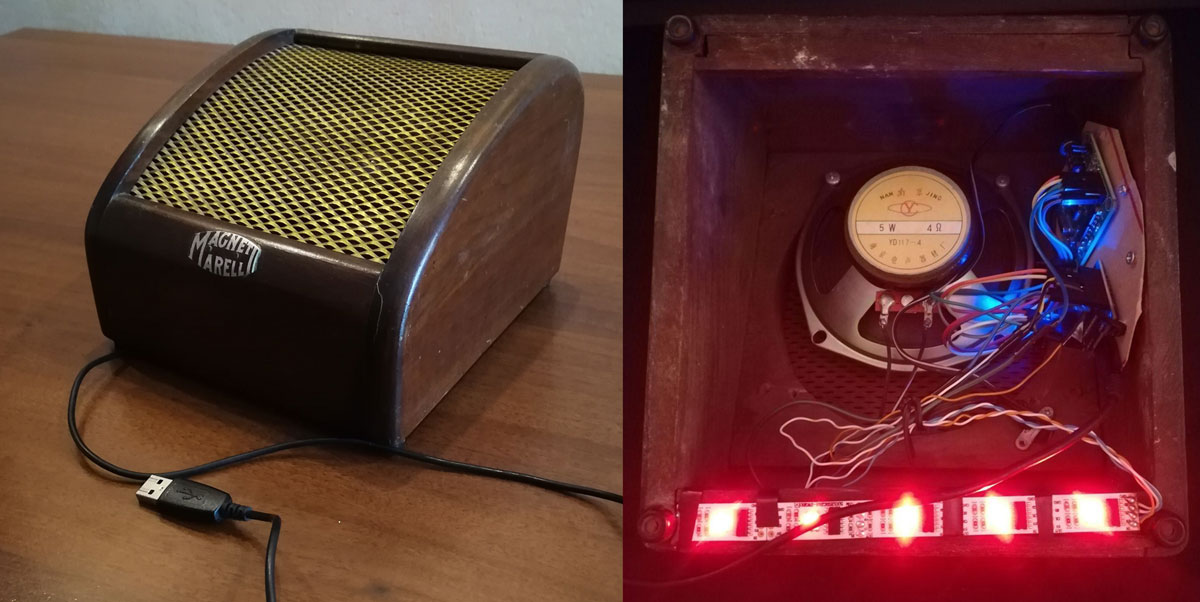
Figure 3
The Physiradio prototype: outside and inside.
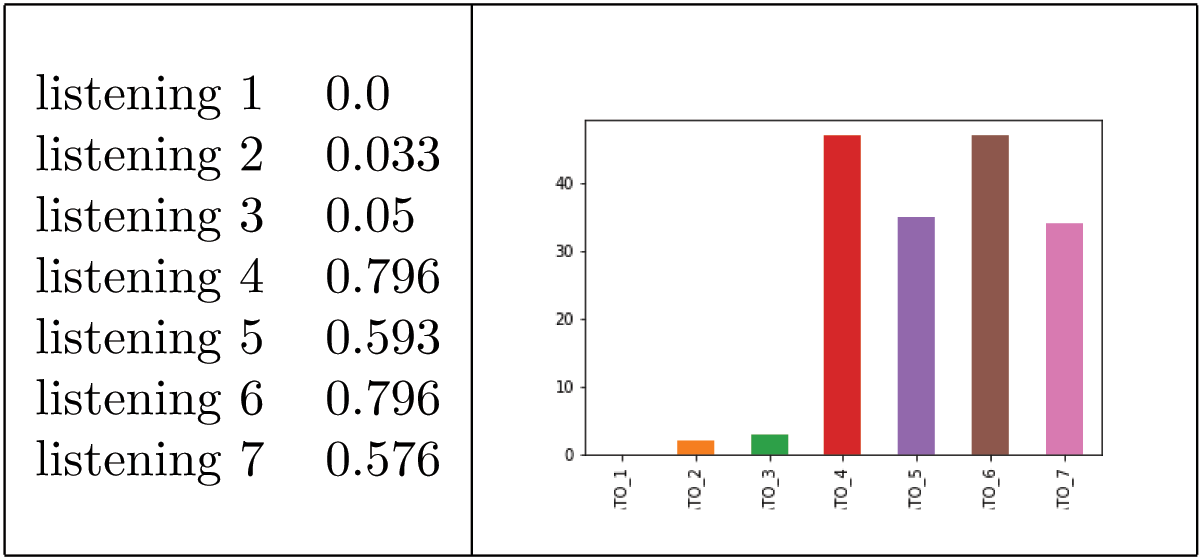
Figure 4
Relative matches per listening. The left box shows the listening order during the field tests and the relative matching rates, namely when the user guessed the right mapping, plotted on the right box. Number of subjects: 58.