
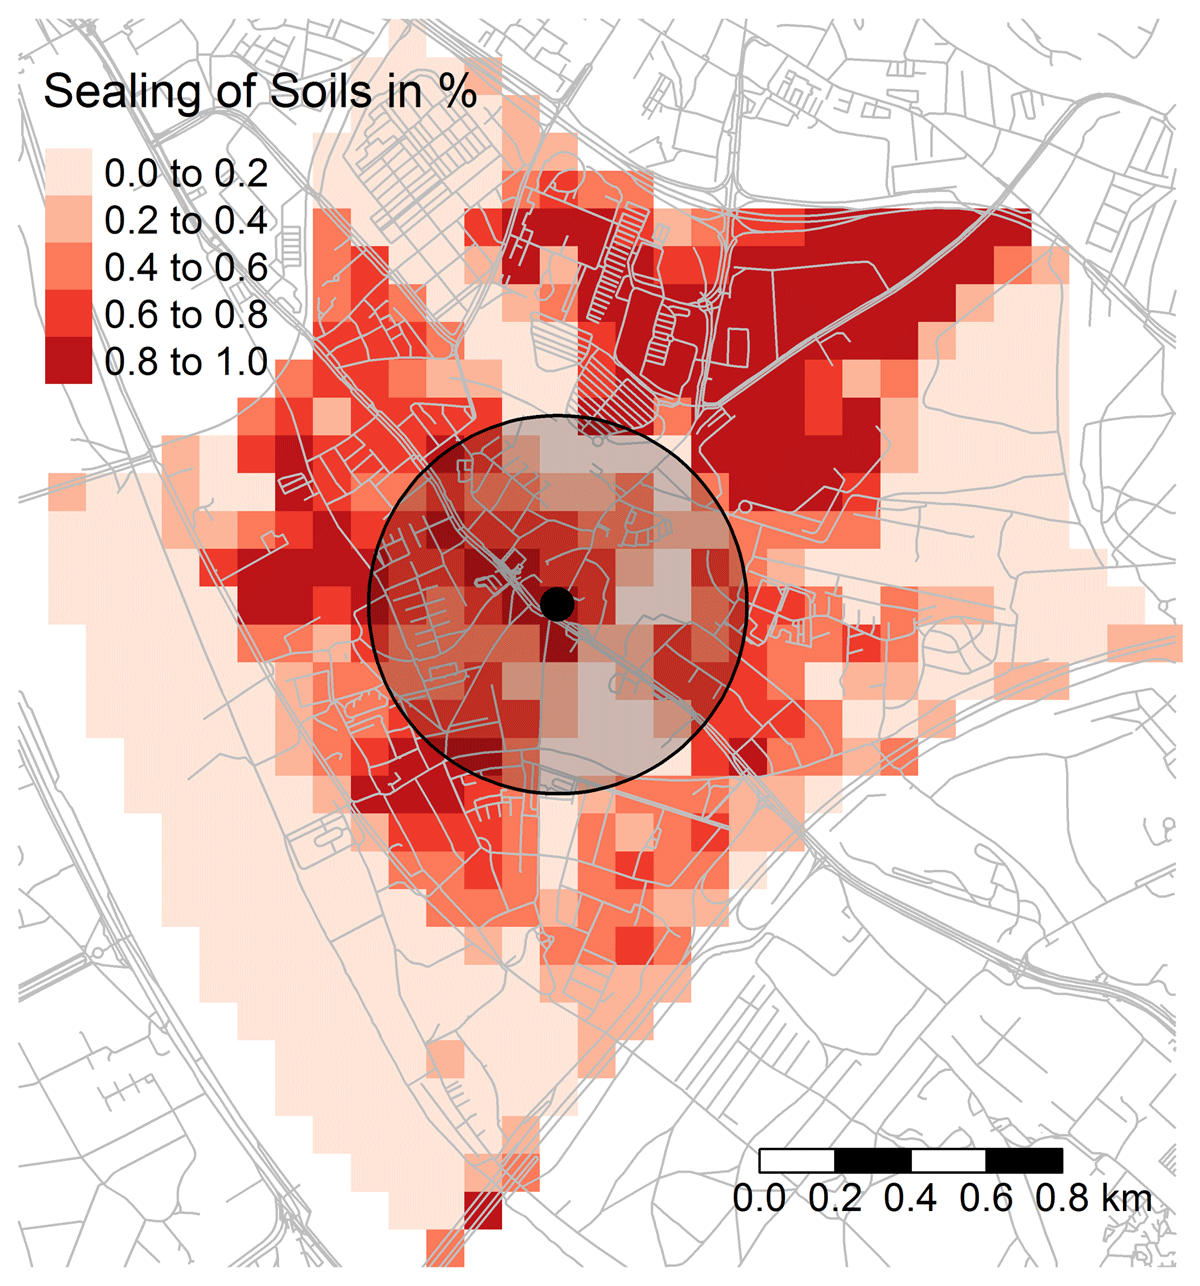
Figure 1
Circular Buffer Areas of Sealing of Soils in the Size of 500m Around a Coordinate.
Data Source: Monitor of Settlement and Open Space Development (IOER, 2017) (Sealing of Soils) and OpenStreetMap (Roads).
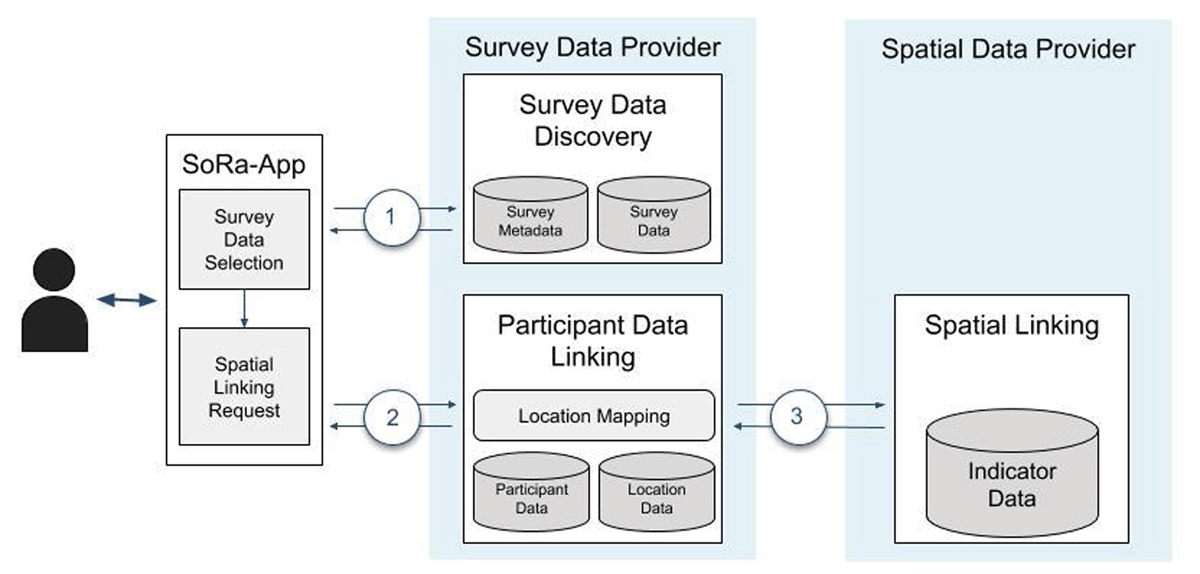
Figure 2
Architecture of the SoRa-Infrastructure.
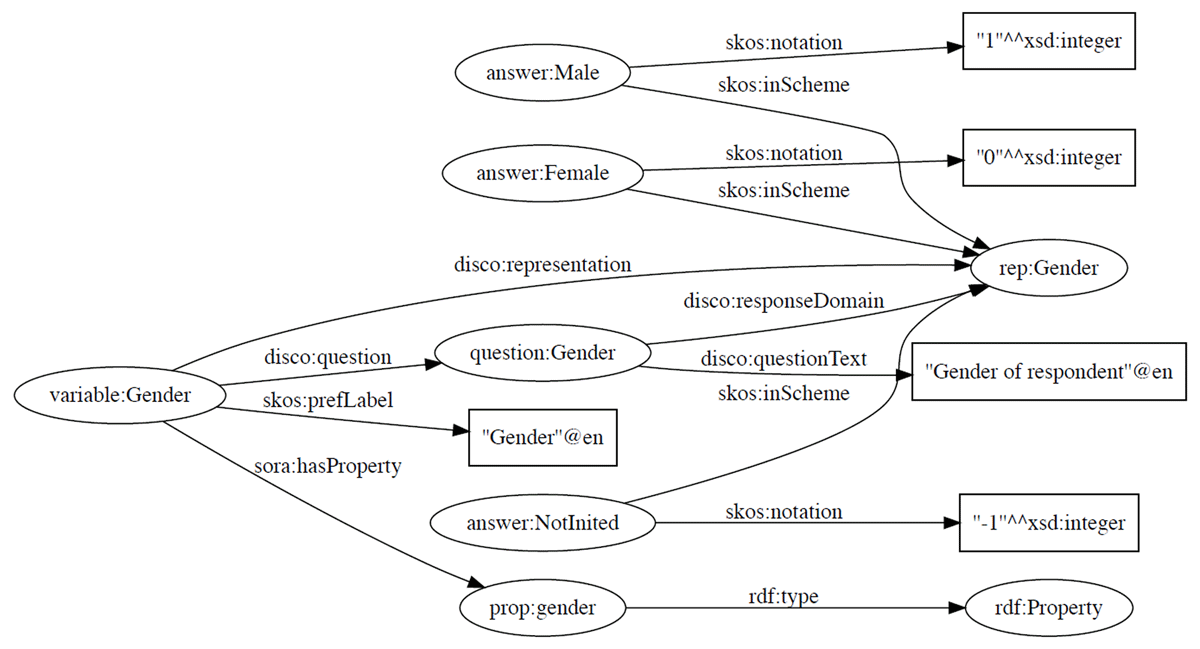
Figure 3
An Example on the Metadata of a Variable.
Table 1
Income Ranges.
| Class | 1 | 2 | 3 | 4 | 5 | 6 | 7 | 8 | 9 | 10 | 11 | 12 | 13 | 14 | 15 | 16 | 17 |
|---|---|---|---|---|---|---|---|---|---|---|---|---|---|---|---|---|---|
| Income range | 0–299 | 300–499 | 500–699 | 700–899 | 900–1099 | 1100–1299 | 1300–1499 | 1500–1699 | 1700–1999 | 2000–2299 | 2300–2599 | 2600–3199 | 3200–3999 | 4000–4999 | 5000–5999 | 6000–9999 | ≥10000 |
Table 2
Descriptive Statistics of all Variables Used in the Analysis.
| GESIS Panel | SOEP | |||||||
|---|---|---|---|---|---|---|---|---|
| Mean | SD | Minimum | Maximum | Mean | SD | Minimum | Maximum | |
| Survey Measures | ||||||||
| Age | 46.69 | 13.37 | 18.00 | 73.00 | 48.96 | 16.74 | 18.00 | 100.00 |
| Gender | 0.52 | 0.50 | 0.00 | 1.00 | 0.54 | 0.50 | 0.00 | 1.00 |
| Education | 2.21 | 0.77 | 1.00 | 3.00 | 1.90 | 0.76 | 1.00 | 3.00 |
| Income | 11.71 | 2.83 | 1.00 | 17.00 | 11.16 | 3.15 | 1.00 | 17.00 |
| Geospatial Measures | ||||||||
| Sealing of Soils 100 m | 0.47 | 0.24 | * | * | 0.51 | 0.24 | * | * |
| Sealing of Soils 500 m | 0.32 | 0.20 | * | * | 0.36 | 0.20 | * | * |
| Sealing of Soils 1000 m | 0.25 | 0.18 | * | * | 0.29 | 0.19 | * | * |
| Sealing of Soils 2000 m | 0.19 | 0.16 | * | * | 0.22 | 0.17 | * | * |
| Traffic Density 100 m | 15.67 | 7.53 | * | * | 15.86 | 7.33 | * | * |
| Traffic Density 500 m | 10.20 | 3.60 | * | * | 10.77 | 3.61 | * | * |
| Traffic Density 1000 m | 08.09 | 3.21 | * | * | 8.69 | 3.25 | * | * |
| Traffic Density 2000 m | 6.45 | 2.77 | * | * | 6.93 | 2.86 | * | * |
| Industry and Trade Density 100 m | 02.04 | 9.59 | * | * | 1.86 | 9.11 | * | * |
| Industry and Trade Density 500 m | 4.84 | 7.73 | * | * | 5.10 | 7.47 | * | * |
| Industry and Trade Density 1000 m | 5.33 | 6.22 | * | * | 06.05 | 6.72 | * | * |
| Industry and Trade Density 2000 m | 5.16 | 4.93 | * | * | 06.09 | 5.51 | * | * |
| Number of Observations | 2598 | 24136 | ||||||
[i] Data Source: Georeferenced GESIS Panel (GESIS, 2017) and Georeferenced Socio-economic Panel (Schupp et al., 2018).
* Minimum and maximum values deleted due to data protection.
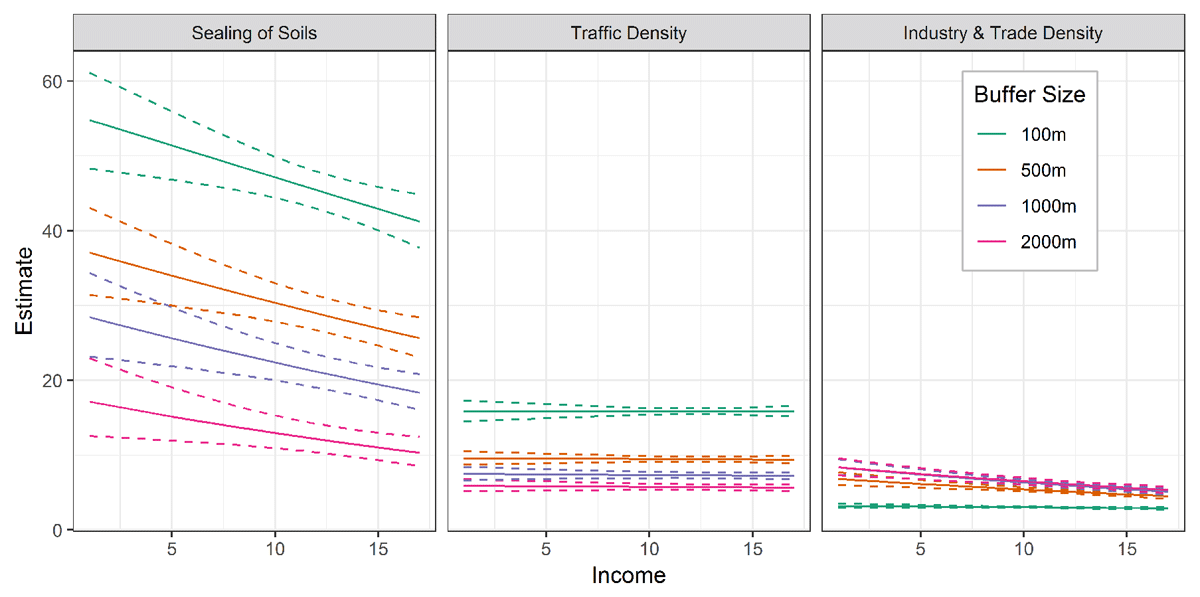
Figure 4
Results of the Linear Predictions as a Function of Income and the Three Land Use Indicators Across Different Geographic Scales for the GESIS Panel (N = 2598).
Data Source: Georefererenced GESIS Panel and Monitor of Settlement and Open Space Development.
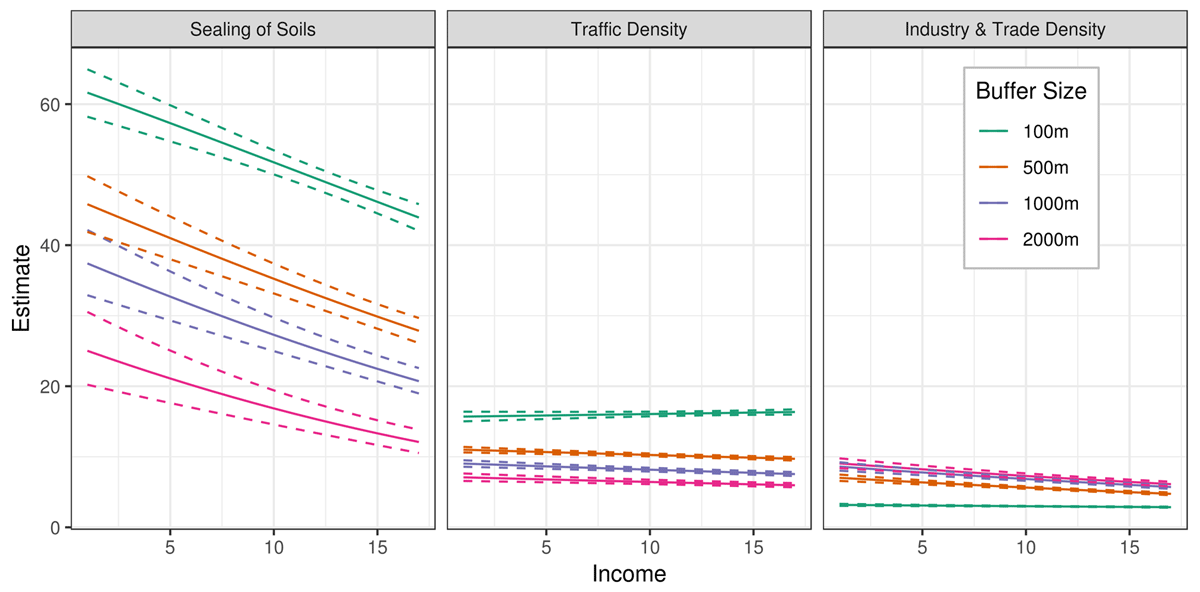
Figure 5
Results of the Linear Predictions as a Function of Income and the Three Land Use Indicators Across Different Geographic Scales for the SOEP (N =24136).
Data Source: Georefererenced Socio-economic Panel (doi:10.5684/soep.v33.1) and Monitor of Settlement and Open Space Development.