
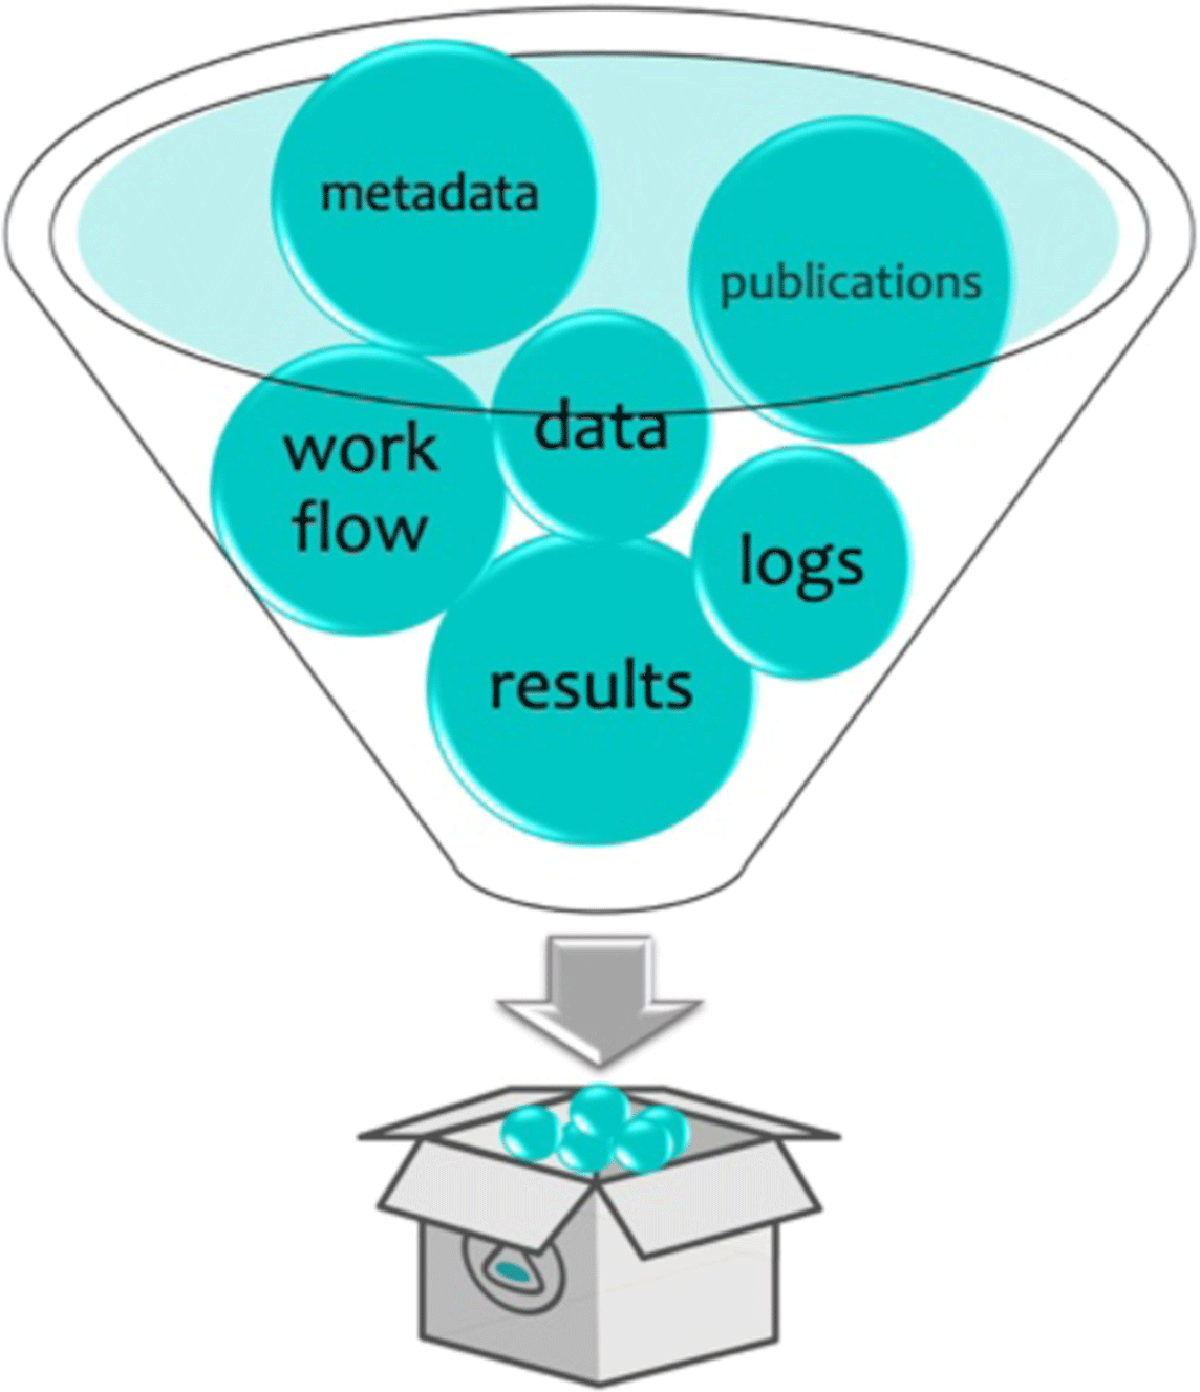
Figure 1
Research Object schematic representation.
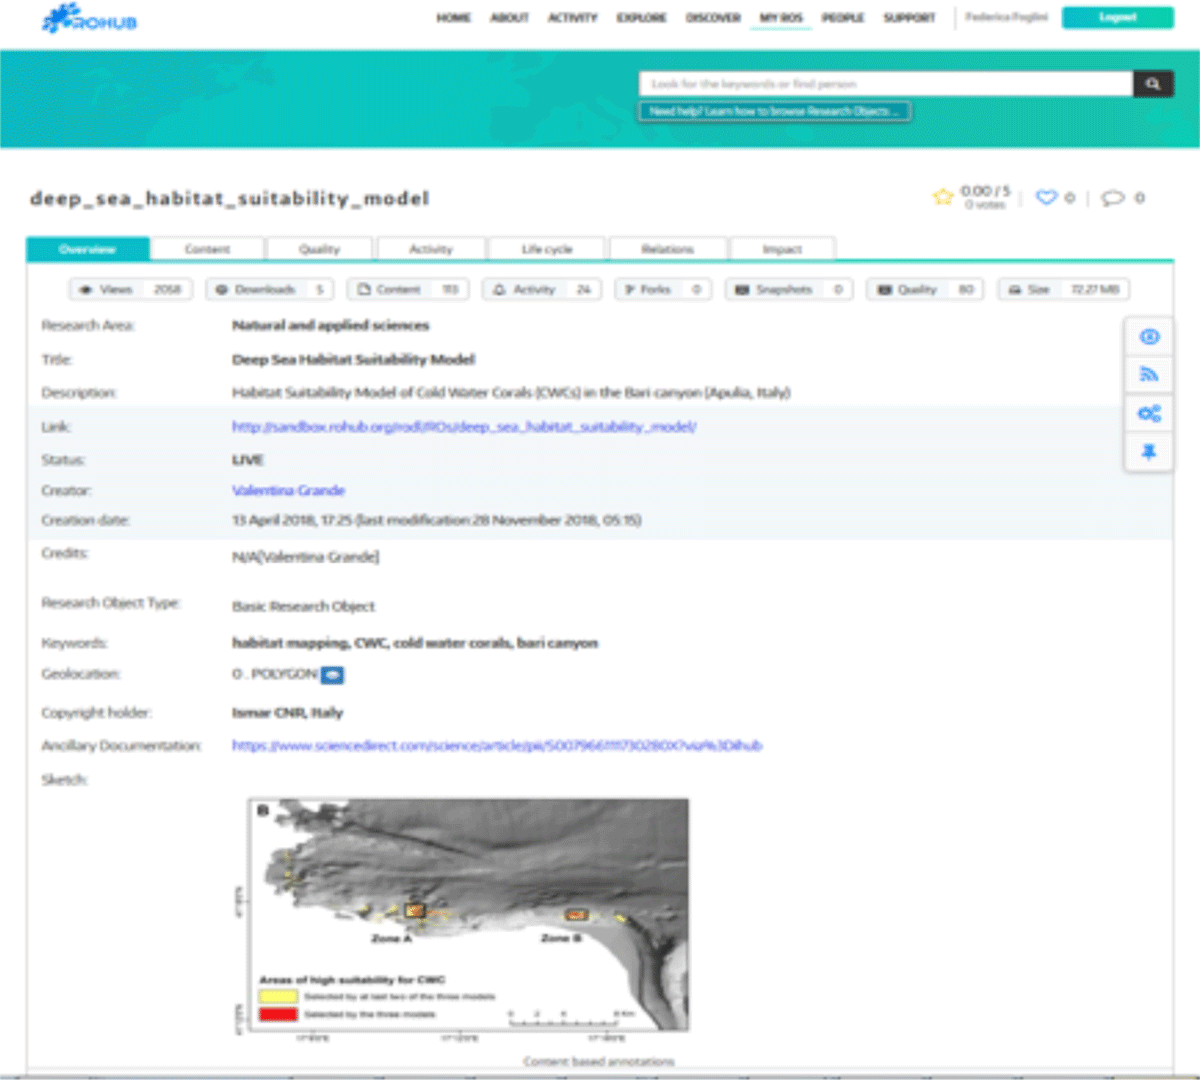
Figure 2
Example of a RO, visible troughs the ROHUB platform, encapsulating the deep Sea Habitat suitability model workflow, data, results and papers.
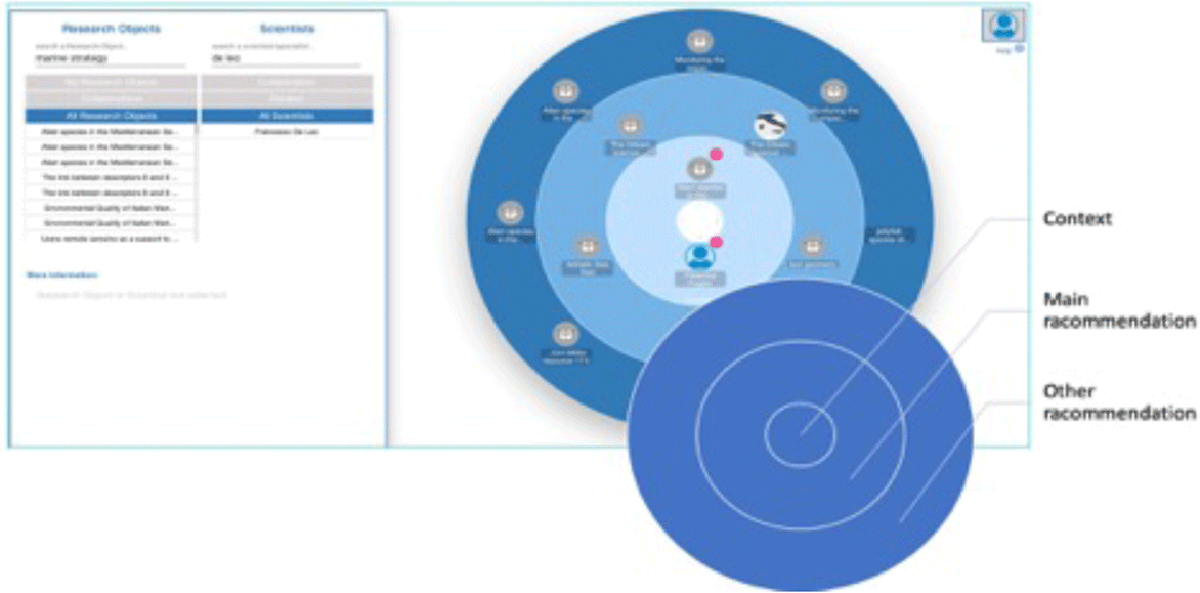
Figure 3
Collaboration Sphere.
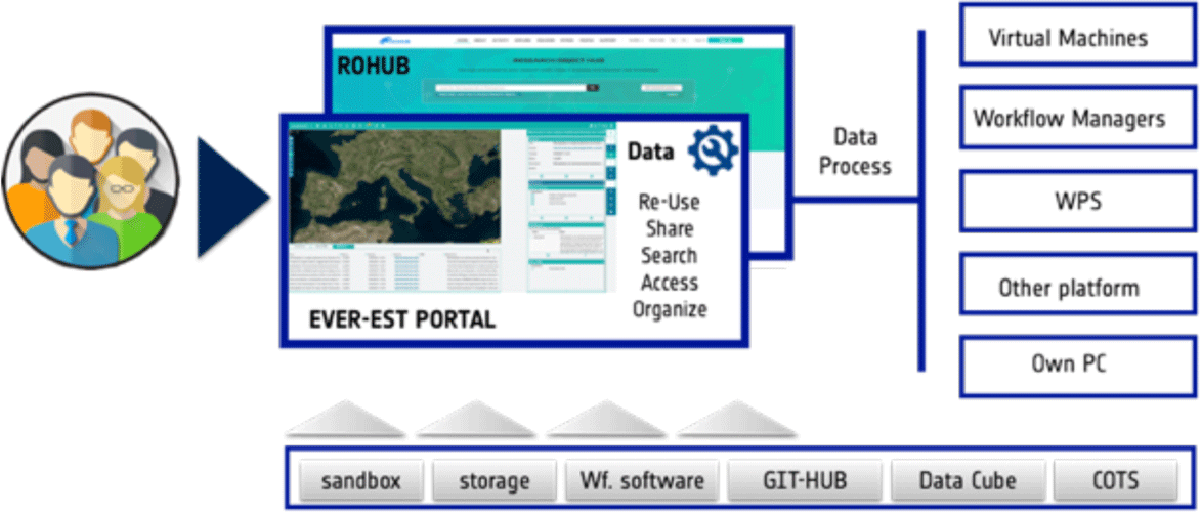
Figure 4
EVER-EST overall logic.
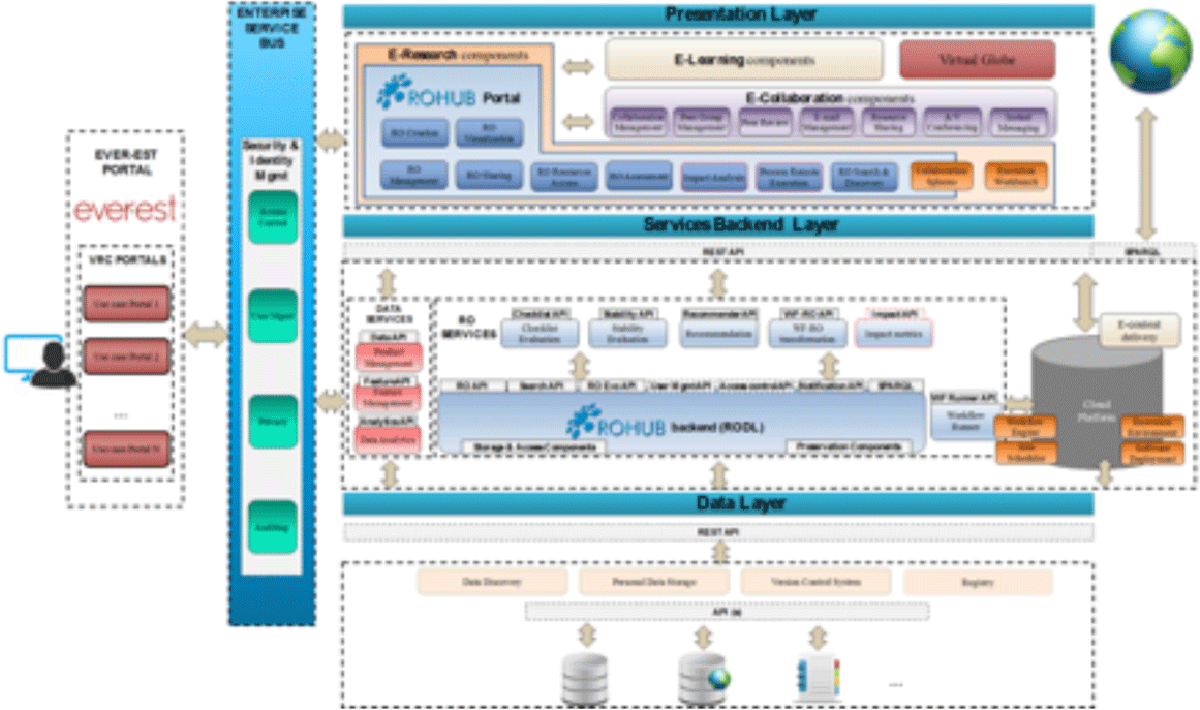
Figure 5
EVER-EST overall architecture.
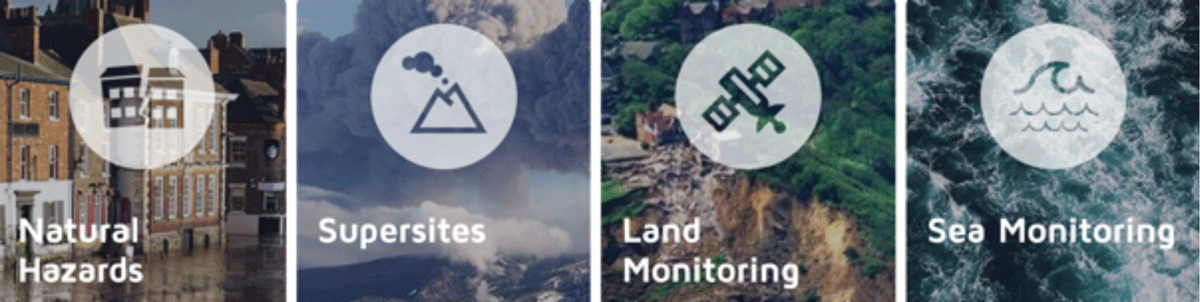
Figure 6
The EVER-EST VRCs.
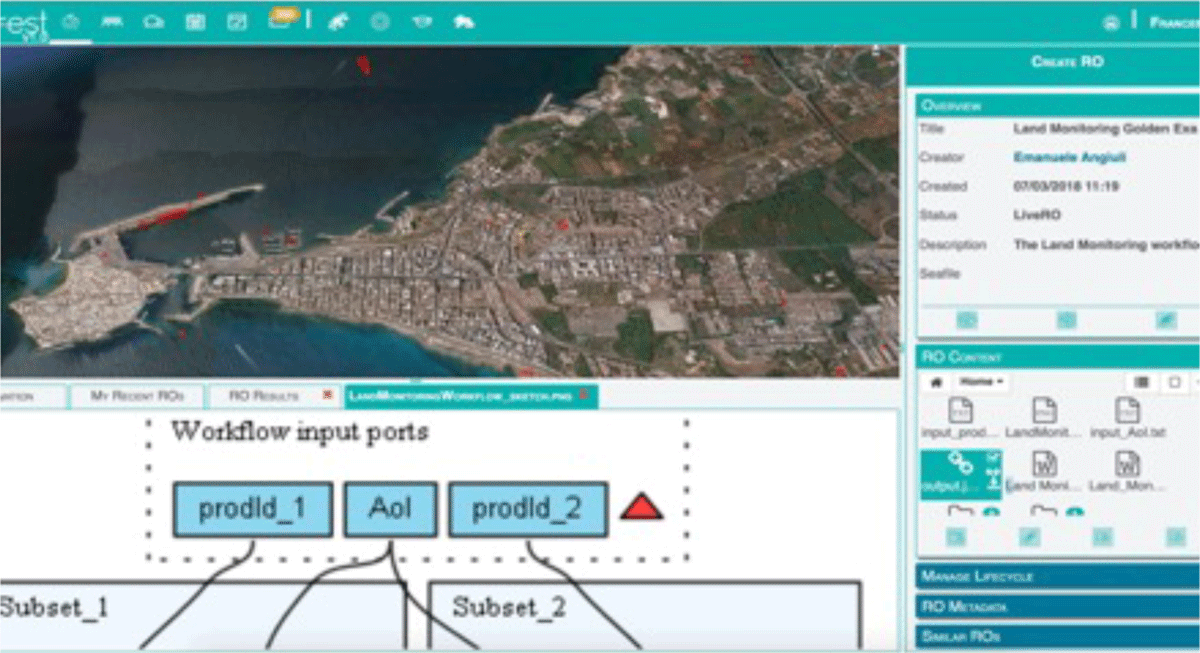
Figure 7
Land monitoring user interface showing a Detection Map.
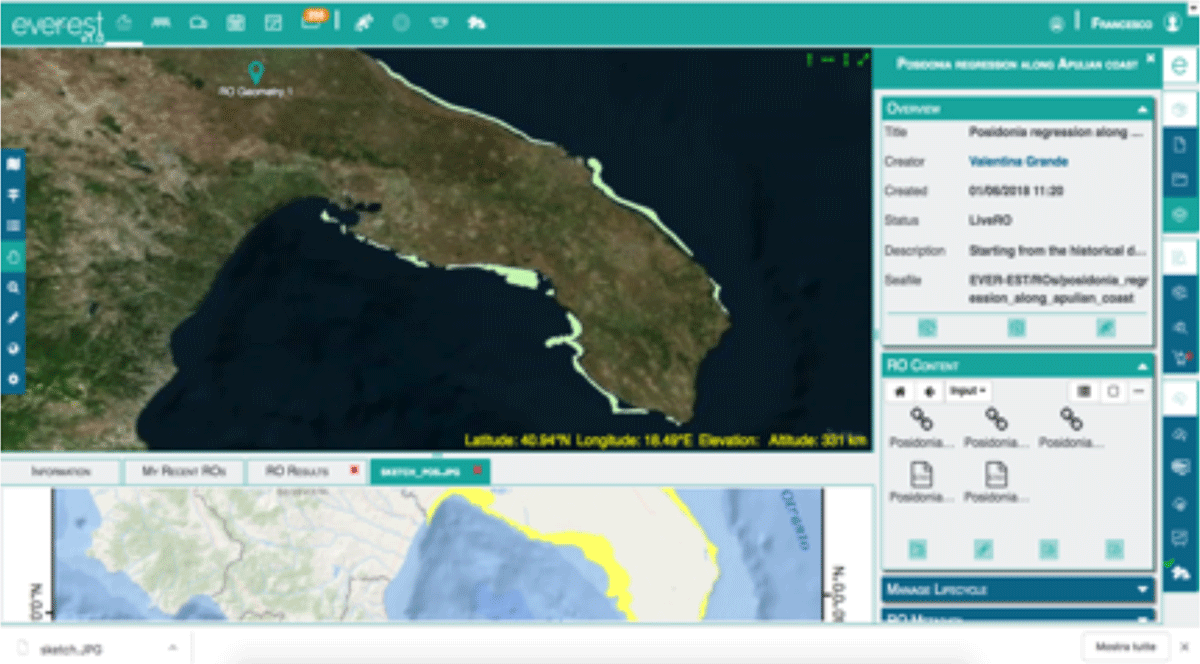
Figure 8
Sea monitoring user interface showing the Posidonia regression along Apulian coast.
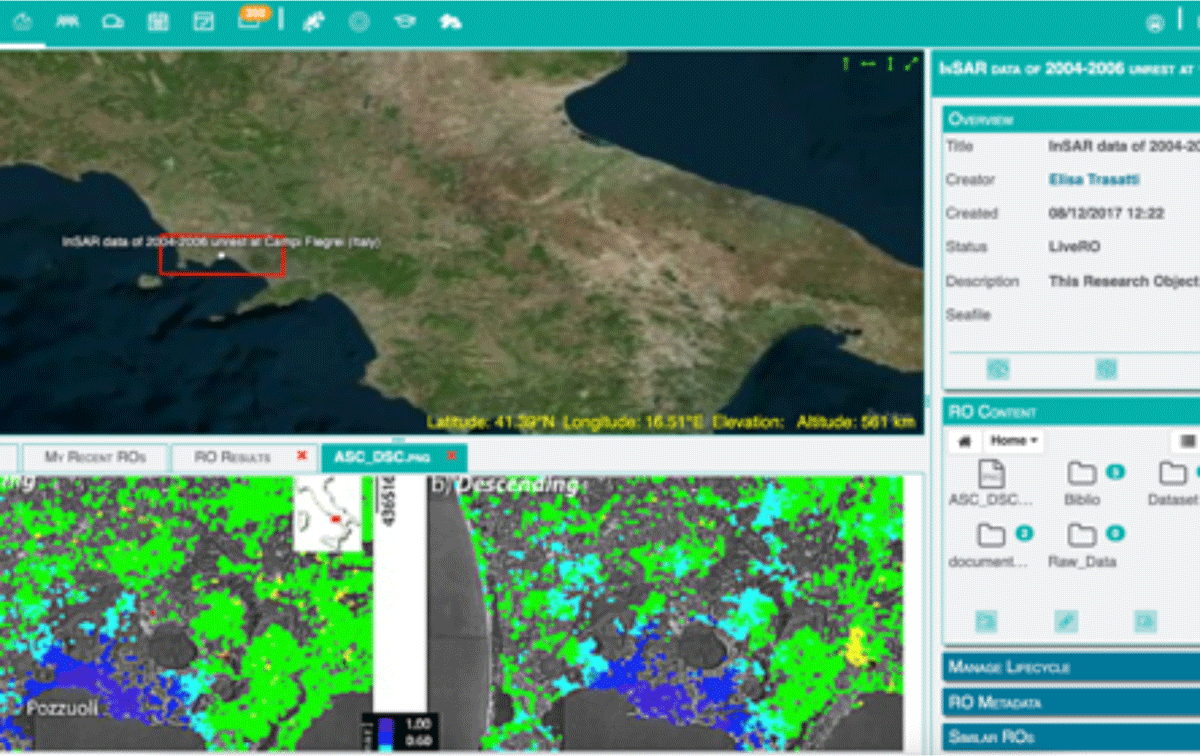
Figure 9
Visualisation in the VRE of a RO containing executable resources.
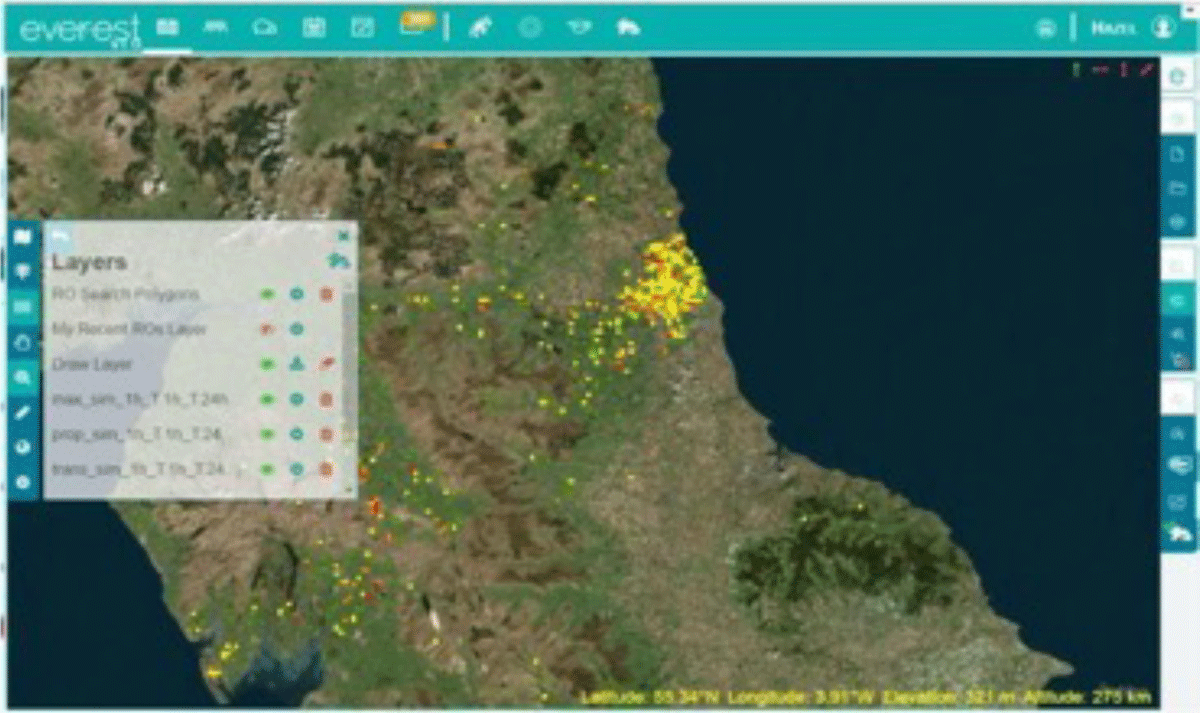
Figure 10
Visualisation of hazard impact modelling output grid generated using Taverna workflow on VRE.
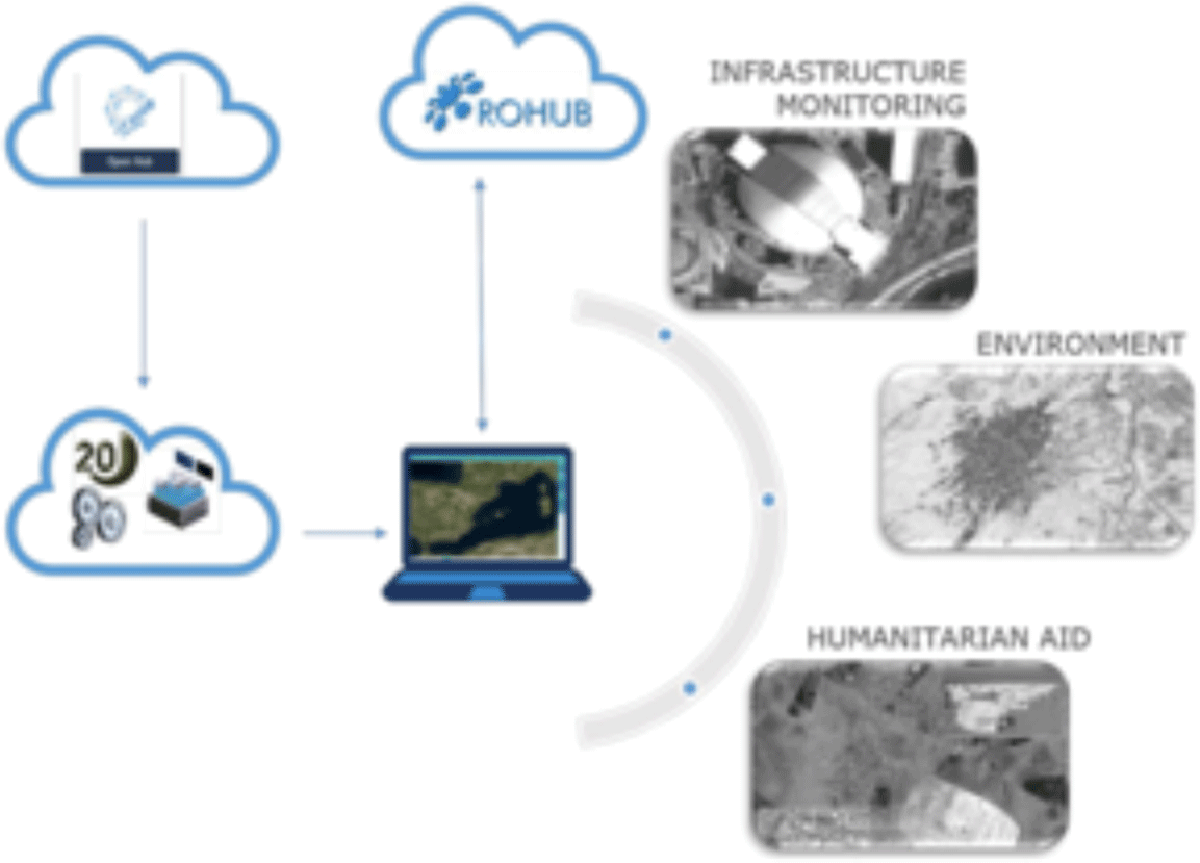
Figure 11
Land Monitoring Use Case scheme.
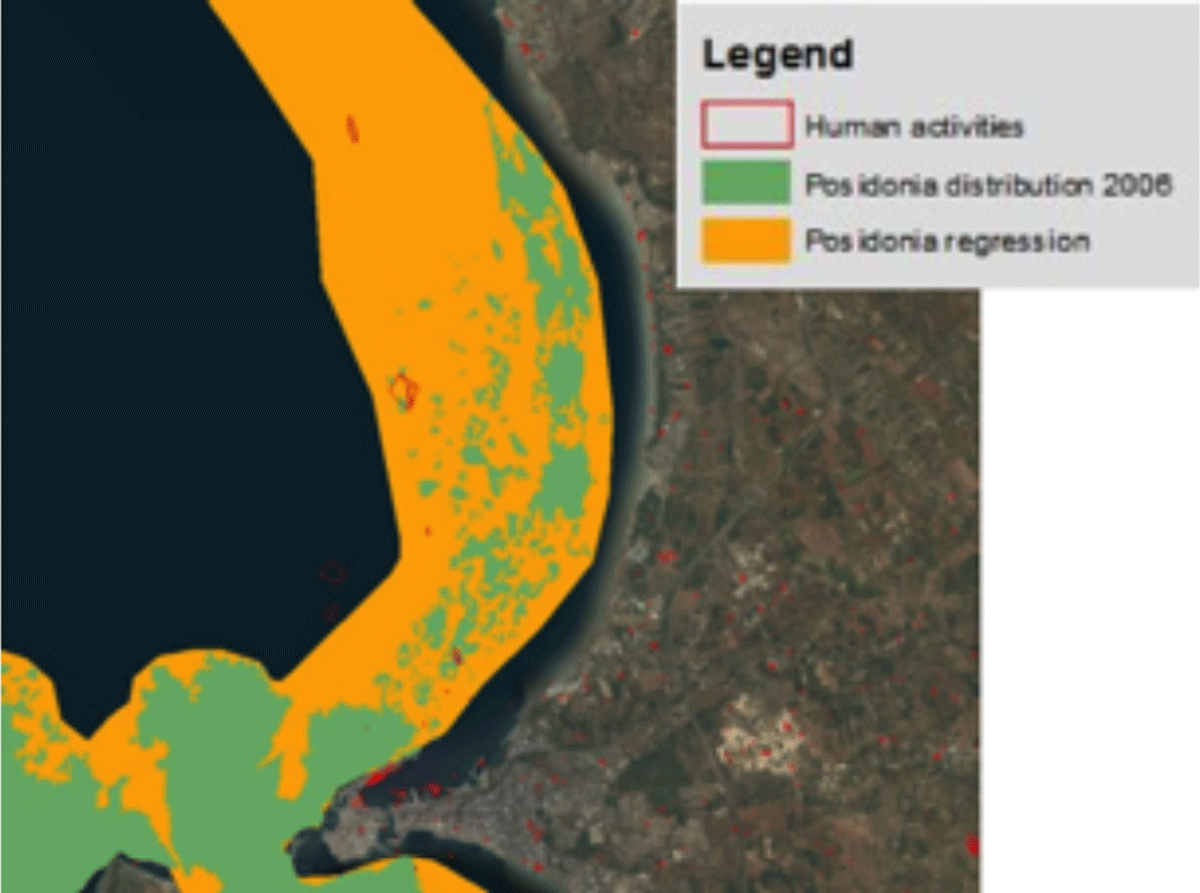
Figure 12
Overlay between SM and LM Research Object results.
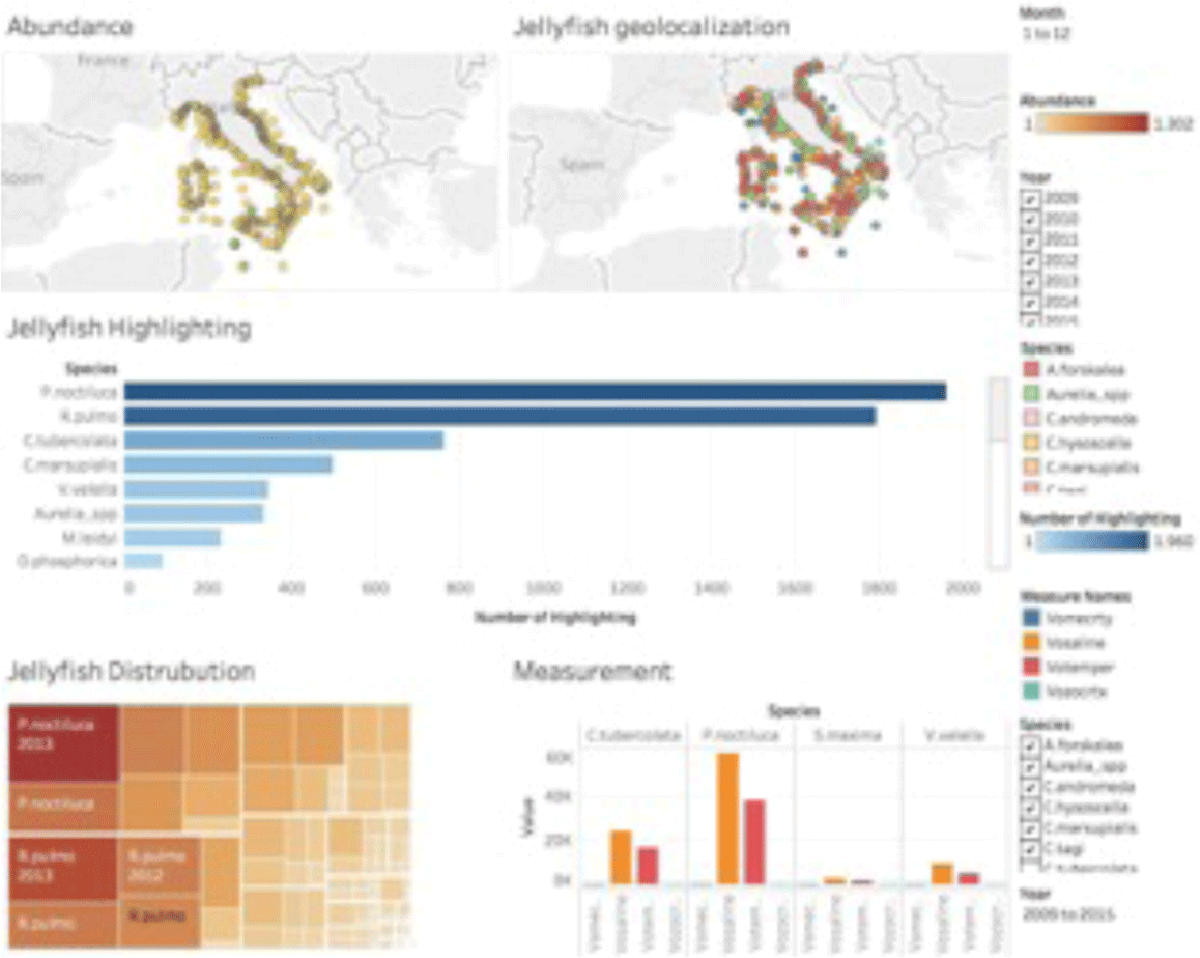
Figure 13
Jellyfish analysis Dashboard.
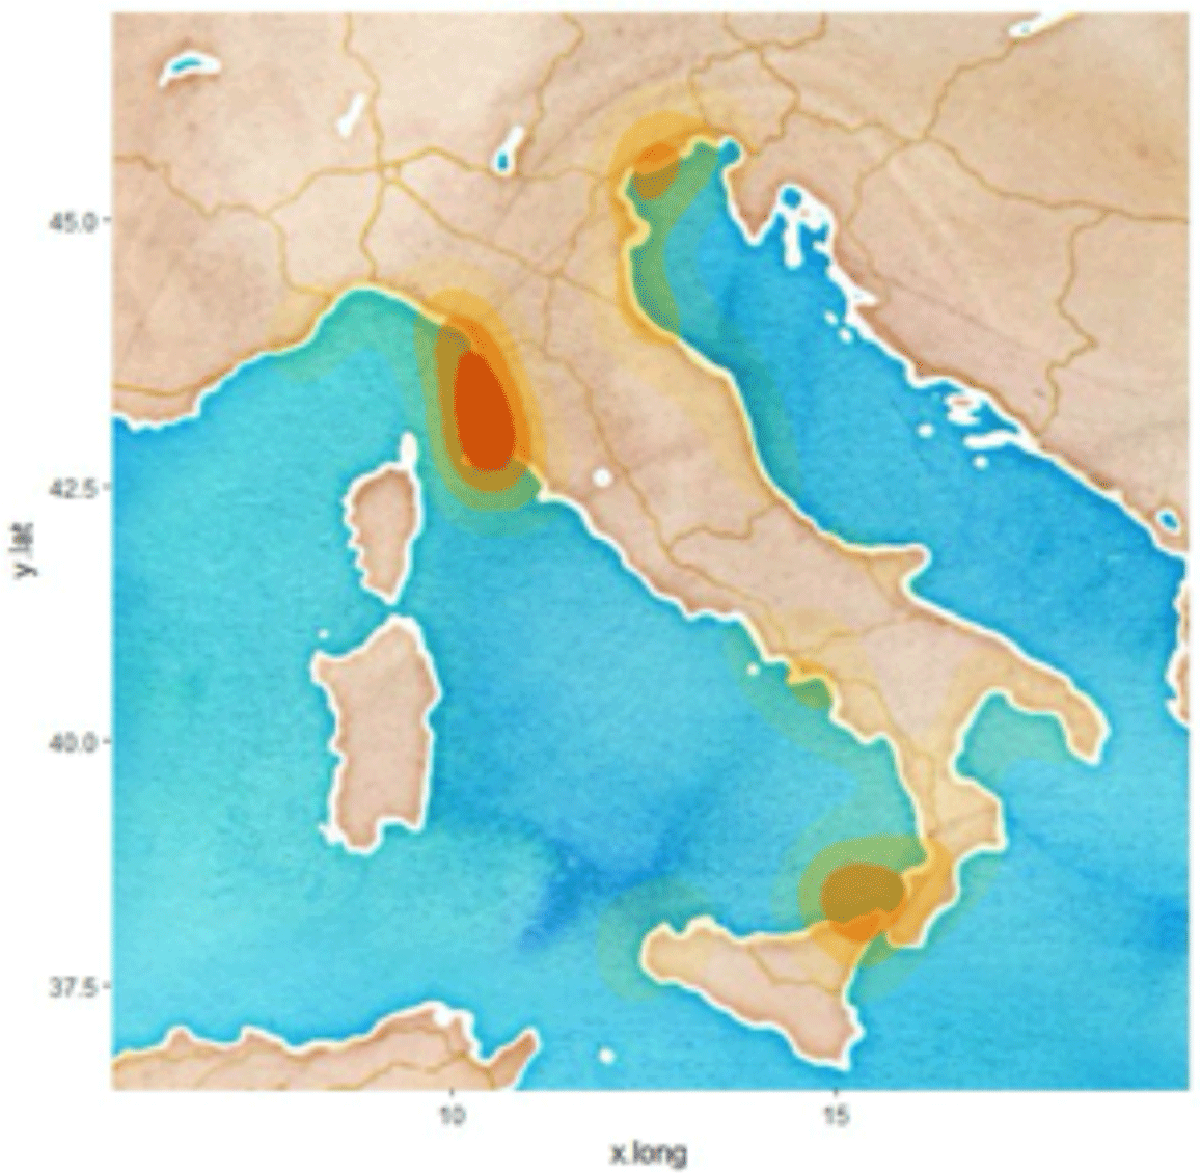
Figure 14
Observations density.
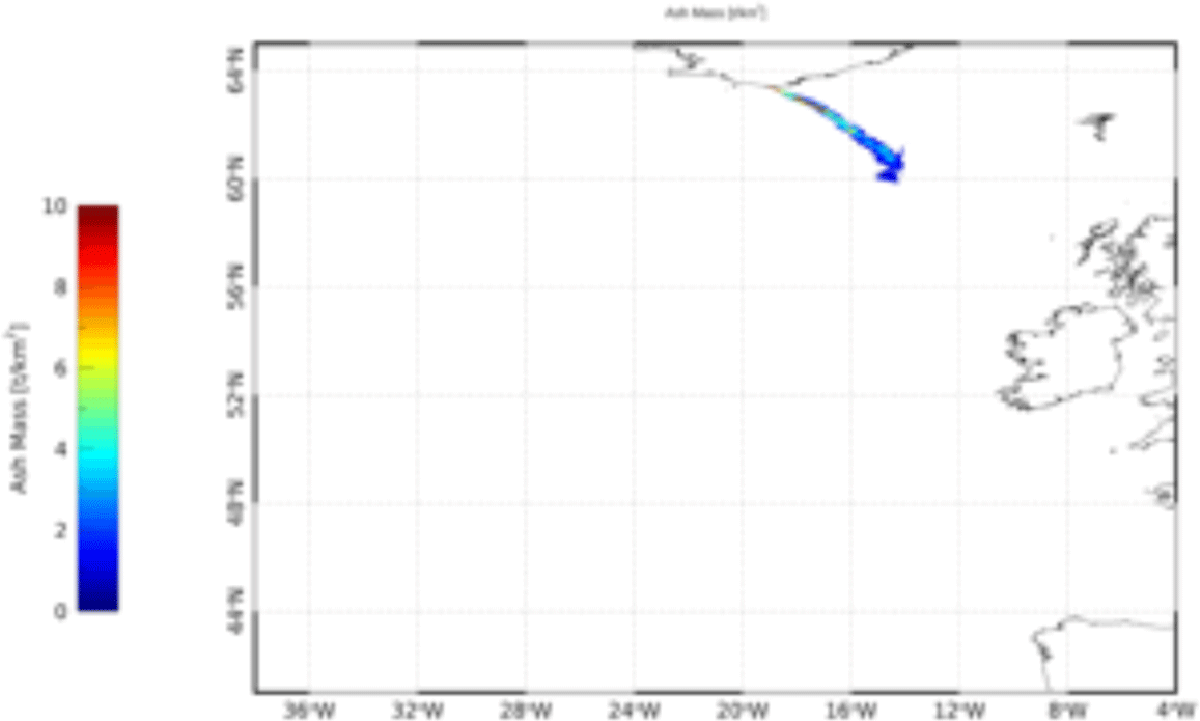
Figure 15
Map of computation of plume transmittance in the TIR-MODIS.
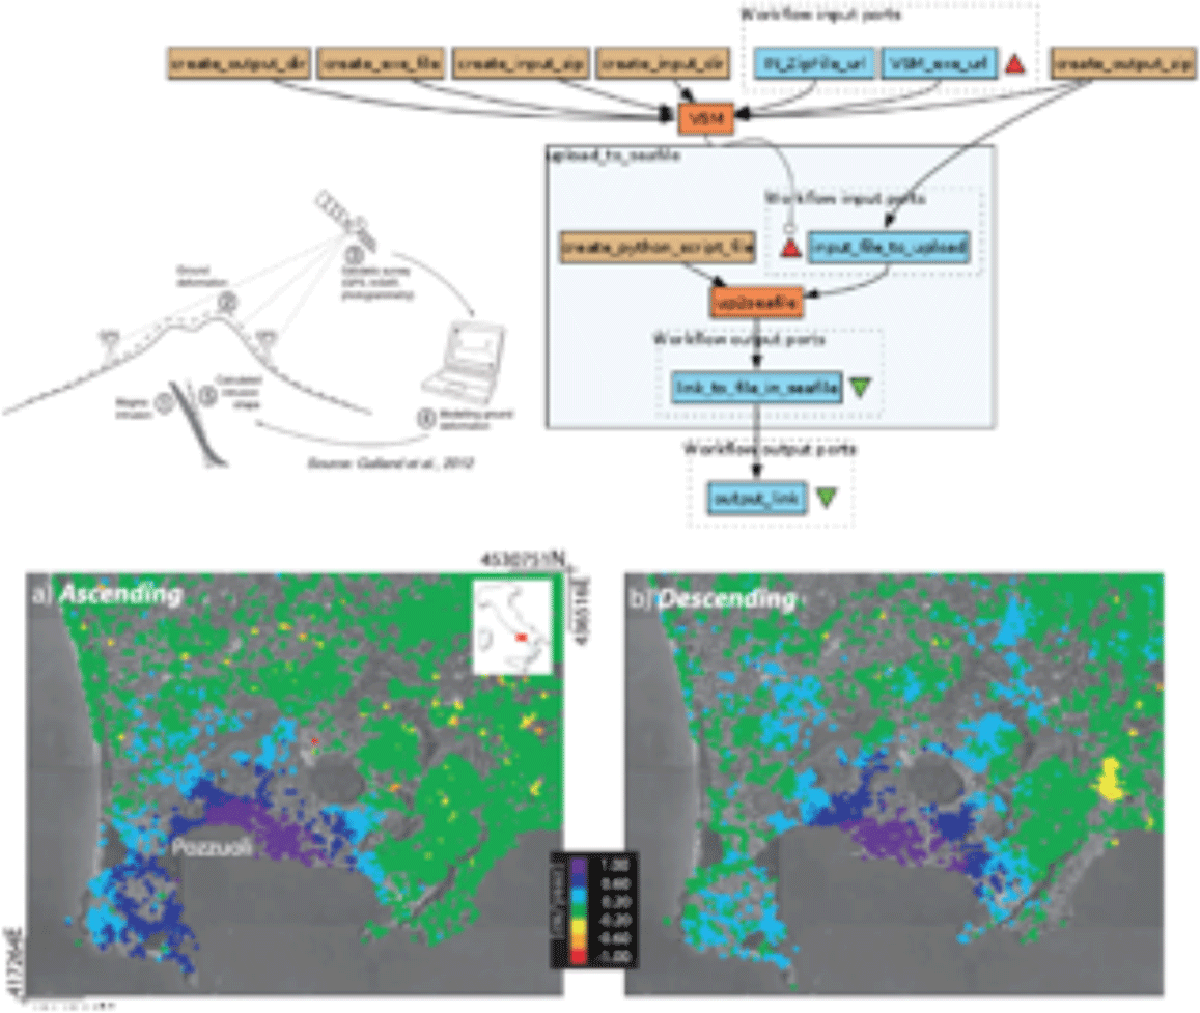
Figure 16
Schematic view of the RO content.
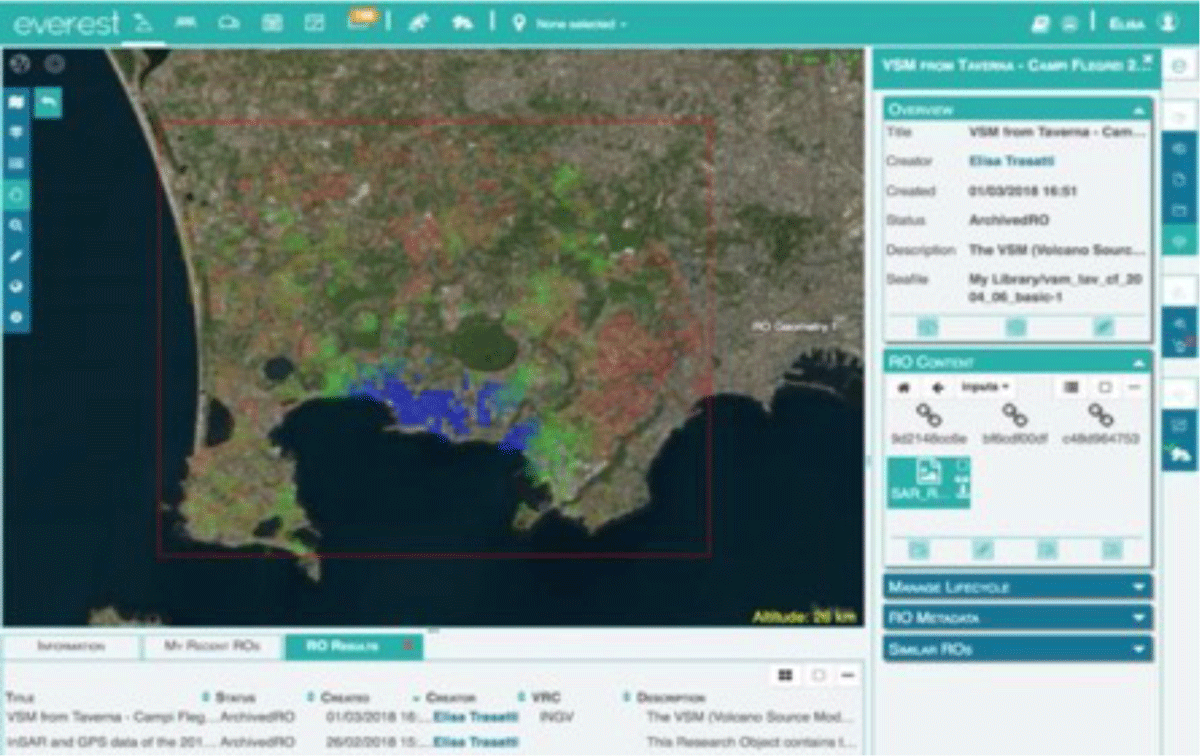
Figure 17
The VSM modelling tool performs geodetic data inversion of magmatic source.
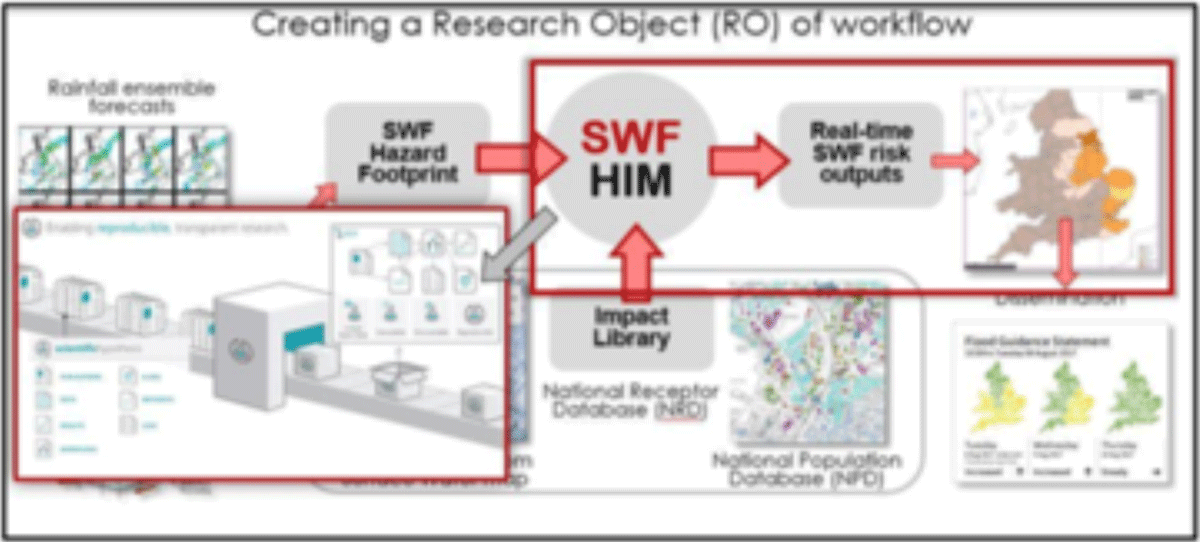
Figure 18
Schematic view of the RO content.