

Figure 1
The muon hodoscope URAGAN. In the foreground, one of the supermodules is seen. On the left and at the background the other three SM a located.
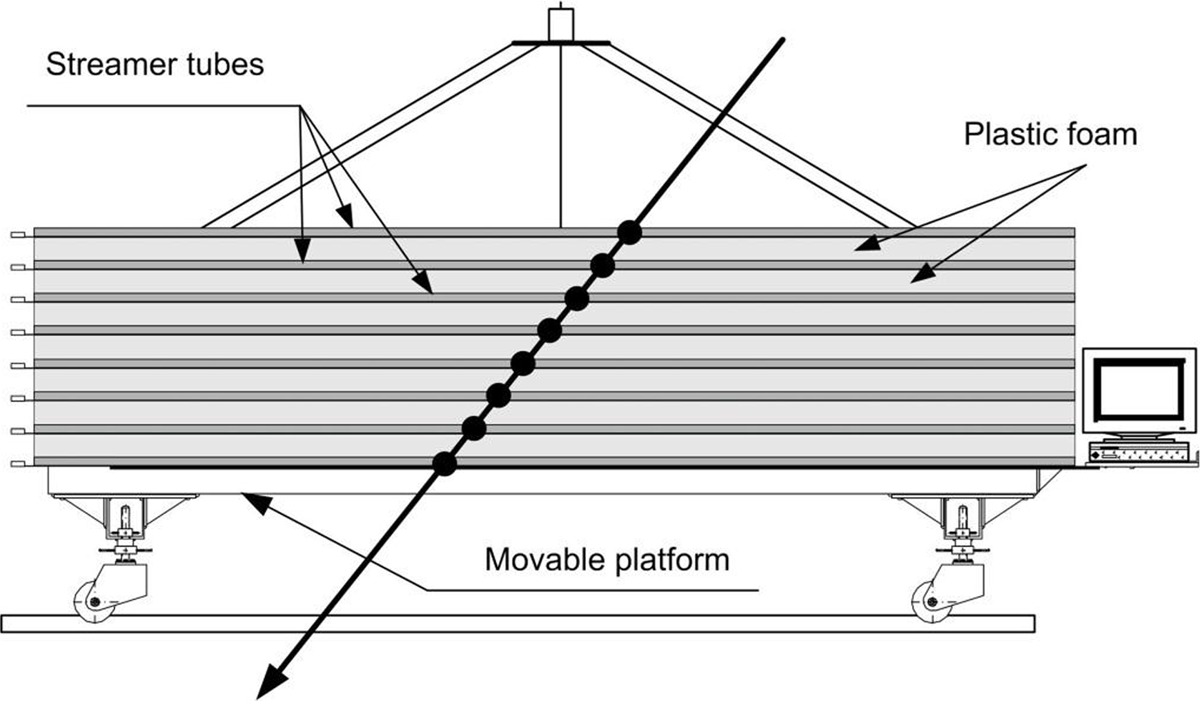
Figure 2
Scheme of single particle detection in the SM.

Figure 3
10-minute average counting rates of the URAGAN hodoscope without and with corrections for meteorological effects.

Figure 4
Temporal changes in parameters B, Vsw, Kp-index, counting rate and the parameter of the local anisotropy according to URAGAN for the period from September 9 to October 10, 2016.