
Table 1
RC and corresponding clues coding examples.
| Interview process | Clues | RC |
|---|---|---|
| Q1: What is your basis for judging the relevance of data in completing this task? | ||
| A1: Mainly focusing on data keyword | Data keywords | |
| Q2: So what is the role of data keywords? | ||
| A2: I often use the keywords to determine whether it is the topic I want | Topicality |
[i] Note: Q = question from interviewer; A = answer from subject.
Table 2
RC usage paths coding examples.
| Interview process | Paths of criteria use |
|---|---|
| Coding based on direct answers | |
| Q1: How do you judge the relevance of scientific data? | |
| A1: First, I judge the topic based on the data keywords, and then check the quality of the data. If the data quality is satisfying, it will be relevant. | Topicality–>quality |
| Coding based on different answers in context | |
| Q1: How do you judge the relevance of scientific data? | |
| A1: It is based on data keywords | |
| Q2: Do you rely solely on data keywords? | |
| A2: No, I still need to see the data production organization and whether the data can solve my current task.” | Topicality–>authority–>usefulness |
[i] Note: Q = question from interviewer; A = answer from subject.
Table 3
The coding results of RC and corresponding clues.
| Clues | RC | Freq. | Resp. |
|---|---|---|---|
| Topicality (TO) | 325 | 20 | |
| Data Title (DT) | 107 | 19 | |
| Data keywords (DK) | 123 | 20 | |
| Data description (DD) | 60 | 14 | |
| Data time scope (DTS) | 35 | 12 | |
| Accessibility (AC) | 268 | 19 | |
| Data acquisition channel (DAC) | 88 | 19 | |
| Data sharing level (DSL) | 74 | 19 | |
| Support download? (DSD) | 95 | 19 | |
| Data size (DS) | 11 | 8 | |
| Authority (AU) | 135 | 17 | |
| Data producer (DP) | 44 | 13 | |
| Organization of data producer (DODP) | 35 | 13 | |
| Data supply platform (DSP) | 56 | 15 | |
| Quality (QU) | 123 | 16 | |
| Data quality illustration (DQI) | 54 | 16 | |
| Data producing and processing methods (DPPM) | 67 | 16 | |
| Data Searching ranking order (DSRO) | 3 | 2 | |
| Data Visiting volume (DVV) | 2 | 2 | |
| Usefulness (US) | 293 | 19 | |
| US1: Scientific data as research evidences | 44 | 15 | |
| US2: Scientific data can verify research theories | 52 | 19 | |
| US3: Scientific data is the basis of my research | 68 | 20 |
[i] Note: Freq. = number of coding reference nodes; Resp. = number of subjects.
Table 4
Definitions of scientific data RC.
| Criteria | Definition |
|---|---|
| Topicality | The consistency between the topic perceived by users and the topic expressed by the data themselves. |
| Accessibility | The external restriction of the data. |
| Authority | The source of the data is reliable. |
| Quality | The data meet the requirements in terms of precision, accuracy, verifiability, etc. |
| Usefulness | Users perceive the utility of scientific data to solve problems in situations. |
Table 5
The coding results of RC use paths.
| RC use paths | Mentions | Percent | Respondents |
|---|---|---|---|
| TO → AC | 96 | 20.3 | 19 |
| TO → QU | 65 | 13.8 | 19 |
| TO → AU | 64 | 13.6 | 17 |
| TO → US | 58 | 12.3 | 17 |
| TO → AC → US | 31 | 6.6 | 12 |
| TO → QU → US | 23 | 4.9 | 9 |
| TO → AU → US | 39 | 8.3 | 16 |
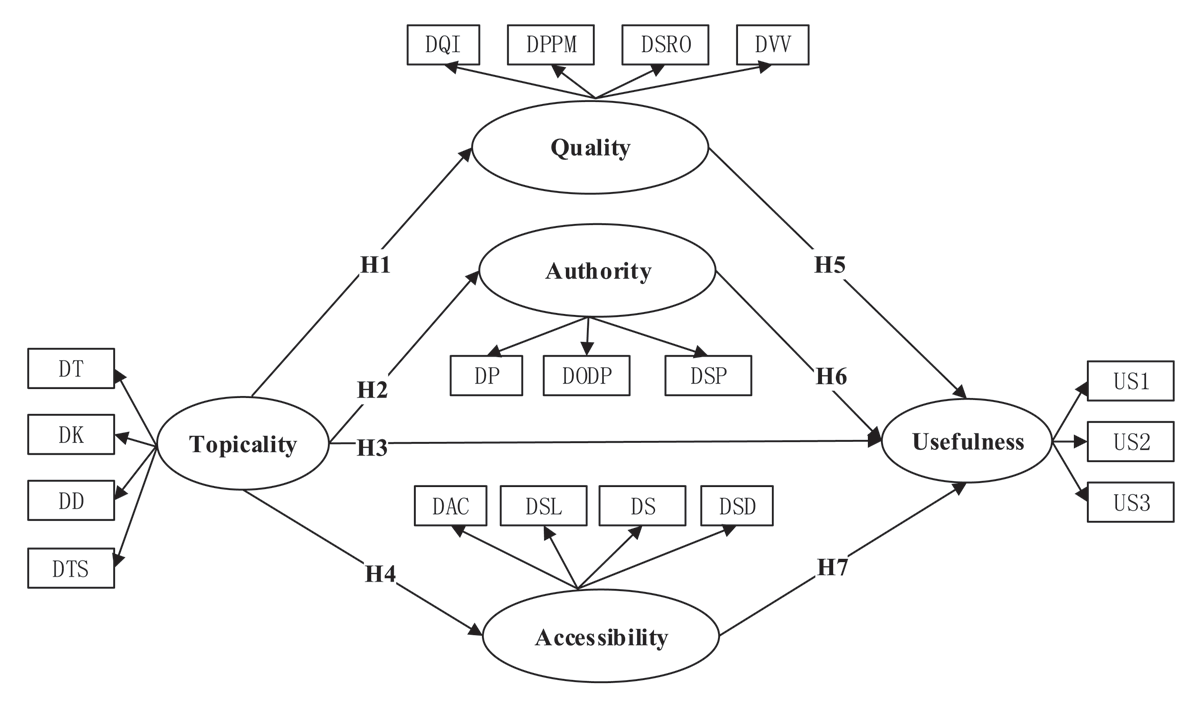
Figure 1
Research model.
Table 6
Reflective measurements.
| RC | Clues | Mean | SD | SL | AVE | C.R | α |
|---|---|---|---|---|---|---|---|
| Topicality | 0.545 | 0.826 | 0.719 | ||||
| DT | 4.412 | 1.362 | 0.657*** | ||||
| DK | 4.756 | 1.190 | 0.816*** | ||||
| DD | 4.579 | 1.281 | 0.784*** | ||||
| DTS | 4.524 | 1.309 | 0.687*** | ||||
| Quality | 0.534 | 0.820 | 0.708 | ||||
| DQI | 4.634 | 1.322 | 0.811*** | ||||
| DPPM | 4.211 | 1.354 | 0.720*** | ||||
| DSRO | 4.022 | 1.411 | 0.691*** | ||||
| DVV | 4.110 | 1.459 | 0.694*** | ||||
| Authority | 0.670 | 0.859 | 0.752 | ||||
| DP | 3.761 | 1.355 | 0.750*** | ||||
| DODP | 3.671 | 1.409 | 0.860*** | ||||
| DSP | 3.998 | 1.389 | 0.842*** | ||||
| Accessibility | 0.546 | 0.827 | 0.720 | ||||
| DAC | 4.278 | 1.281 | 0.765*** | ||||
| DSL | 3.991 | 1.429 | 0.769*** | ||||
| DS | 3.404 | 1.346 | 0.622*** | ||||
| DSD | 4.881 | 1.308 | 0.788*** | ||||
| Usefulness | 0.591 | 0.812 | 0.650 | ||||
| US1 | 4.233 | 1.332 | 0.692*** | ||||
| US2 | 4.237 | 1.384 | 0.814*** | ||||
| US3 | 3.803 | 1.373 | 0.796*** |
[i] Note: *** Significant at 0.001 (two-tailed); SL = standardized loading; C.R = composite reliability; α = Cronbach’s alpha; AVE = average variance extracted.
Table 7
Fornell-Larcker-Criterium.
| Latent Variable Correlations(LVC) | Discriminant Validity met? (Square root of AVE>LVC?) | |||||
|---|---|---|---|---|---|---|
| AC | AU | QU | TO | US | ||
| AC | 0.739 | Yes | ||||
| AU | 0.626 | 0.819 | Yes | |||
| QU | 0.684 | 0.596 | 0.731 | Yes | ||
| TO | 0.634 | 0.505 | 0.653 | 0.738 | Yes | |
| US | 0.672 | 0.562 | 0.689 | 0.610 | 0.769 | Yes |
[i] Note: The top value in each column is the value of square root of AVE, which replaces self-correlation value of 1.
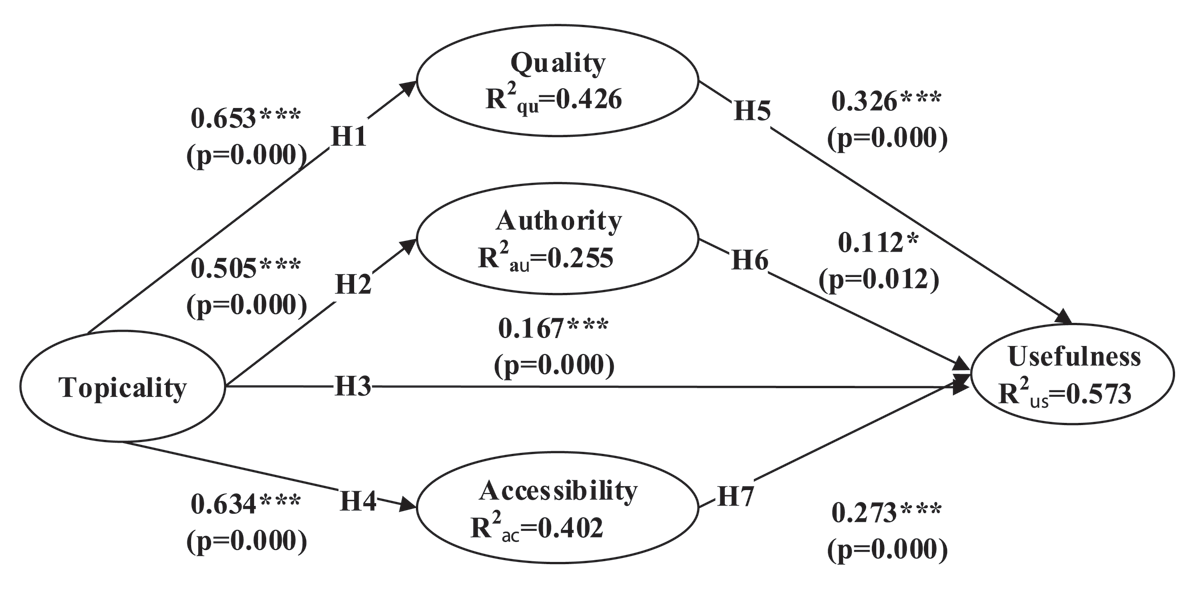
Figure 2
RC use structure model of scientific data users.
Note: Hypothesis testing result with SmartPLS3; SRMR = 0.088; * p < 0.05, ** p < 0.01, *** p < 0.001.