
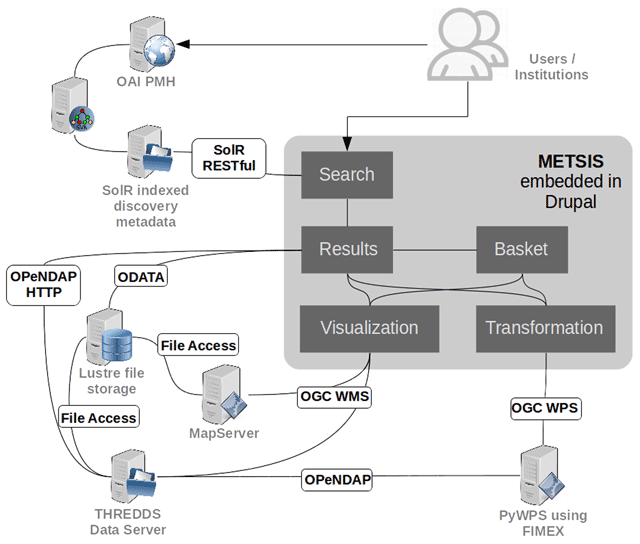
Figure 1
Technology infrastructure diagram in the NBS dissemination setup. All functionality within the system is available for the users through METSIS which contains multiple modules embedded in Drupal. The most common work flow is to use the search module to search for products. The module queries the indexed discovery metadata in SolR and lists the results on a new page. Data access points and services are given in dedicated elements in the discovery metadata. It is also possible to harvest the discovery metadata directly using OAI PMH. The METSIS modules access data and services by means of the dedicated elements in the discovery metadata.
Table 1
Schematic overview of all products currently available in SAFE format in NBS as for 2019-30-01.
| Mission | Product Types | Retrieval Node | Approximate Number of Products | Approximate Size (PB) |
|---|---|---|---|---|
| Sentinel-1 | RAW, SLC, GRD, OCN | ESA Node 1, Node 2, Node 3 | 600k | 0.8 |
| Sentinel-2 | L1C, L2A | DLR | 740k | 0.7 |
| Sentinel-3 | SLSTR, OLCI, Synergy, Altimetry | EUMETSAT, ESA | 210k | 0.1 |
| Total | 1550k | 1.6PB |
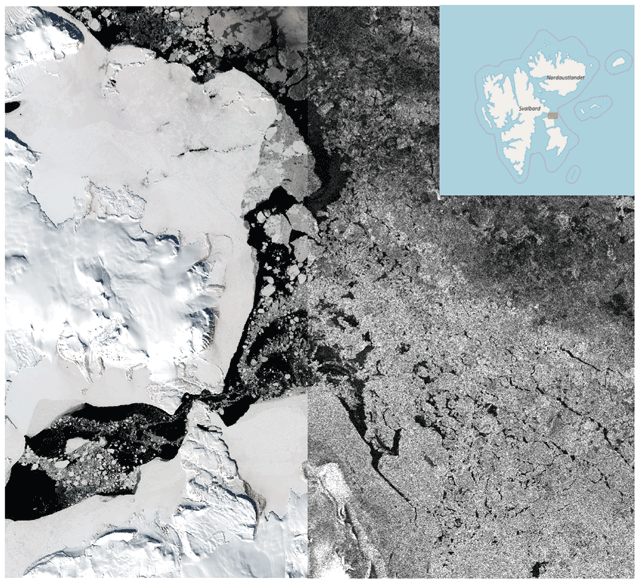
Figure 2
Co-visualization of Sentinel-2 MSI true color vegetation composite (left) and Sentinel-1 Interferometric Wide Swath SAR VV polarization data (right) covering Einhyrningbukta between the East coast of Spitzbergen and The Barents Island in Svalbard. Both images are acquired 29th April 2018 with approximately 2.5 hours time delay and visualized through the basket functionality. The land fast ice does not move but the drift of sea ice can be seen in the center of the image.
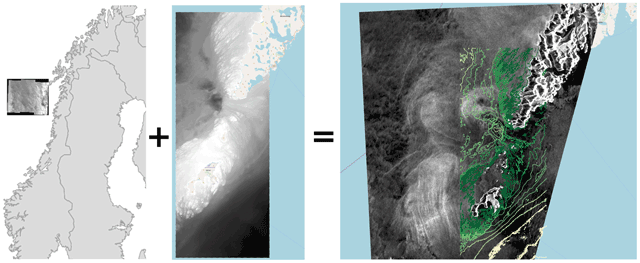
Figure 3
The result of subsetting and aligning a Sentinel-1 GRD Interferometric Wide Swath SAR product by means of FIMEX with ocean bathymetry data provided by The Norwegian Mapping Authorities in EPSG:25833 projection. Left image show the extent of the Sentinel-1 scene in the OL3 visualization client embedded in the NBS dissemination system. In the middle, ocean bathymetry data is plotted in a GIS tool in gray-scale where black and white denotes deep and shallow waters respectively. Right image show the subset from Sentinel-1 SAR swath product covering the Lofoten peninsula in northern Norway aligned with the ocean bathymetry data overlaid as contours. For the contours, the green gradient goes from dark to bright indicating shallow and bright respectively. In both the middle and right image, the products are overlaid on an OpenStreetMap background layer.
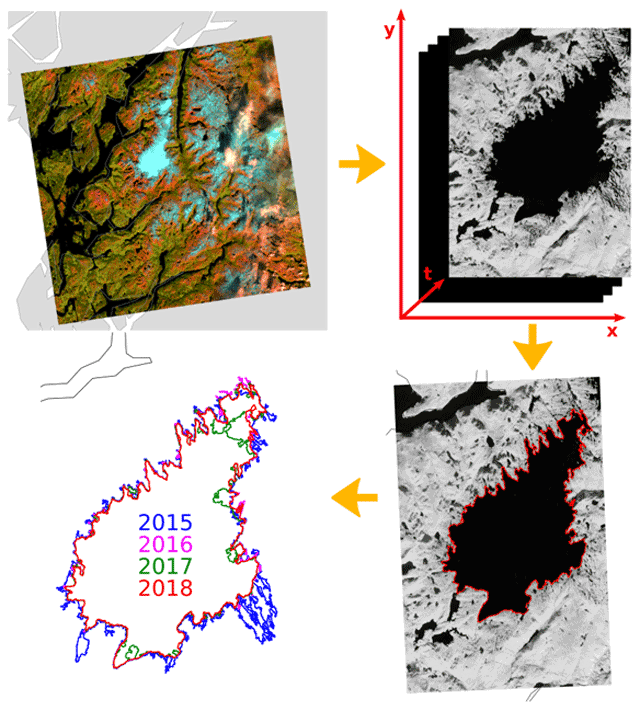
Figure 4
Processing steps from extracting the extent of the Folgefonna glacier in Norway at different times from subsetting of Sentinel-2 L1C NetCDF-4/CF files using OPeNDAP. Upper left, upper right, lower right and lower left show 1) coverage of tile T32VLM in the OL3 client in a false color composite, 2) concept of temporal aggregating of products covering the same area, 3) the Folgefonna glacier extent decided by means of density slicing from the computation of the Normalised Difference Snow Index and 4) polygons showing the glacier extent from four different years in the same plot, respectively.