
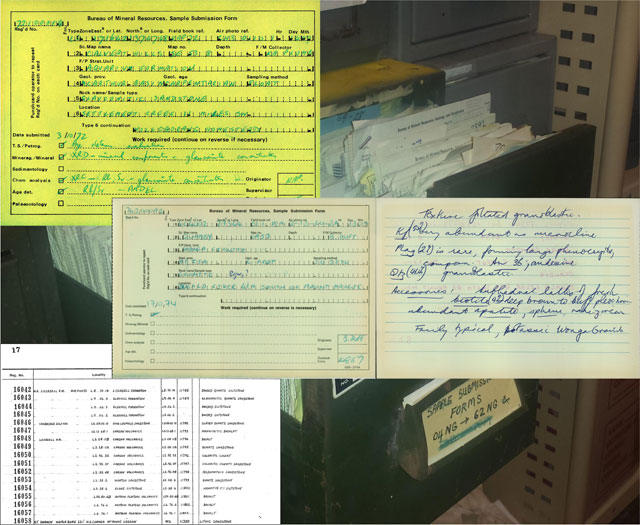
Figure 1
Illustration of current management ‘system’.
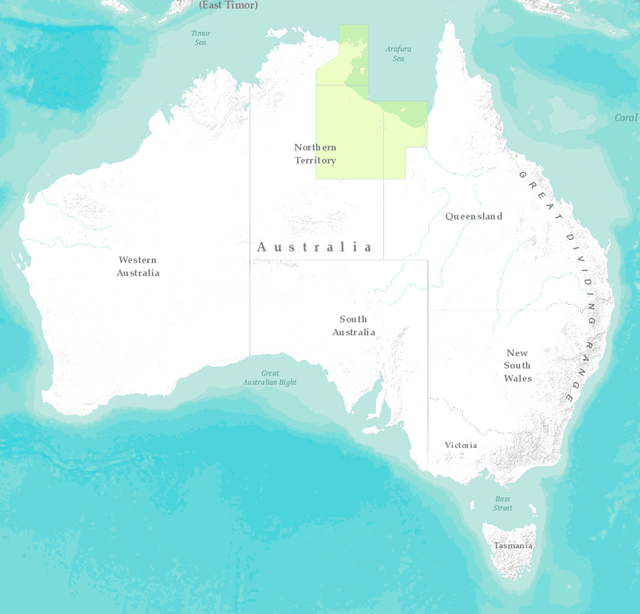
Figure 2
Map showing the ‘Area of Interest’ where the initial rescue operation was targeted.
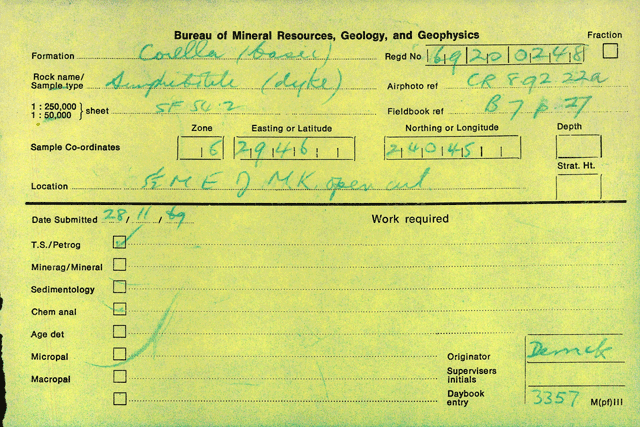
Figure 3
Sample Submission Card (Simple).
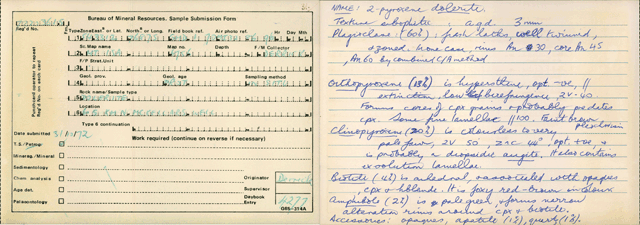
Figure 4
Sample Submission Card (Long #1).
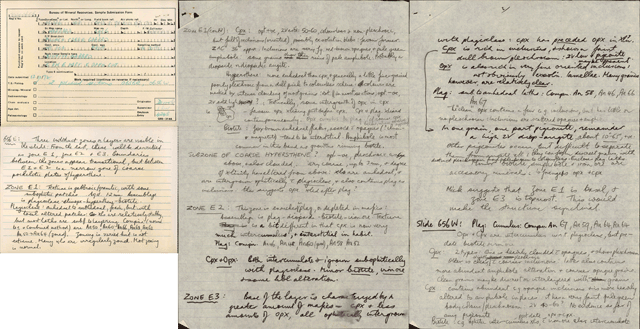
Figure 5
Sample Submission Card (Long #2).
Table 1
DigiVol Image Requirements.
| Criteria | Requirement (DigiVol) (ALA 2017a) |
|---|---|
| Format | JPEG |
| File Size | 1–2 MB (2 MB max) |
| Number of images per task | One |
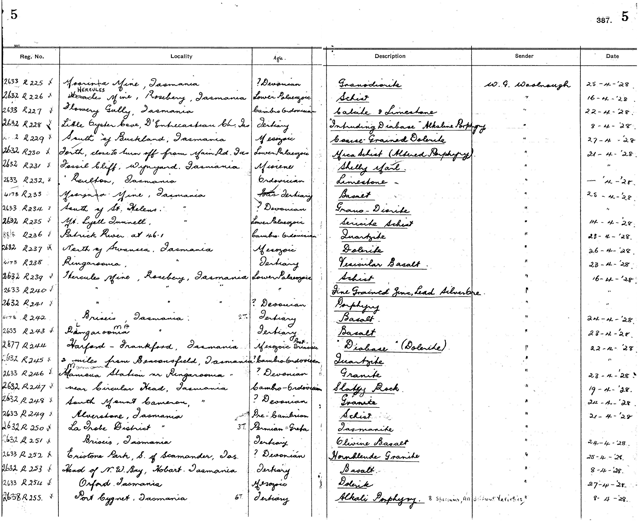
Figure 6
Rock (Sample) Register (example page).
Table 2
Expedition Sizes.
| Item Transcribed (Register/Card) | Number of pages (Registers) | Number of Sample Submission Cards |
|---|---|---|
| Rock Register 2 | 471 | |
| Rock Register 1 | 505 | |
| Sample Cards #1 | 901 | |
| Sample Cards #2 | 959 | |
| Sample Cards #3 (Long format/multi page) | 390 | |
| Sample Cards #4 | 990 | |
| Sample Cards #5 | 1409 | |
| Sample Cards #6 | 1208 |

Figure 7
Example DigiVol transcription User Interface.
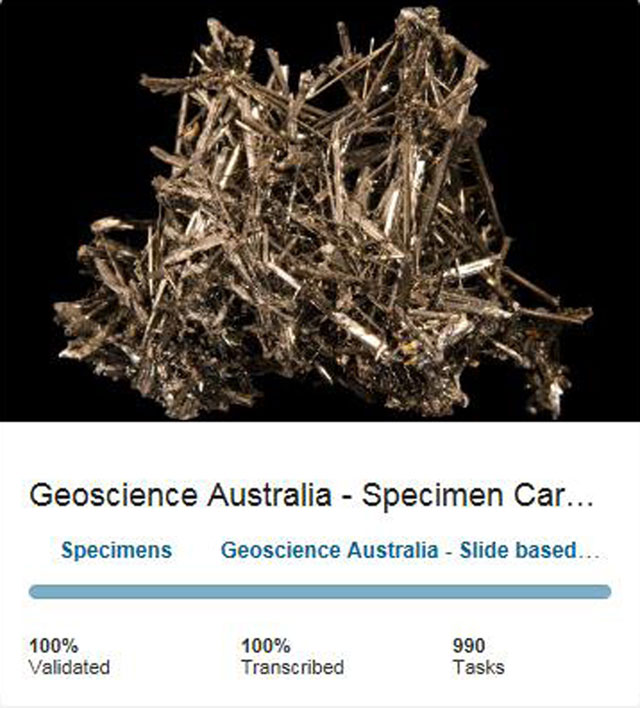
Figure 8
Interesting Cover Photograph to capture Volunteer interest.
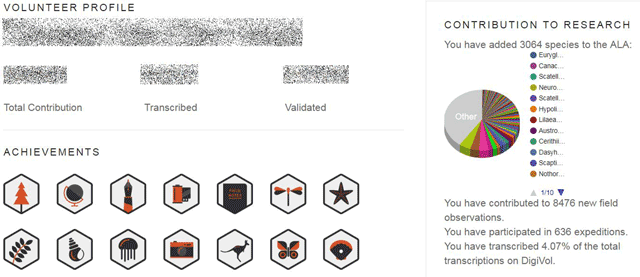
Figure 9
Example DigiVol User Profile.
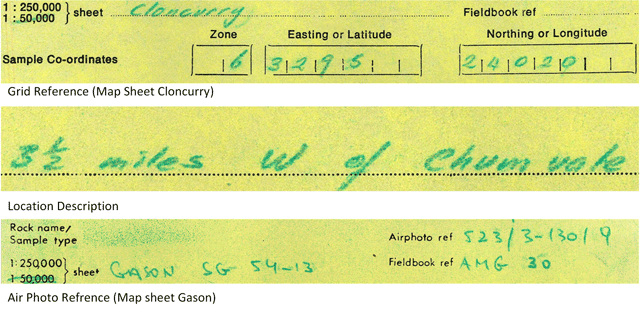
Figure 10
Example Spatial References (Sample Submission Card).
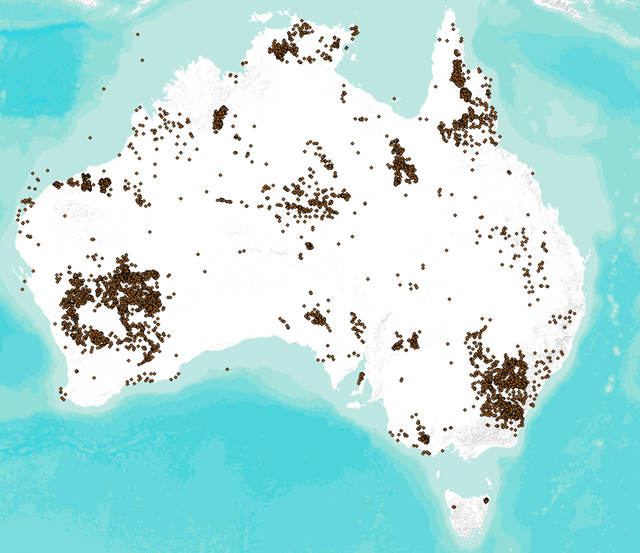
Figure 11
Map of Thin Sections within Australia.
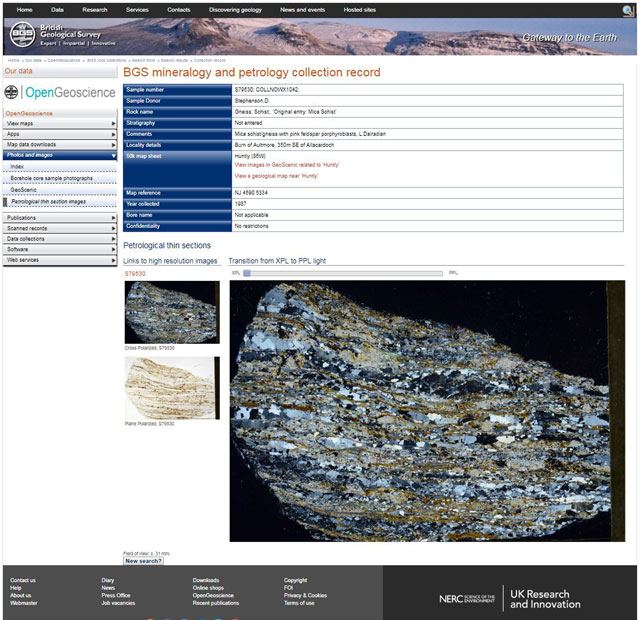
Figure 12
British Geological Survey Online discovery tool with thin section images. (sample S79350).

Figure 13
Example DigiVol volunteers working on our rock expeditions.
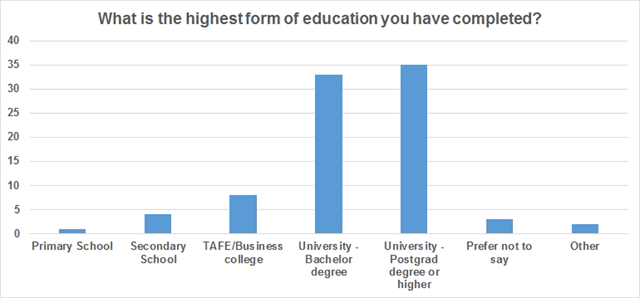
Figure 14
Highest level of Education for DigiVol Volunteers (Lang, 2015).
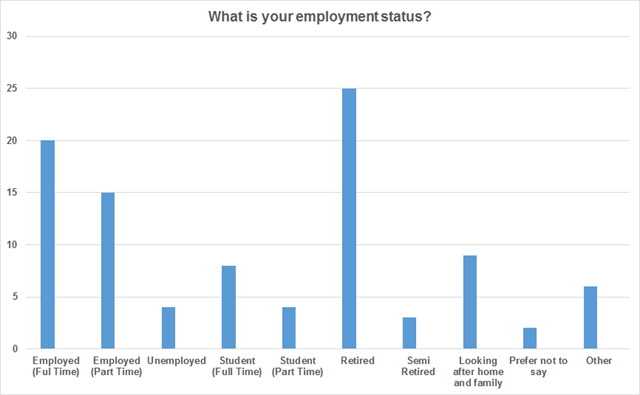
Figure 15
Employment status – DigiVol Volunteers (Lang, 2015).
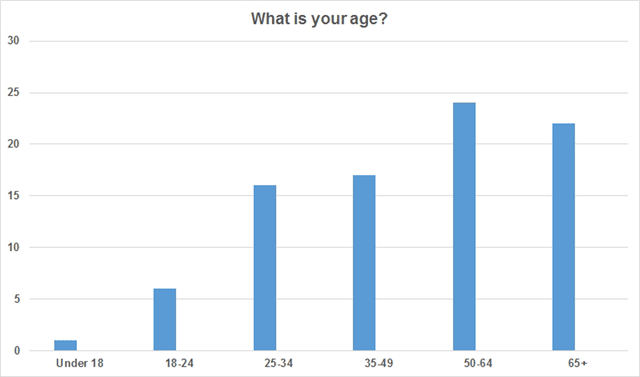
Figure 16
Age of DigiVol volunteers (Lang, 2015).
Table 3
Level of Volunteer effort in transcribing tasks (Time to transcribe each type of record based on average of independent anecdotal advice from Users).
| Type of card | Length of time to Transcribe | Number of items | Estimate of effort by volunteers |
|---|---|---|---|
| Rock Register page | 45 min | 976 | 658.8 hours |
| Sample Card (simple) | 5 min | 2850 | 614.9 hours |
| Sample Card (long) | 20 min | 390 | 130.0 hours |
| Total | 1143.7 hours |
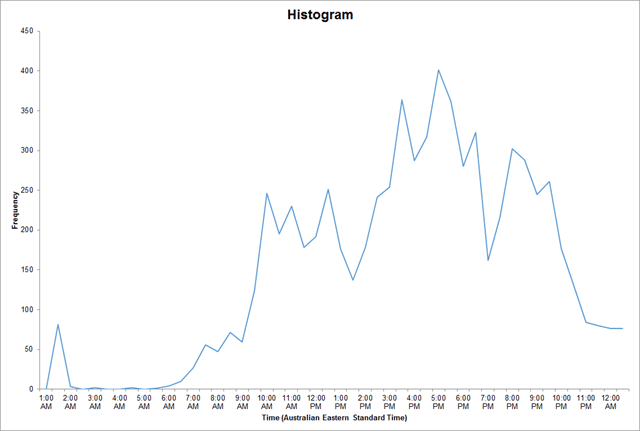
Figure 17
Graph – Total Number of Items Transcribed vs Time of Day (Based on transcription metadata generated from Geoscience Australia Slide Based collection expeditions (DigiVol).

Figure 18
Graph – Total number of Transcriptions vs Day of the week.
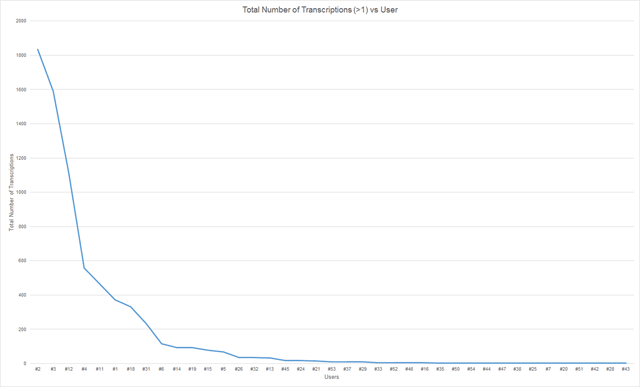
Figure 19
Graph – Total Number of Transcriptions (>1) vs User.