
| Subject area | Image Processing, Computer Vision, Machine learning and Deep learning. |
| More specific subject area | Feature Extraction, Speech recognition and Text Recognition. |
| Type of data | Images, Audio files, Tables and Figures. |
| How data was acquired (Experimental Setup) | Original videos were captured at University Institute of Engineering Technology, Kanpur using a Canon Eos 1200D 18MP Digital SLR Camera with 18–55 mm and 55–250 mm lens in a highly sophisticated and noise free experimental laboratory. |
| Data format | Videos are in .MOV format, Frames are in .jpg format, audio files are in .wav format, Wave graphs for are in .png format. |
| Experimental factors | The video samples that have been generated for various subjects are De-noised by using Neat Video (Other, 2019). |
| Experimental features | Extract various biometric traits for every subject such as frames, boundary box coordinates, audio of the entire video of a subject, the audio wave signal for entire video length, split audio of text spoken by subject, and split audio waveform. |
| Data source location | University Institute of Engineering Technology, Kanpur, India. |
| Data accessibility | The dataset is accessible and it is publicly and freely available for any research, educational, and purposes. |
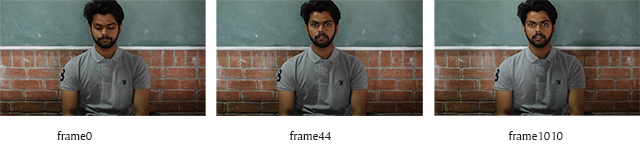
Figure 1
Frames generated for a sample video DSC_0020.MOV.
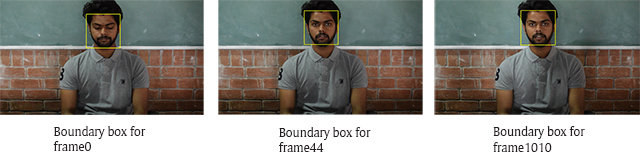
Figure 2
Boundary box for the frames generated for a sample video.
Table 1
.csv format for the boundary box coordinates of each frame for sample video DSC_0020.MOV.
| Frames | Lower Left (X) | Lower Left (Y) | Upper Left (X) | Upper Leftz (Y) | Upper Right (X) | Upper Right (Y) | Lower Right (X) | Lower Right (Y) |
|---|---|---|---|---|---|---|---|---|
| frame0.jpg | 821 | 134 | 821 | 450 | 1137 | 450 | 1137 | 134 |
| frame1.jpg | 822 | 135 | 822 | 448 | 1135 | 448 | 1135 | 135 |
| frame1010.jpg | 811 | 108 | 811 | 421 | 1124 | 421 | 1124 | 108 |
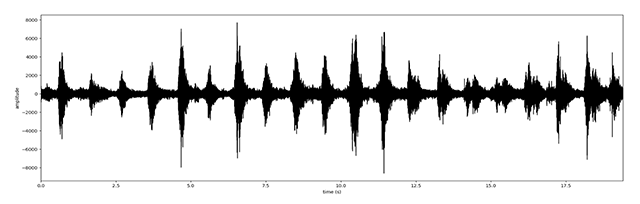
Figure 3
Wave form of a sample video DSC_0020.MOV.
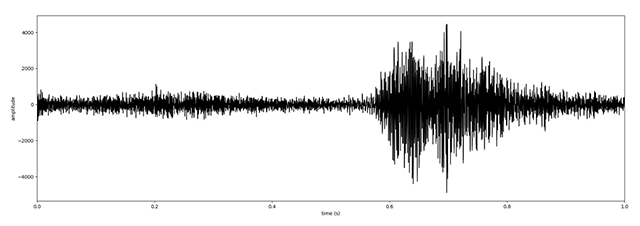
Figure 4
Wave form for digit 1 recited in DSC_0020.MOV.
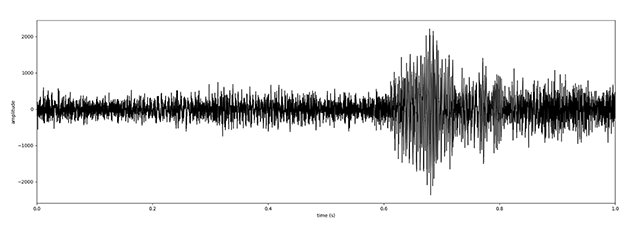
Figure 5
Wave form for digit 2 recited in DSC_0020.MOV.
Table 2
Configuration of Convolutional Neural Network.
| Layers | Filter Size | Strides | No. of filters |
|---|---|---|---|
| Convolution Layer 1 | 5 × 5 | 1 | 32 |
| Pooling Layer 1 | 2 × 2 | 2 | – |
| Convolution Layer 2a | 1 × 1 | 2 | 64 |
| Convolution Layer 2a_1 | 3 × 3 | 1 | 64 |
| Convolution Layer 2b | 3 × 1 | 1 | 64 |
| Convolution Layer 2b_1 | 1 × 3 | 1 | 64 |
| Pool 2b | 2 × 2 | 2 | – |
| Convolution Layer 2c | 1 × 1 | 2 | 64 |
| Concatenate | – | – | 192 |
| Pool 2 | 2 × 2 | 2 | – |
| Fully Connected Layer 1 | – | – | 1024 |
| Fully Connected Layer 2 | – | – | 1024 |
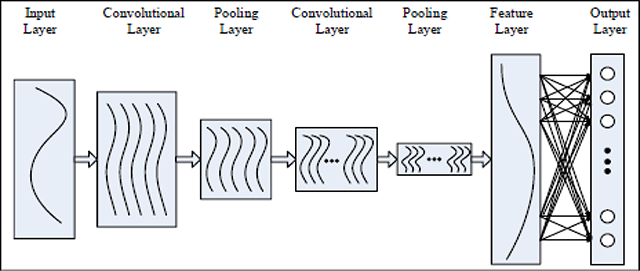
Figure 6
Architecture of CNN for speech recognition model (Zhao et al. 2017).
Table 3
Face Recognition Model Results on Our Dataset.
| Dataset | Training/Testing Percentage | Accuracy | Training Loss |
|---|---|---|---|
| Our Dataset (Handa, Agarwal, and Kohli, 2018) | 70% and 30% | 99.14% | 0.56% |
Table 4
Speech Recognition Model Results on Our Dataset.
| Dataset | Training/Testing Percentage | Accuracy | Training Loss |
|---|---|---|---|
| Our Dataset (Handa, Agarwal, and Kohli, 2018) | 70% and 30% | 96.42% | 0.67% |
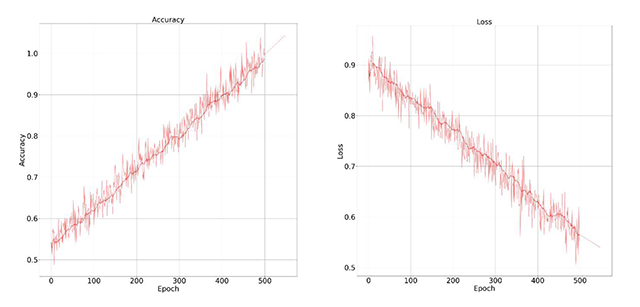
Figure 7
Accuracy and training loss results graph on our dataset for face recognition.
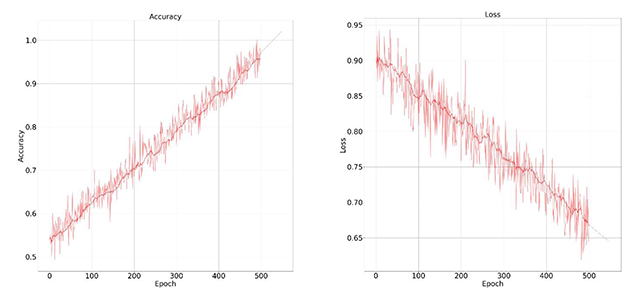
Figure 8
Accuracy and training loss results graph on our dataset for speech recognition.
Table 5
Face Recognition Model Results on JAFFE Dataset.
| Dataset | Training/Testing Percentage | Accuracy | Training Loss |
|---|---|---|---|
| JAFFE Dataset (Lyons et al., 1998) | 70% and 30% | 92.1% | 0.78% |
Table 6
Speech Recognition Model Results on FSDD Dataset.
| Dataset | Training/Testing Percentage | Accuracy | Training Loss |
|---|---|---|---|
| FSDD Dataset Jackson et al., 2018) | 70% and 30% | 89.2% | 0.81% |
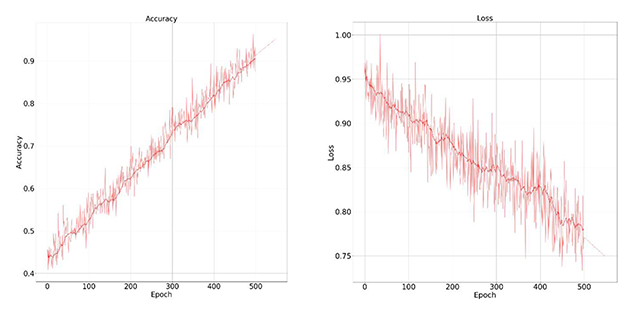
Figure 9
Accuracy and training loss results graph on JAFFE dataset for face recognition.
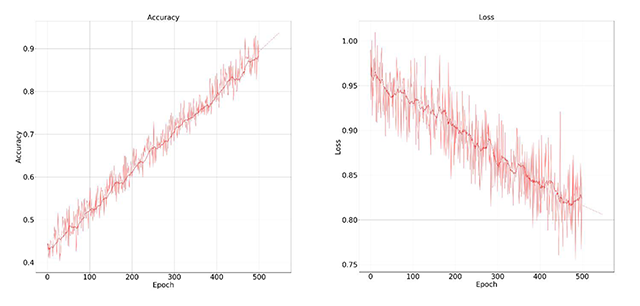
Figure 10
Accuracy and training loss results graph on FSDD dataset for speech recognition.
Table 7
Face Recognition test results of our trained model for JAFFE dataset.
| Dataset | Training/Testing Percentage | Accuracy | |
|---|---|---|---|
| Training | Testing | ||
| Our Dataset (Handa, Agarwal, and Kohli, 2018) | JAFFE Dataset (Lyons et al., 1998) | 70% and 30% | 93.04% |
Table 8
Speech Recognition test results of our trained model for FSDD dataset.
| Dataset | Training/Testing Percentage | Accuracy | |
|---|---|---|---|
| Training | Testing | ||
| Our Dataset (Handa, Agarwal, and Kohli, 2018) | FSDD Dataset Jackson et al., 2018) | 70% and 30% | 90.11% |
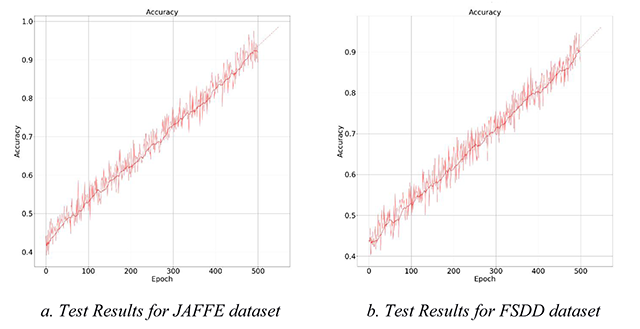
Figure 11
Test accuracy of face and speech recognition model trained on our dataset.