
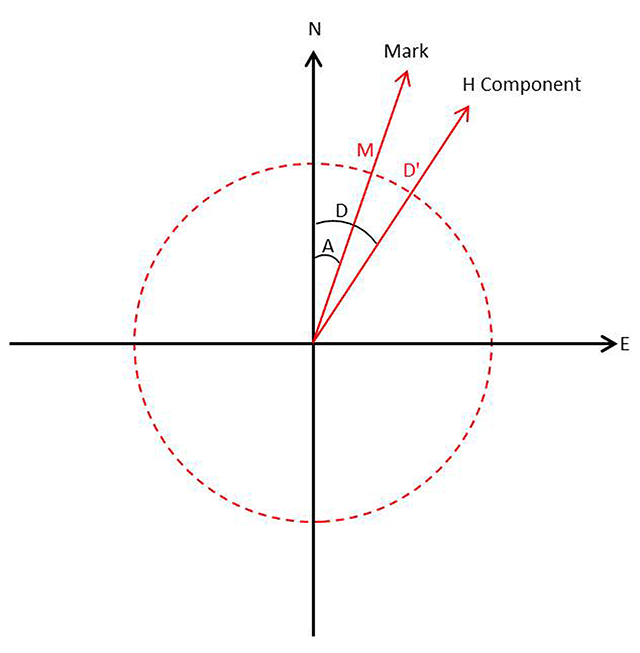
Figure 1
The main measuring principle of the declination.
Table 1
List of DIM comparisons performed by GNC.
| No. | Date | Year | Observatory | Instruments Number | Elements |
|---|---|---|---|---|---|
| 1 | 14–17 September | 2010 | Changchun | 15 | ΔD and ΔI |
| 2 | 10–12 September, 17–19 October, 24–26 October | 2012 | Qianling, Dalian, Shaoyang | 31 | ΔD and ΔI |
| 3 | 21–26 October | 2014 | Qianling | 41 | ΔD and ΔI |
| 4 | 15–20 September | 2015 | Urumqi | 41 | ΔD and ΔI |
| 5 | 21–29 September | 2016 | Qianling | 40 | ΔD and ΔI |
| 6 | 12–20 September | 2017 | Urumqi | 41 | ΔD and ΔI |
Table 2
List of instrument types and observatories.
| No. | Instrument | Observatory | No. | Instrument | Observatory | No. | Instrument | Observatory |
|---|---|---|---|---|---|---|---|---|
| 1 | Mingeo | Beijing | 22 | Mingeo | Lanzhou | 42 | GEO-DI | Taian |
| 2 | Mag01 | Changli | 23 | Mag01 | Lijiang | 43 | CTM | Taian |
| 3 | CTM | Changli | 24 | Mingeo | Luoyang | 44 | Mag01 | Tianshui |
| 4 | Mingeo | Chengdu | 25 | Mingeo | Malingshang | 45 | Mingeo | Tonghai |
| 5 | Mag01 | Chengdu | 26 | Mingeo | Manzhouli | 46 | Mingeo | Wujiahe |
| 6 | Mag01 | Chongming | 27 | CTM | Manzhouli | 47 | Mingeo | Urumqi |
| 7 | TDJ2E-NM | Chongming | 28 | Mag01 | Mengcheng | 48 | Mingeo | Wuhan |
| 8 | Mingeo | Dalian | 29 | CTM | Mengcheng | 49 | Mag01 | Wuhan |
| 9 | Mingeo | Dedu | 30 | Mingeo | Qianling | 50 | CTM | Wuhan |
| 10 | Mingeo | Enshi | 31 | Mag01 | Qianling | 51 | CTM | Xichang |
| 11 | Mingeo | Golmud | 32 | CTM | Qianling | 52 | Mag01 | Xilinhot |
| 12 | Mingeo | Guiyang | 33 | Mag01 | Qiemo | 53 | Mag01 | Xiannushan |
| 13 | CTM | Hangzhou | 34 | Mingeo | Qiongzhong | 54 | Mingeo | Yinchuan |
| 14 | Mag01 | Hangzhou | 35 | Mingeo | Quanzhou | 55 | Mingeo | Yongning |
| 15 | Mag01 | Hongshan | 36 | CTM | Quanzhou | 56 | CTM | Yulin |
| 16 | TDJ2E-NM | Hongshan | 37 | Mingeo | Shaoyang | 57 | Mingeo | Changchun |
| 17 | Mingeo | Jiayuguan | 38 | Mingeo | Sheshan | 58 | Mingeo | Zhaoqing |
| 18 | Mingeo | Jinghai | 39 | Mag01 | Shexian | 59 | Mag01 | Zhaoqing |
| 19 | Mag01 | Jinghai | 40 | Mingeo | Shiquanhe | 60 | TDJ2E-NM | Zhaoqing |
| 20 | Mingeo | Kashi | 41 | Mingeo | Taiyuan | 61 | Mag01 | Chongqing |
| 21 | Mingeo | Lhasa |
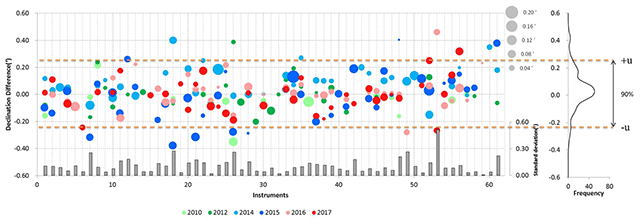
Figure 2
The difference of the declination of GNC. The balls represent the difference, the size of the balls is the standard deviation, and the scale is on the right. The grey bar, corresponding to the right vertical axis, is the standard deviation of the balls above it. The right panel is the frequency distribution of all of these results.
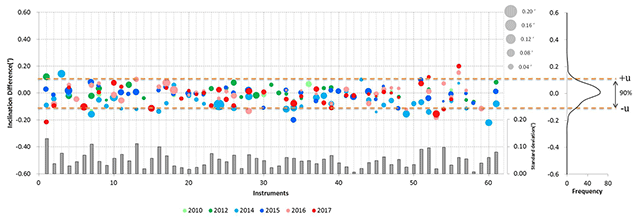
Figure 3
The difference of the inclination of GNC. The symbols have same meaning as those in Figure 2.
Table 3
The statistical results of all the comparison data.
| Elements | Mean (μ) | Std. (μ) | Percentage (μ ± σ) | Value range of 90% (±u) | Institution |
|---|---|---|---|---|---|
| ΔD | 0.01′ | 0.15′ | 75% | ±0.24′ | GNC |
| ΔI | –0.02′ | 0.07′ | 77% | ±0.11′ | GNC |
Table 4
List of DIM comparisons performed by IAGA.
| No. | Date | Year | Observatory | Country | Elements | Data source |
|---|---|---|---|---|---|---|
| 1 | 15–24 April | 2002 | Hermanus | South Africa | ΔD, ΔI, ΔH and ΔZ | Loubser, 2002 |
| 2 | 09–12 November | 2004 | Kakioka | Japan | ΔD and ΔI | Masami et al., 2005 |
| 3 | 19–24 June | 2006 | Belsk | Poland | ΔD and ΔI | Reda et al., 2007 |
| 4 | 09–18 June | 2008 | Boulder | United States | ΔD, ΔH and ΔZ | Love et al., 2009 |
| 5 | 13–23 September | 2010 | Changchun | China | ΔD and ΔI | He et al., 2011 |
| 6 | 05–08 June | 2012 | San Fernado | Spain | ΔD, ΔH and ΔZ | Hejda et al., 2013 |
Table 5
The list of the countries.
| No. | Country | No. | Country | No. | Country |
|---|---|---|---|---|---|
| 1 | Algeria | 14 | France | 27 | Poland |
| 2 | Argentina | 15 | Germany | 28 | Romania |
| 3 | Australia | 16 | Hungary | 29 | Russia |
| 4 | Austria | 17 | India | 30 | Samoa |
| 5 | Belgium | 18 | Indonesia | 31 | Slovakia |
| 6 | Bulgaria | 19 | Japan | 32 | South Africa |
| 7 | Canada | 20 | Kazakhstan | 33 | South Korea |
| 8 | China | 21 | Macedonia | 34 | Spain |
| 9 | Colombia | 22 | Maldives | 35 | Switzerland |
| 10 | Croatia | 23 | Mexico | 36 | Ukraine |
| 11 | Czech Republic | 24 | Mozambique | 37 | United Kingdom |
| 12 | Denmark | 25 | Pakistan | 38 | United States |
| 13 | Finland | 26 | Peru | 39 | Venezuela |
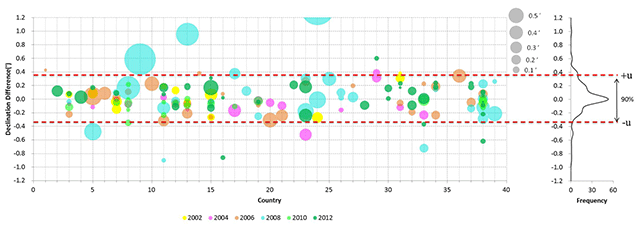
Figure 4
The difference of the declination of IAGA. The symbols have same meaning as those in Figure 2.
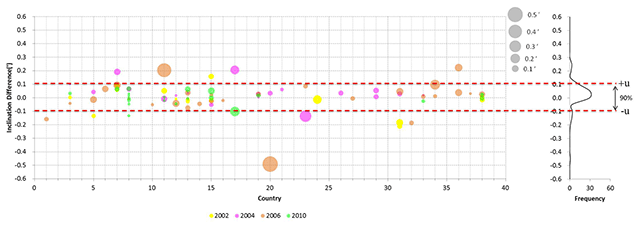
Figure 5
The difference of the inclination of IAGA. The symbols have same meaning as those in Figure 2.
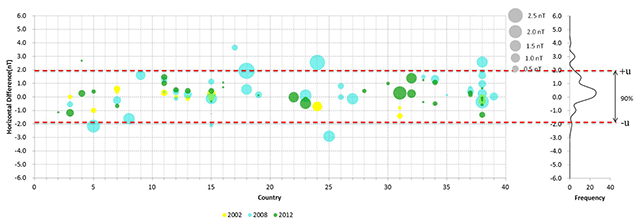
Figure 6
The difference of the horizontal intensity of IAGA. The symbols have same meaning as those in Figure 2.
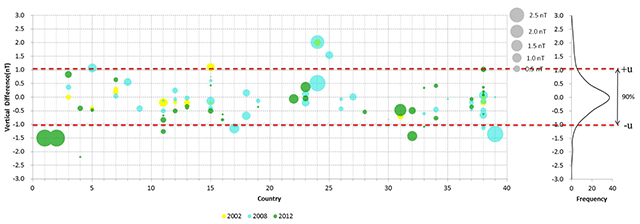
Figure 7
The difference of the vertical intensity of IAGA. The symbols have same meaning as those in Figure 2.