
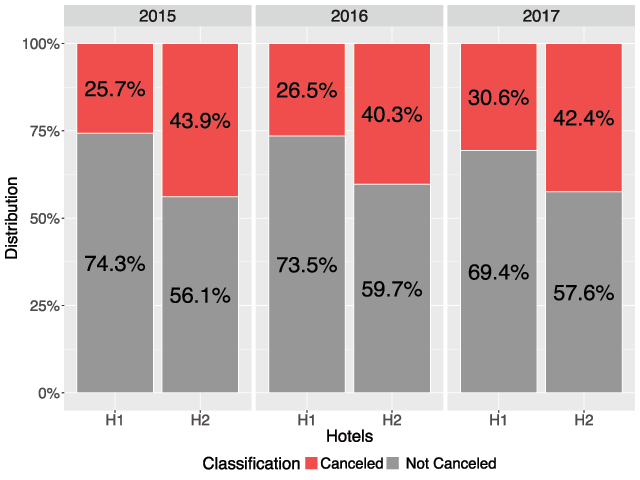
Figure 1
Cancellation ratio per year.
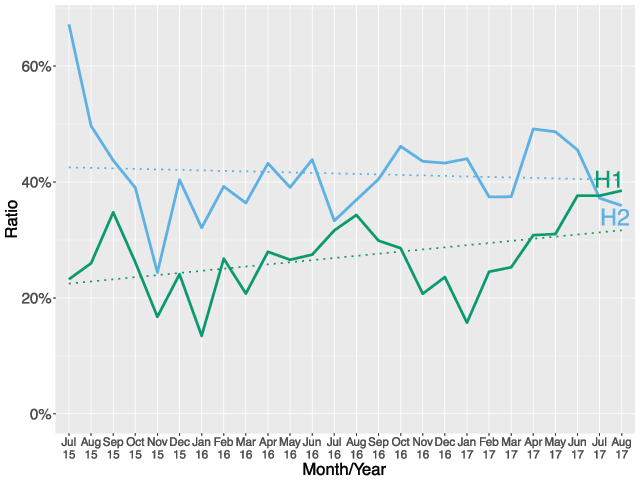
Figure 2
Cancellation ratio per month.
Table 1
Models’ estimation parameters selection source code.
| Parameter | R source code |
|---|---|
| colsample_bytree | runif(1, 0.4, 0.8) |
| eta | runif(1, 0.01, 0.3) |
| gamma | runif(1, 0, 0.2) |
| lambda | runif(1, 0, 0.5) |
| max_delta_step | sample(1:5, 1) |
| max_depth | sample(2:4, 1) |
| min_child_weight | sample(1:5, 1) |
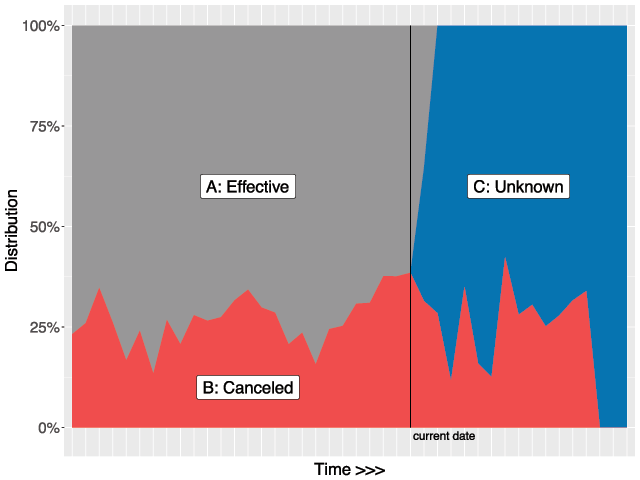
Figure 3
H1 bookings status at a moment in time.
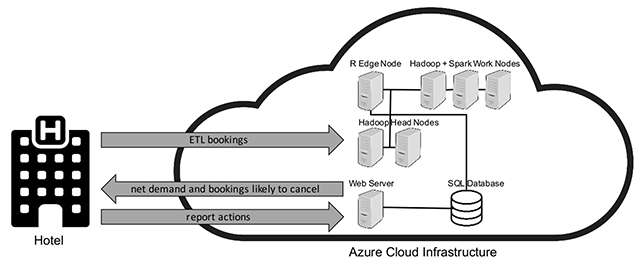
Figure 4
System architecture diagram.
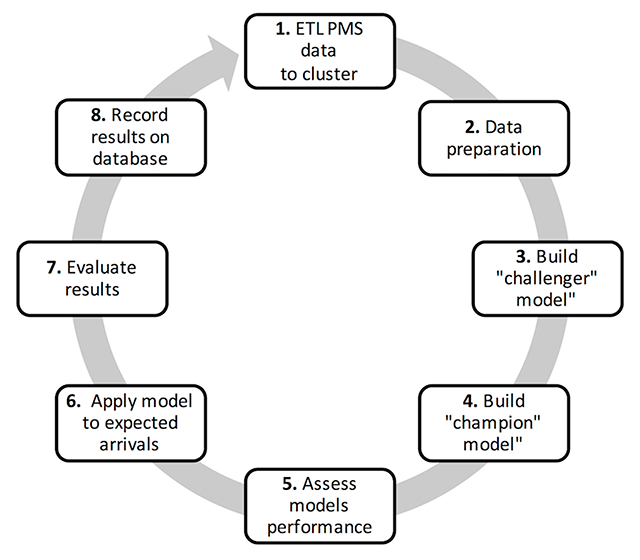
Figure 5
Daily automation cycle diagram.
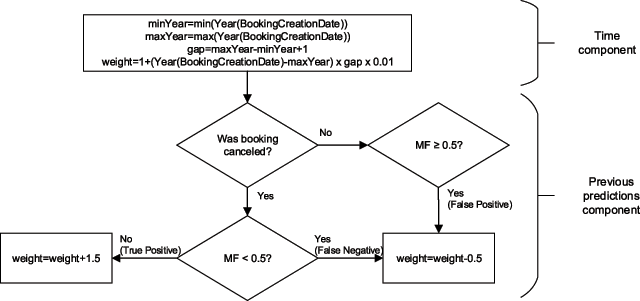
Figure 6
Observations weighting mechanism diagram.
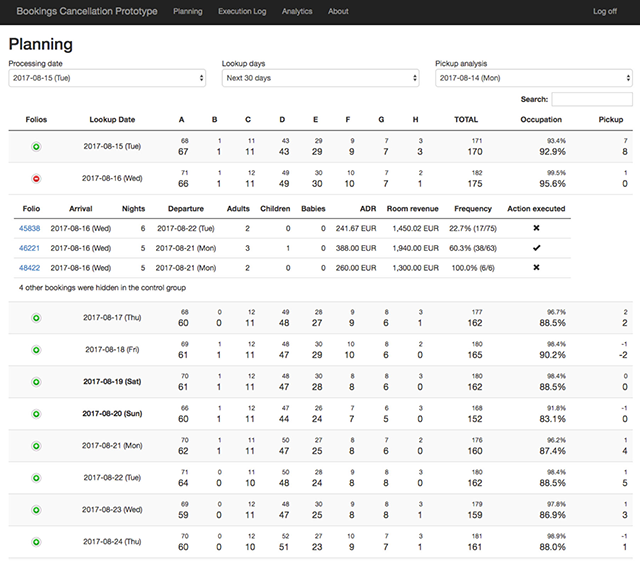
Figure 7
Prototype’s main screen – Planning.
Table 2
Performance metrics on the 31st of August 2017.
| Hotel | Dataset | Accuracy | Precision | F1Score | AUC | Sensitivity | Specificity |
|---|---|---|---|---|---|---|---|
| H1 | Train | 0.8646 | 0.8484 | 0.7410 | 0.9227 | 0.6577 | 0.9510 |
| Test | 0.8486 | 0.8205 | 0.7016 | 0.8864 | 0.6128 | 0.9452 | |
| H2 | Train | 0.8701 | 0.8849 | 0.8460 | 0.9438 | 0.8103 | 0.9171 |
| Test | 0.8563 | 0.8731 | 0.8274 | 0.9276 | 0.7862 | 0.9110 |
Table 3
A/B testing effective cancellation summary.
| Hotel | Group | Canceled | Not canceled | Total | % Canceled | Actions | % Actions |
|---|---|---|---|---|---|---|---|
| H1 | A | 486 | 1,489 | 1,975 | 24.6% | N/A | N/A |
| B | 483 | 1,526 | 2,009 | 24.0% | 109 | 5.4% | |
| H2 | A | 1,043 | 3,060 | 4,103 | 25.4% | N/A | N/A |
| B | 1,025 | 3,086 | 4,111 | 24.9% | 196 | 4.8% |
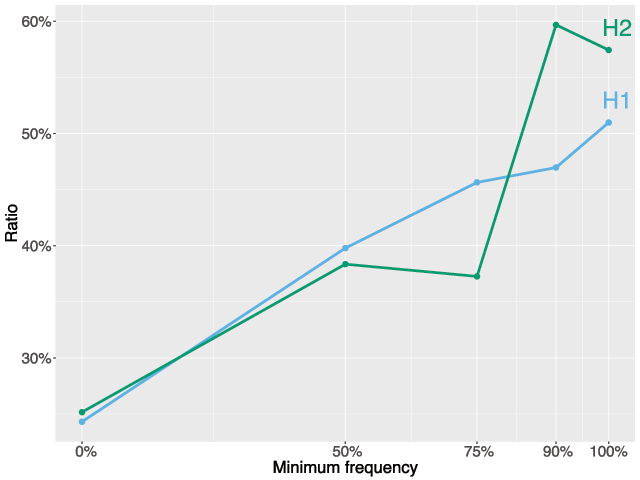
Figure 8
Cancellation ratio by minimum frequency.
Note: MF threshold levels were selected based on the users’ criteria to select the bookings to contact. The majority of time, users only selected bookings with a MF equal to or greater than 50%.
Table 4
“B” group cancellation results summary.
| Hotel | Action | MF ≥ 0% (all bookings) | MF ≥ 50% | ||||
|---|---|---|---|---|---|---|---|
| Canceled | Not canceled | % Canceled | Canceled | Not canceled | % Canceled | ||
| H1 | No | 471 | 1,429 | 24.8% | 125 | 153 | 45.0% |
| Yes | 12 | 97 | 11.0% | 6 | 70 | 7.9% | |
| H2 | No | 1,010 | 2,905 | 25.8% | 269 | 325 | 45.3% |
| Yes | 15 | 181 | 7.7% | 9 | 111 | 7.5% | |
Table A.1
Features description.
| Feature | Type | Description |
|---|---|---|
| ADRThirdQuartileDeviation | N, E | Ratio calculated by the division of the booking ADR by the third quartile value, of all bookings of the same distribution channel, same reserved room type, for the same expected week/year of arrival. |
| Adults | N, I | Number of adults |
| Agent | C, I | ID of agency (if booked via an agency) |
| Babies | N, I | Number of babies |
| BookingChanges | N, E | Heuristic created by summing the number of booking changes (amendments) prior to arrival that can indicate cancellation intentions (arrival or departure dates, number of persons, type of meal, ADR, or reserved room type) |
| Children | N, I | Number of children |
| Company | C, I | ID of company/corporation (if an account was associated with it) |
| CustomerType | C, E | Type of customer (group, contract, transient, or transient-party); this last category is a heuristic built when the booking is transient but is fully or partially paid in conjunction with other bookings (e.g., small groups, such as families who require more than one room) |
| DaysInWaitingList | N, I | Number of days the booking was on a waiting list prior to confirming the availability and being confirmed as a booking |
| DepositType | C, E | Since hotels had different cancellation and deposit policies, a heuristic was developed to define the deposit type (nonrefundable, refundable, no deposit): payment made in full before the arrival date was considered to be a “nonrefundable” deposit, and a partial payment before arrival was considered to be a “refundable” deposit; otherwise, it was considered to be “no deposit” |
| DistributionChannel | C, I | Distribution channel used to make the booking |
| IsRepeatedGuest | C, E | Binary value that indicates if the booking holder, at the time of booking creation, was a repeat guest at the hotel (0: no; 1: yes); created by comparing the time of booking with the guest profile creation record |
| LiveTime | N, E | Number of days from booking creation according to the booking status: for “A” type bookings, it was calculated as the number of days between booking creation and arrival; for “B” bookings, the elapsed number of days between the date of booking creation and the cancellation date was employed; for “C” bookings, the elapsed number of days between the date of creation and the processing date (current date) |
| MarketSegment | C, I | Market segment to which the booking was classified as |
| Meal | C, I | ID of meal requested by the guest |
| PreviousCancellationRatio | N, E | Ratio created by the division of the guest’s number of previous cancellations by the guest’s previous number of bookings at the hotel |
| StaysInWeekendNights | N, E | From the total length of stay, the number of weekend nights (Saturday and Sunday) |
| StaysInWeekNights | N, E | From the total length of stay, the number of weekday nights (Monday through Friday) |
| TotalOfSpecialRequests | N, E | Number of special requests (e.g., fruit basket and sea view) |
| WasInWaitingList | C, I | Binary value that indicates if the booking was entered on a waiting list or directly entered as a booking (0: normal booking; 1: waiting list); |
[i] Type legend: C- Categorical, E- Engineered, I-Input, N- Numerical.