
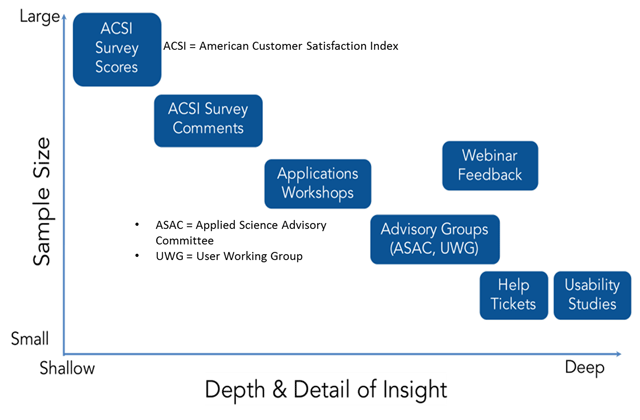
Figure 1
Sample size vs. depth and detail of insight in user feedback.
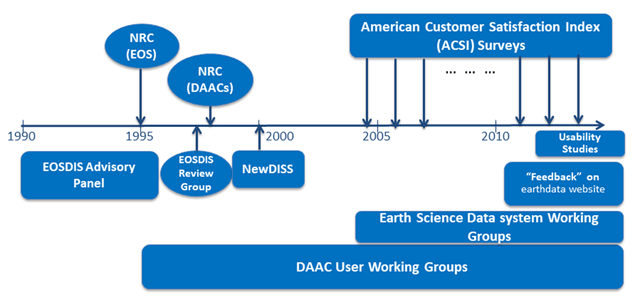
Figure 2
User feedback mechanisms over the life of EOSDIS. Arrows in the figure represent reports provided at specific times. Boxes with no arrows represent longer-term activities that have feedback throughout, with occasional formal reports. The boxes at the right end of the figure represent on-going mechanisms.