
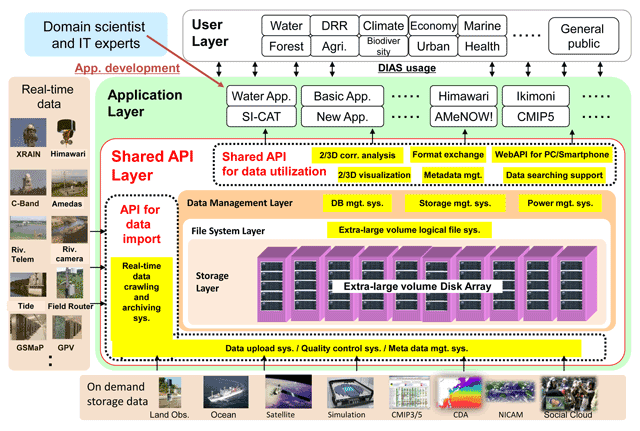
Figure 1
DIAS’s common base application platform.
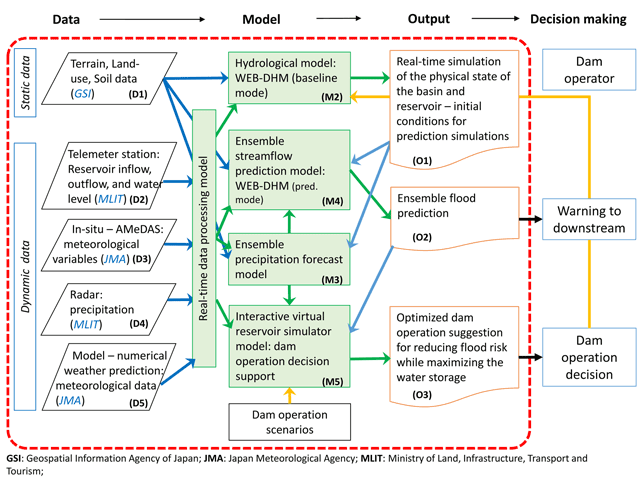
Figure 2
The schematic diagram of the DIAS flood prediction and flood-control dam operation optimization system. The red dashed line encompasses the system components. The column at left shows various types of data used by the system (D1–D5), the middle column shows individual model components (M1–M5), and the column at right depicts the system outputs (O1–O3). The arrows indicate the flow of data and information from the data source to the system (blue arrows), and between the system components (green arrows). The black arrows leading from the red box show the system output applications. The yellow arrows pointing back to the system components indicate interactive input from dam operators. The data flow and exchange between the components are assured by the DIAS system.
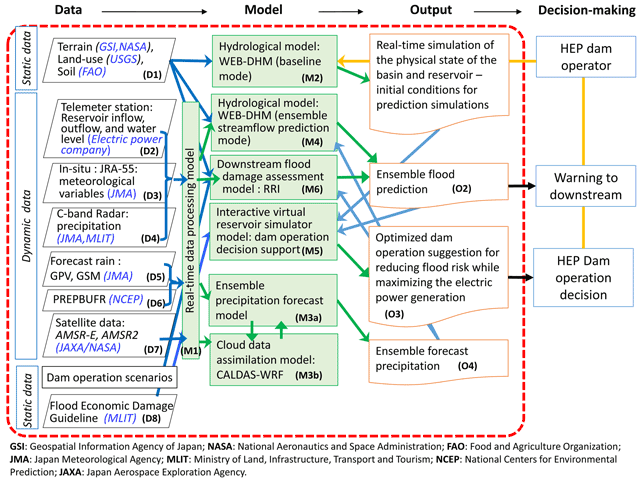
Figure 3
Hydroelectric power (HEP) dam operation schemes in Japan, aiming to reduce the risk of floods while improving power generation efficiency. The red dashed line encompasses the system components. The column at left shows various types of data used by the system (D1–D7), the middle column shows individual model components (M1–M6), and the column at right depicts the system outputs (O1–O3). The arrows indicate the flow of data and information from the data source to the system (blue arrows), and between the system components (green arrows). The black arrows leading from the red box show the system output applications. The yellow arrows pointing back to the system components indicate interactive input from dam operators. The data flow and exchange between the components are assured by the DIAS system.
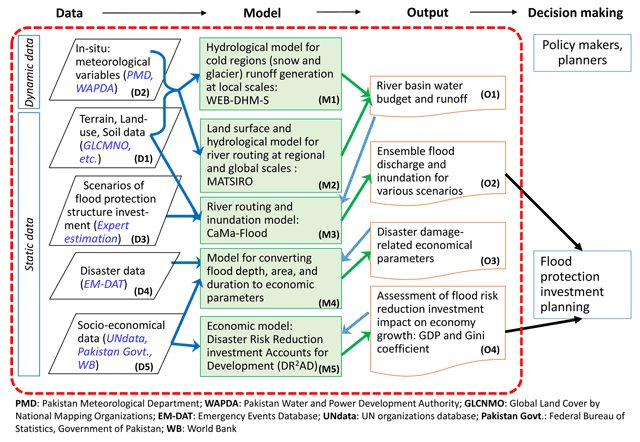
Figure 4
The schematic diagram of the flood-risk reduction investment for development system. The red dashed line encompasses the system components. The column at left shows various types of data used by the system (D1–D5), the middle column shows individual model components (M1–M5), and the column at right depicts the system outputs (O1–O4). The arrows indicate the flow of data and information from the data source to the system (blue arrows), and between the system components (green arrows). The black arrows leading from the red box show the system output applications. The data flow and exchange between the components are assured by the DIAS system.