
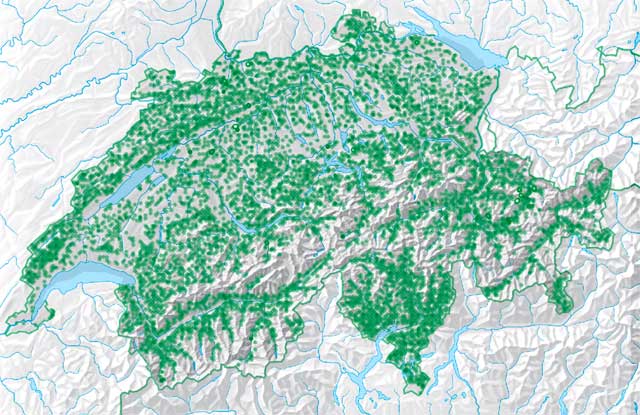
Figure 1
An overview (in green) of the spatial distribution of forest and snow data sets and experiments, known to be available at WSL, as identified by the EnviDat team in May 2018; background map based on data © 2007/2014/2016 swisstopo (JD100042).
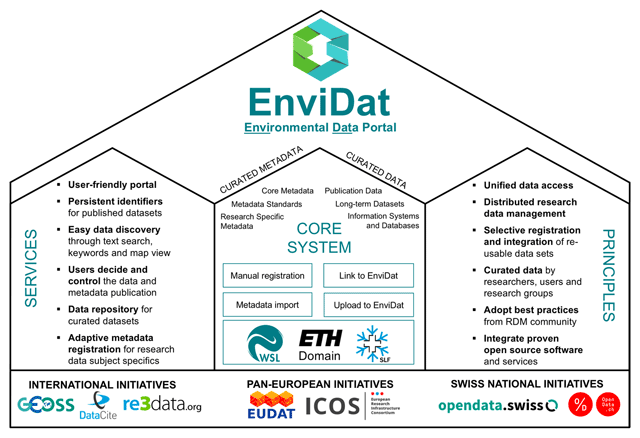
Figure 2
The EnviDat concept.
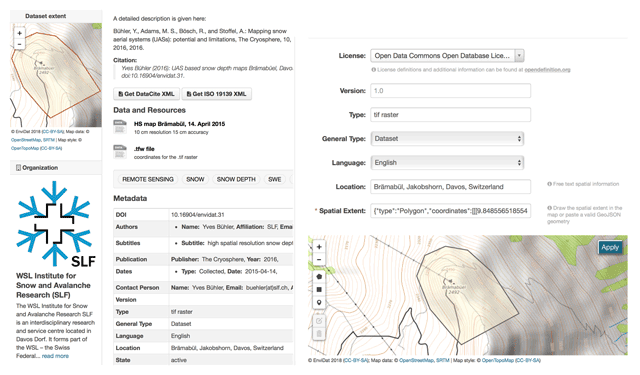
Figure 3
Example of increasing the user-friendliness of the EnviDat portal through the inclusion of several map-based graphical user interfaces.
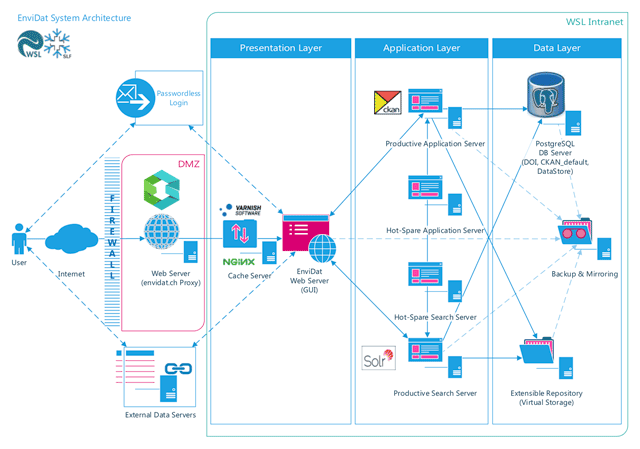
Figure 4
EnviDat three-tier system architecture containing clearly defined data management, application and presentation layers.
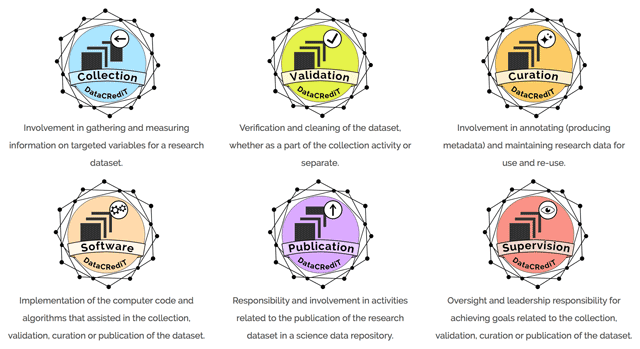
Figure 5
The Data Contributor Roles (DataCRediT) taxonomy of EnviDat.
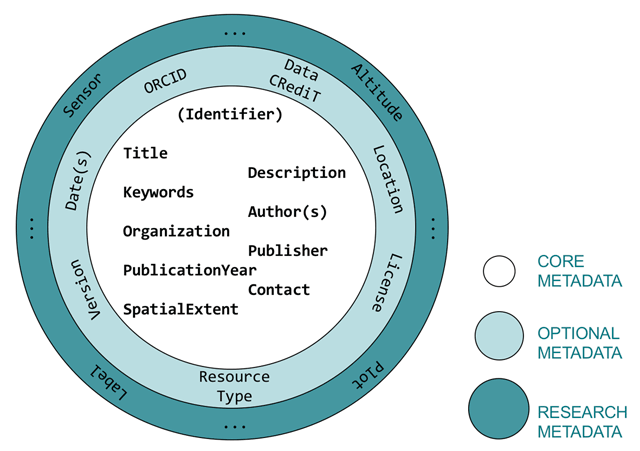
Figure 6
EnviDat three-layer metadata schema model.
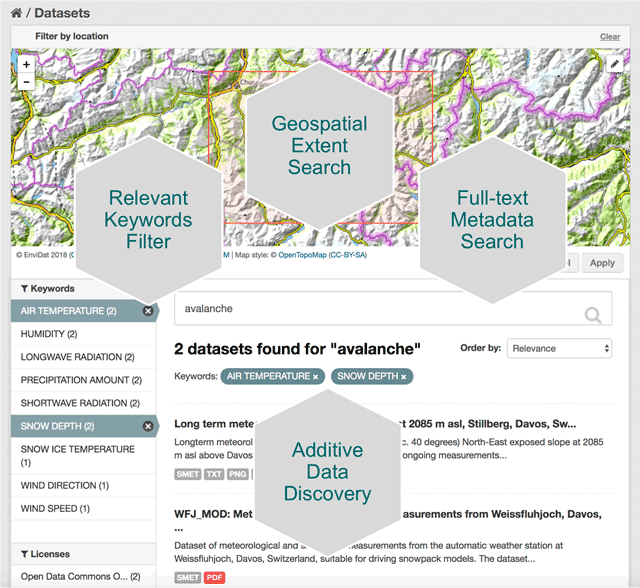
Figure 7
Additive data discovery as implemented in EnviDat, combining relevant keywords, geospatial extent and full-text metadata search.