
Table 1
Naming system used in VSHI database.
| #Example | Session | Person | Gender | Age | #Image | Filename |
|---|---|---|---|---|---|---|
| 1 | S1 | P25 | F | 50 | 3 | P25-F-50-S1 (3) |
| 2 | S1 | p14 | M | 14 | 1 | P14-M-14-S1 (1) |
| 3 | S2 | P35 | M | 35 | 3 | P35-M-35-S2 (3) |
| 4 | S2 | P15 | M | 14 | 1 | P15-M-14-S2 (1) |
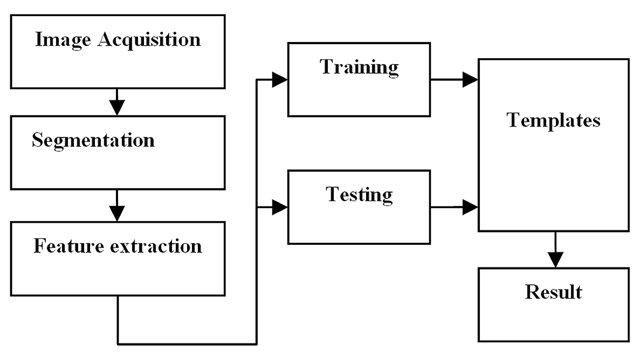
Figure 1
A typical hand shape biometric system.
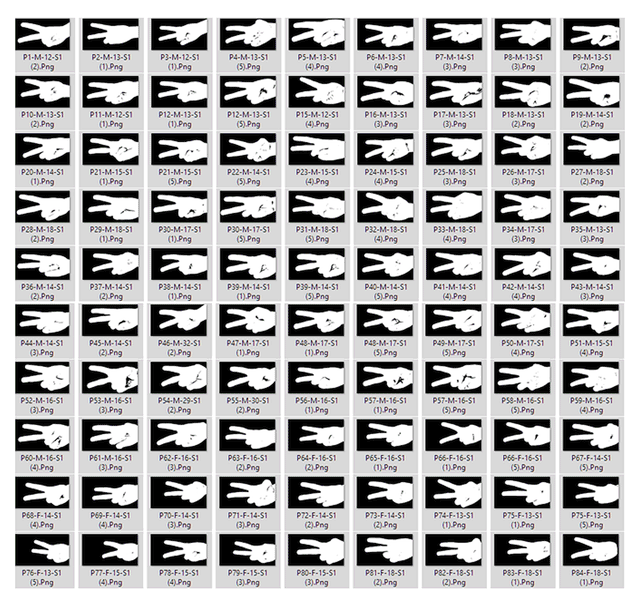
Figure 2
Sample segmentation of hand image for different subjects P1 to P84.
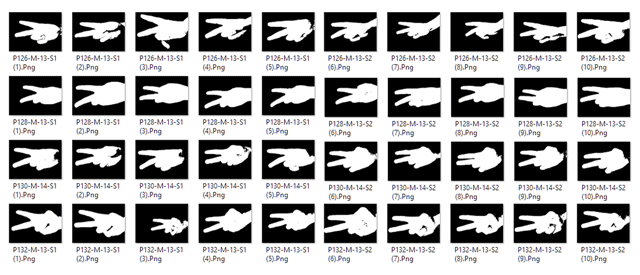
Figure 3
Samples of hand segmentations for the same subjects from both sessions.
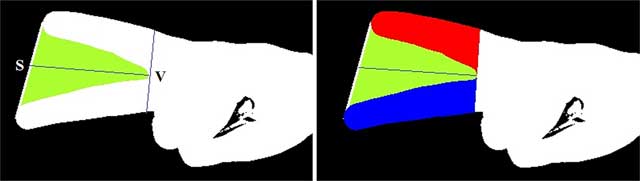
Figure 4
Shows example of fingers’ segmentation, point (S) the midpoint of the line between fingers’ tips, and V is the valley point from Algorithm (2).

Figure 5
Each zone represents the summation of the distances of the contour points to the regression line (sub-area of the finger).
Table 2
Results of identifying subjects from both sessions using Hu method (16 features) with different classifiers.
| Classifier | Hu on S1 | Hu on S2 | ||||
|---|---|---|---|---|---|---|
| Precision | Recall | F1 | Precision | Recall | F1 | |
| KNN | 0.790 | 0.797 | 0.793 | 0.826 | 0.825 | 0.825 |
| Naive Bayes | 0.796 | 0.669 | 0.727 | 0.834 | 0.696 | 0.759 |
| SVM | 0.012 | 0.011 | 0.011 | 0.032 | 0.026 | 0.029 |
| ANN | 0.778 | 0.762 | 0.770 | 0.821 | 0.826 | 0.823 |
| Random Forest | 0.765 | 0.775 | 0.770 | 0.811 | 0.813 | 0.812 |
| LDA | 0.829 | 0.828 | 0.828 | 0.881 | 0.878 | 0.879 |
Table 3
Identification results using LDA classifier on features extracted by HSD with different number of bins.
| #bins | S1 | S2 | Average |
|---|---|---|---|
| 5 | 69.30 | 71.60 | 70.45 |
| 6 | 76.00 | 77.20 | 76.60 |
| 7 | 80.55 | 81.30 | 80.93 |
| 8 | 82.50 | 82.80 | 82.65 |
| 9 | 84.15 | 84.47 | 84.31 |
| 10 | 84.66 | 84.80 | 84.73 |
| 11 | 84.50 | 84.27 | 84.39 |
| 12 | 84.35 | 85.40 | 84.88 |
| 13 | 85.40 | 83.55 | 84.48 |
| 15 | 83.10 | 83.65 | 83.38 |
| 20 | 77.60 | 78.25 | 77.93 |
| 30 | 69.75 | 69.95 | 69.85 |
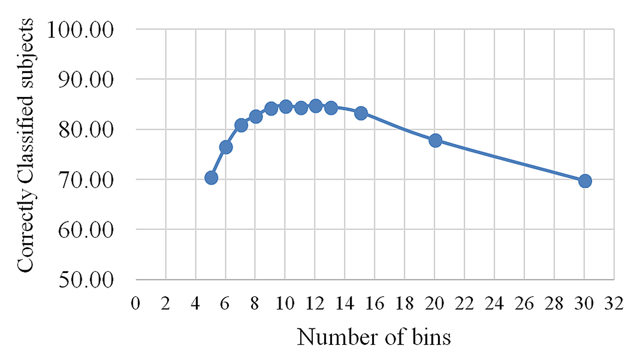
Figure 6
Average of correctly classified subjects using HSD.
Table 4
Identification results using different classifiers on features extracted by HSD with 10 bins (40 features).
| Classifier | Hu on S1 | Hu on S2 | ||||
|---|---|---|---|---|---|---|
| Precision | Recall | F1 | Precision | Recall | F1 | |
| KNN | 0.412 | 0.414 | 0.413 | 0.414 | 0.424 | 0.419 |
| Naive Bayes | 0.586 | 0.361 | 0.447 | 0.609 | 0.379 | 0.467 |
| SVM | 0.078 | 0.06 | 0.068 | 0.059 | 0.048 | 0.053 |
| ANN | 0.534 | 0.557 | 0.545 | 0.567 | 0.583 | 0.575 |
| Random Forest | 0.493 | 0.512 | 0.502 | 0.505 | 0.529 | 0.517 |
| LDA | 0.843 | 0.847 | 0.845 | 0.847 | 0.848 | 0.847 |
Table 5
Identification results using LDA classifier on features extracted by both Hu and HSD with 10 bins (56 features).
| Preprocess | Hu + HSD on S1 | Hu + HSD on S2 | Hu + HSD on S1 & S2 | ||||||
|---|---|---|---|---|---|---|---|---|---|
| Precision | Recall | F1 | Precision | Recall | F1 | Precision | Recall | F1 | |
| – | 0.906 | 0.91 | 0.908 | 0.88 | 0.876 | 0.878 | 0.942 | 0.937 | 0.939 |
| Normalization | 0.951 | 0.949 | 0.950 | 0.931 | 0.927 | 0.929 | 0.966 | 0.963 | 0.964 |
| PCA(0.95) | 0.866 | 0.867 | 0.866 | 0.841 | 0.839 | 0.840 | 0.899 | 0.894 | 0.896 |
| PCA(0.97) | 0.899 | 0.898 | 0.898 | 0.868 | 0.864 | 0.866 | 0.925 | 0.92 | 0.922 |
| PCA(0.98) | 0.909 | 0.909 | 0.909 | 0.89 | 0.885 | 0.887 | 0.932 | 0.929 | 0.930 |
| PCA(0.99) | 0.922 | 0.923 | 0.922 | 0.902 | 0.897 | 0.899 | 0.95 | 0.944 | 0.947 |