
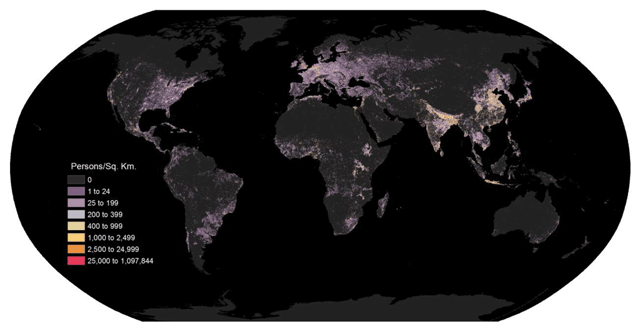
Figure 1
Global coverage of the WPE as a map of population density where raster cells on land represent a dasymetric surface. The populated cells are represented with an estimated density in units of persons per square kilometer.
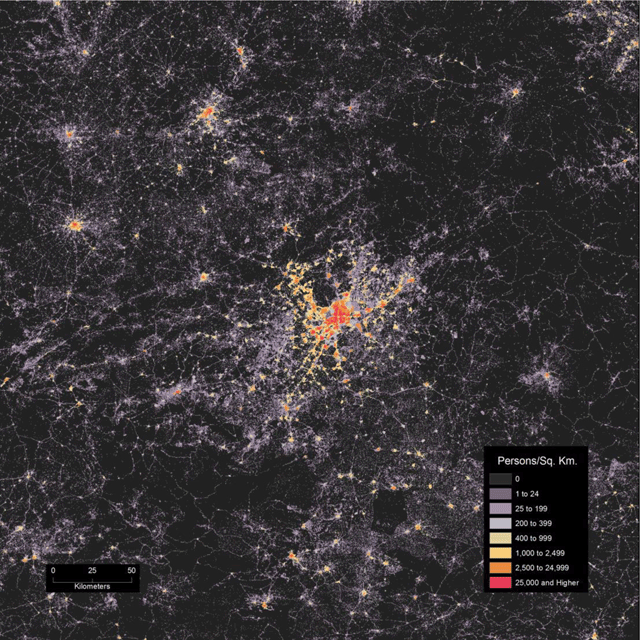
Figure 2
Madrid, Spain, and the surrounding territory representing the 162-meter raster resolution of the 2015 WPE.
Table 1
Land cover classes in BaseVue 2013. In particular, note the urban classes have a high requirement for infrastructure, which inherently excludes cells at the edges of urbanization or rural settlements such as farming villages.
| Class | Class Name | Description |
|---|---|---|
| 1 | Deciduous Forest | Trees > 3 meters in height, canopy closure > 35% (<25% intermixture with evergreen species) that seasonally lose their leaves, except larch |
| 2 | Evergreen Forest | Trees > 3 meters in height, canopy closure > 35% (<25% intermixture with deciduous species), of species that do not lose leaves (will include coniferous larch regardless of deciduous nature) |
| 3 | Scrub/Shrub | Woody vegetation < 3 meters in height, > 10% ground cover. Only collect > 30% ground cover. |
| 4 | Grassland | Herbaceous grasses, > 10% cover, including pastureland. Only collect > 30% cover. |
| 5 | Barren or Minimal Vegetation | Land with minimal vegetation (<10%) including rock, sand, clay, beaches, quarries, strip mines, and gravel pits. Salt flats, playas, and non-tidal mud flats are also included when not inundated with water. |
| 7 | Agriculture, General | Cultivated cropland |
| 8 | Agriculture, Paddy | Cropland characterized by inundation for a substantial portion of the growing season |
| 9 | Wetland | Areas where the water table is at or near the surface for a substantial portion of the growing season, including herbaceous and woody species (except mangrove species) |
| 10 | Mangrove | Coastal (tropical wetlands) dominated by mangrove species |
| 11 | Water | All water bodies greater than 0.08 hectares (1 LS pixel) including oceans, lakes, ponds, rivers, and streams |
| 12 | Ice/Snow | Land areas covered permanently or nearly permanently with ice or snow |
| 13 | Clouds | Areas where no land cover interpretation is possible due to obstruction from clouds, cloud shadows, smoke, haze, or satellite malfunction |
| 14 | Woody Wetlands | Areas where forest or shrubland vegetation accounts for greater than 20% of vegetative cover and the soil or substrate periodically is saturated with or covered by water. Only used within the continental U.S. |
| 15 | Mixed Forest | Areas dominated by trees generally greater than 5 meters tall and greater than 20% of total vegetation cover. Neither deciduous nor evergreen species are greater than 75% of total tree cover. Only used within the continental U.S. |
| 20 | High Density Urban | Areas with over 70% of constructed materials that are a minimum of 60 meters wide (asphalt, concrete, buildings, etc.). Includes residential areas with a mixture of constructed materials and vegetation, where constructed materials account for > 60%. Commercial, industrial, and transportation, e.g., train stations, airports. |
| 21 | Medium-Low Density Urban | Areas with 30% to 70% of constructed materials that are a minimum of 60 meters wide (asphalt, concrete, buildings, etc.). Includes residential areas with a mixture of constructed materials and vegetation, where constructed materials account for greater than 40%. Commercial, industrial, and transportation, e.g., train stations, airports. |
Table 2
On the left are the BaseVue 2013 class identifiers and names, and on the right the initial remapping of BaseVue classes into settlement likelihood scores.
| Class ID | Class Name | Modeled Population Likelihood Score and Rationale |
|---|---|---|
| 1 | Deciduous Forest | 25—Potentially Orchard Agriculture |
| 2 | Evergreen Forest | 0 |
| 3 | Scrub/Shrub | 0 |
| 4 | Grassland | 25—Potentially Range/Pasture Agricultural Land |
| 5 | Barren or Minimal Vegetation | 0 |
| 7 | Agriculture, General | 25 |
| 8 | Agriculture, Paddy | 25 |
| 9 | Wetland | 0 |
| 10 | Mangrove | 0 |
| 11 | Water | 0 |
| 12 | Ice/Snow | 0 |
| 13 | Clouds | 0 |
| 14 | Woody Wetlands | 0 |
| 15 | Mixed Forest | 0 |
| 20 | High Density Urban | 200 |
| 21 | Medium-Low Density Urban | 150 |
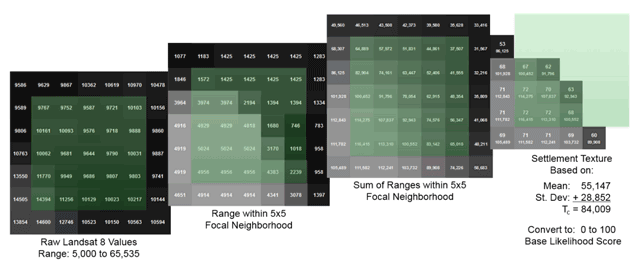
Figure 3
Main processing steps, starting with the Landsat8 panchromatic imagery; then range of values in a 5 × 5 cell neighborhood; then the sum of ranges; and finally, the cells with sums above the threshold for settlement texture score and their value once normalized.
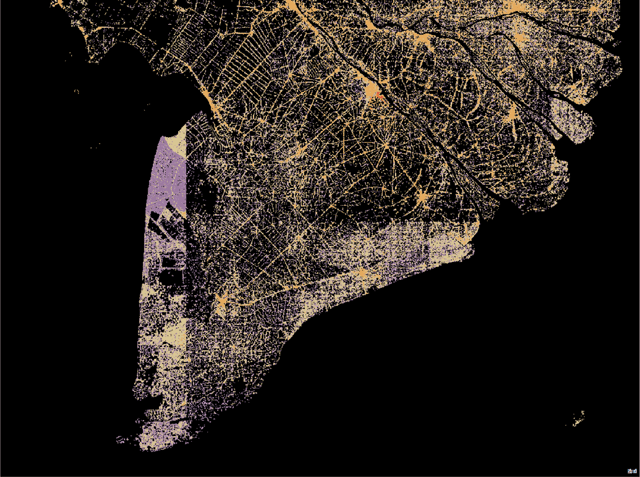
Figure 4
On the southern coast of Cambodia, a clear indication of the extents of the 0.5 degree processing grid can be seen.