
Table 1
Comparison of expenditure data in the three reports (in millions of Mozambican meticaisa).
| Report Data included in the report | 2010 | 2011 | 2012 | 2013 |
|---|---|---|---|---|
| Total Expenditures | ||||
| LOE | ||||
| Budget [1] | 117,977 | 132,403 | 163,035 | 174,955 |
| REOb | ||||
| Initial budget allocation [2] | 117,977 | 132,403 | 163,035 | 174,955 |
| Current budget [3] | 117,977 | 141,757 | 163,035 | 194,873 |
| Realised expenditures [4] | 107,710 | 131,248 | 139,838 | 180,988 |
| CGE | ||||
| Initial budget allocation [5] | 117,977 | 132,403 | 163,035 | 174,955 |
| Final budget allocation [6] | 117,977 | 141,757 | 163,035 | 196,372 |
| Realised expenditures [7] | 109,820 | 125,932 | 144,590 | 190,564 |
| Execution rate [7]/[1] | 93.09% | 95.11% | 88.69% | 108.92% |
| Agriculture expenditures | ||||
| LOE | ||||
| Budget [8] | 6,177 | 6,396 | 5,155 | 8,124 |
| Agriculture (adm. code 35) | 4,694 | 3,781 | 4,057 | 6,832 |
| Fisheries (adm. code 37) | 1,483 | 2,615 | 1,098 | 1,292 |
| REOb | ||||
| Final budget allocation [9] | 5,210 | 7,742 | 6,104 | 6,633 |
| Budget execution [10] | 4,045 | 4,013 | 3,817 | 4,938 |
| CGE | ||||
| Final budget allocation [11] | 5,703 | 5,666 | 5,420 | 6,331 |
| Realised expenditures [12] | 4,283 | 4,092 | 3,906 | 5,045 |
| Execution rate [12]/[8] | 69.34% | 63.98% | 75.77% | 62.10% |
| Ag+Fisheries/Total [12]/[7] | 3.90% | 3.25% | 2.70% | 2.65% |
[i] Notes: a Unless otherwise indicated. b Cumulative data from the fourth quarter report.
Table 2
Classifiers available on e-SISTAFE.
| Classifier | Objectives/description |
|---|---|
| Functional | Organises public spending based on the purpose underlying the expenditures. The functional classification is based on the internationally developed Classification of the Functions of Government (COFOG), in use by the United Nations, the International Monetary Fund, and the Organisation for Economic Co-operation and Development (OECD), among other international organisations. This classifier categorises public spending into, for example, health, education, defence, etc. |
| Administrative | Identifies the government body or institution responsible for budget formulation and execution. Administrative classification organises public spending, for example, in spending undertaken by the ministry of agriculture, ministry of public works, the president’s office, etc. |
| Economic | Allows identification of the economic nature or type of the expenditure. Like the functional classification, international standards have also been developed for the economic classification. The two broad categories are recurrent and capital spending, within recurrent spending are salaries, expenses on goods and services, subsidies to stakeholders, etc. |
| Programmatic | Expresses public expenditures in terms of the government’s programmatic objectives, goals, and outcomes to be achieved. Components of expenditures by this classification often map directly into specific governmental policies. Examples are spending on: good governance, poverty reduction, combatting HIV/AIDS, etc. |
| Territorial | Allows registration of expenditure according to the territorial division of the country (central, provincial and district, and allocation to each jurisdiction at the provincial and district levels). |
| Priority sectors | Is used according to Mozambique’s Government Five-Year Plan and its Poverty Reduction Strategy. |
| Currency | Used for coding of the currency used by donor and lenders of the state. |
| Budget unit | Identifies the state body or institution responsible for budget formulation and execution. This is very similar to, though not identical with, the administrative classification. |
| Budget coverage | Classifies according to the legal administration of the institution. Its main objective is to comprehensively incorporate all the central government and subnational institutions as well as state enterprises. |
| Sectoral | Is an extension of the programmatic classifier. It details the actions that are part of sectoral, provincial, or local plans. |
| Sectional | Is an extension of the sectoral classifier. It details the actions need to be implemented by a cost centre. |
| Management | Allows for individual accounts as defined by SISTAFE law: public institutions, autonomous institutions, municipalities, and state companies. |
| Financial status | Identifies the financial status according to its financial and administrative autonomy. |
[i] Note: e-SISTAFE = Sistema Electrónico de Administração Financeira do Estado (Mozambique’s integrated financial management information system).
Table 3
Administrative classification of the Ministry of Agriculture and Ministry of Fisheries, up to the four-digit level of the 2012 coding system.
| Until 2012 [2] | As of 2013 [3] | ||
|---|---|---|---|
| Ministry of Agriculture | 35 | 35 | |
| Ministry of Agriculture | 3501 | 35A | 00 0141 |
| Food and Nutritional Security Technical Secretariat | 3503 | 35A | 00 1541 |
| National Institute of Irrigation | 3505 | 35A | 00 5041 |
| Provincial Directorate of Agriculture | 3521(01–11) | 35(B-L) | 00(0141/2141)a |
| Cotton Institute delegation | 3522 | 35(C-I) | 00 1941 |
| Delegation of the National Cashew Institute | 3528 | 35(C-K) | 00 2041 |
| Provincial Delegation of Agriculture Promotion | 3529 | 35(D-J) | 00(1241/1341/1541) |
| Mozambique Cotton Institute | 3581 | 35A | 00 1641 |
| National Cashew Institute | 3582 | 35A | 00 2141 |
| Agrarian Research Institute of Mozambique | 3586 | 35A | 00 3641 |
| Agriculture Promotion Centre | 3590 | 35A | 00 4341 |
| Training Institute on Land and Cartography Administration | 3591 | 35A | 00 3341 |
| National Centre for Cartography and Remote Sensing | 3592 | 35A | 00 4841 |
| Agricultural Development Fund | 3593 | 35A | 00 4941 |
| Ministry of Fisheries | 37 | 37 | |
| Ministry of Fisheries | 3701 | 37A | 00 0141 |
| National Board of Fisheries | 3702 | 37A | 00 0641 |
| School of Fisheries | 3707 | 37A | 00 0541 |
| Provincial Fisheries | 3721 | 37(B-K) | 00 0141 |
| Delegations of National Aquaculture Development | 3726 | 37(B-G) | 00 0341 |
| Fisheries Development Fund | 3781 | 37A | 00 0841 |
| National Institute for Fisheries Research | 3782 | 37(A-K) | 00(1241/0541) |
| National Institute for Development of Small-Scale Fisheries | 3783 | 37(A-K) | 00(0941/2041) |
| National Institute of Fish Inspection | 3784 | 37(A-K) | 00(1141/0441) |
| National Institute of Aquaculture Development | 3786 | 37A | 00 1041 |
[i] a Here, and analogously elsewhere in this table, ‘35(B-L) 00(0141/2141)’ means that, depending on the province in question, the code may be 35B00 0141 or 35B00 0141 for the Niassa or the Cabo Delgado Provincial Ministry of Agriculture, respectively, etc. Furthermore, the code for the central or provincial mother ministry of agriculture changed, so that depending on the year, for example, Niassa’s provincial mother ministry of agriculture was coded either as 35B00 0141 or 35B00 2141.
Table 4
Public expenditures on agriculture in 2013, by administrative classification (in millions of Mozambican meticaisa).
| Administrative classifierb | LOE [1] | REO realloc. [2] | REO exec. [3] | CGE realloc. [4] | CGE realised [5] | Execution rate [5]/[1] | |
|---|---|---|---|---|---|---|---|
| 35 | Ministry of Agriculture | 6,832 | 5,418 | 3,998 | 5,012 | 4,111 | 60.2% |
| 3501 | Ministry of Agriculture | 1,516 | 1,710 | 1,343 | 1,508 | 1,371 | 90.4% |
| 3503 | Food and Nutritional Security Technical Secretariat | 15 | 13 | 13 | 17 | 17 | 113.3% |
| 3505 | National Institute of Irrigation | 33 | 0 | 0 | 38 | 29 | 87.9% |
| 3521 | Provincial Directorate of Agriculture | 1,137 | 1,270 | 1,029 | 1,428 | 1,097 | 96.5% |
| 3522 | Cotton Institute Delegation | 28 | 22 | 20 | 21 | 21 | 75.0% |
| 3528 | Delegation of the Cashew Institute | 101 | 99 | 95 | 98 | 98 | 97.0% |
| 3529 | Provincial Delegation of Agriculture Promotion | 29 | 28 | 27 | 27 | 27 | 93.1% |
| 3581 | Mozambique Cotton Institute | 187 | 182 | 179 | 180 | 179 | 95.7% |
| 3582 | National Cashew Institute | 161 | 126 | 71 | 200 | 71 | 44.1% |
| 3586 | Agrarian Research Institute of Mozambique | 319 | 477 | 149 | 299 | 145 | 45.5% |
| 3590 | Agriculture Promotion Centre | 261 | 264 | 133 | 159 | 134 | 51.3% |
| 3591 | Training Institute on Land and Cartography Administration | 29 | 26 | 25 | 25 | 25 | 86.2% |
| 3592 | National Centre for Cartography and Remote Sensing | 89 | 84 | 51 | 48 | 48 | 53.9% |
| 3593 | Agricultural Development Fund | 2,929 | 1,118 | 862 | 961 | 848 | 29.0% |
| 37 | Ministry of Fisheries | 1,292 | 1,215 | 940 | 1,318 | 934 | 72.3% |
| 3701 | Ministry of Fisheries | 175 | 227 | 201 | 220 | 201 | 114.9% |
| 3702 | National Board of Fisheries | 66 | 73 | 63 | 74 | 63 | 95.5% |
| 3707 | School of Fisheries | 30 | 31 | 29 | 54 | 29 | 96.7% |
| 3721 | Provincial Fisheries | 105 | 110 | 108 | 46 | 46 | 43.8% |
| 3726 | Delegations of National Aquaculture Development | 19 | 56 | 21 | 45 | 10 | 52.6% |
| 3781 | Fisheries Development Fund | 148 | 200 | 178 | 175 | 163 | 110.1% |
| 3782 | National Institute for Fisheries Research | 120 | 137 | 103 | 132 | 107 | 89.2% |
| 3783 | National Institute for Development of Small-Scale Fisheries | 463 | 174 | 111 | 365 | 187 | 40.4% |
| 3784 | National Institute of Fish Inspection | 96 | 94 | 73 | 93 | 75 | 78.1% |
| 3786 | National Institute of Aquaculture Development | 71 | 113 | 51 | 113 | 51 | 71.8% |
| Agriculture + Fisheries | 8,124 | 6,633 | 4,938 | 6,331 | 5,045 | 62.1% | |
[i] Notes: a Unless otherwise indicated. b This table references the administrative coding system that was in place through 2012, although the coding system subsequently changed effective 2013 (for further details on this change, see Table 3). The previous coding structure is used here for easier subsequent comparison with the data in Table 10.
Table 5
Economic classification, up to the three-digit code level.
| Code | Description | Code | Description |
|---|---|---|---|
| 1 | Current Expenditure | 2 | Capital Expenditure |
| 11 | Personnel costs | 21 | Capital goods |
| 111 | Wages and salaries | 211 | Construction |
| 112 | Other staff costs | 212 | Machinery, equipment, and furniture |
| 12 | Goods and services | 213 | Means of transport |
| 121 | Goods | 214 | Other capital goods |
| 122 | Services | 22 | Capital transfers |
| 13 | Debt burden | 221 | Capital transfers to public administrations |
| 14 | Current transfers | 222 | Capital transfers private administrations |
| 141 | Current transfers to public administrations | 223 | Capital transfers to households |
| 142 | Current transfers to private administrations | 224 | Other capital transfers |
| 143 | Current transfers to households | 23 | Financial operations |
| 144 | Current transfers abroad | 231 | Active financial operations |
| 15 | Subsidies | 232 | Passive financial operations |
| 16 | Years ended | 24 | Other expenses of capital |
| 161 | Pay back | ||
| 162 | Back payments of goods and services | ||
| 163 | Pension retroactive | ||
| 164 | Other payments for six-month periods ended | ||
| 17 | Other current expenditure |
Table 6
Agriculture and fisheries public expenditure in 2013 by economic classification and operational/investment distinction (in millions of Mozambican meticais).
| Operational/investment categorisation and economic classifier (categories) | LOE [6] | CGE realloc. [7] | CGE realised [8] | Execution rate [7]/[6] |
|---|---|---|---|---|
| Operational category (funcionamento) | 1,760 | 1,662 | 1,388 | 78.9% |
| Staff expenses | 1,004 | 957 | 914 | 91.0% |
| Good and services | 671 | 615 | 422 | 62.9% |
| Current transfers | 83 | 73 | 37 | 44.6% |
| Capital goods | 2 | 2 | 1 | 50.0% |
| Others | 0 | 15 | 14 | n/a |
| Investment category (investimento)a | 6,364 | 4,669 | 3,657 | 57.5% |
| Total | 8,124 | 6,331 | 5,045 | 62.1% |
Table 7
Agricultural public expenditures (CGE realised expenditure), by functional classification level 4 (in millions of Mozambican meticais).
| Code | Description | 2010 | 2011 | 2012 | 2013 |
|---|---|---|---|---|---|
| 04211 | Land managementa | 0 | |||
| 04212 | Agrarian reform | 5 | 24 | 45 | 13 |
| 04213 | Prices and agricultural productivity | 3 | 4 | ||
| 04214 | Rural extension | 63 | 158 | 107 | 405 |
| 04215 | Veterinary | 89 | 96 | 66 | 61 |
| 04216 | Pest control | 40 | 25 | 52 | |
| 04219 | Other services NEC | 297 | 275 | 226 | 166 |
| 04221 | Forestry | 11 | |||
| 04231 | Fishing | 603 | 470 | 546 | 614 |
| 04232 | Huntinga | 0 | |||
| 04241 | Livestock | 38 | 18 | 6 | 6 |
| 04251 | Irrigation | 260 | 301 | 223 | 398 |
| 04291 | Agriculture, forestry, fishing, and hunting NEC | 2,105 | 2,017 | 1,894 | 2,972 |
| 042 | Agriculture, forestry, fishing, and hunting | 3,502 | 3,386 | 3,124 | 4,687 |
[i] Notes: NEC = not elsewhere classified. a Zero in 2010 in Land Management and Hunting are positive values rounded. The actual numbers are 0.072 MMT and 0.215 MMT respectively.
Table 8
Programmatic classification categories.
| OCPQG Code | AE Code | AE Description |
|---|---|---|
| BGD | AAE | Administration of State Apparatus |
| BGD | DAL | Decentralisation and Development of Local Government |
| BGD | ICS | Information and Media |
| BGD | OST | Order, Public Safety and Tranquillity |
| BGD | RSJ | Reform of the Justice Sector |
| BGD | RSP | Public Sector Reform |
| CPD | DMC | Democracy |
| CPD | DMG | Demining |
| CPD | UNI | National Unity |
| DEC | AGR | Agriculture, Fishery, Forestry and Livestock |
| DEC | AMB | Environment |
| DEC | COM | Trade |
| DEC | DIE | Development of Infrastructure |
| DEC | DRU | Rural Development |
| DEC | GMD | Macroeconomic Management and Financial Systems Development |
| DEC | IND | Industry |
| DEC | PAI | Promotion and Attraction of Investment |
| DEC | PES | Fishery |
| DEC | RCM | Mineral Resources |
| DEC | THE | Work, Health and Safety and Employment |
| DEC | TRC | Transport and Communications |
| DEC | TUR | Tourism |
| DHS | AGS | Water and Sanitation |
| DHS | CTI | Science, Technology and Innovation |
| DHS | CUL | Culture |
| DHS | DPT | Sports |
| DHS | EDU | Education |
| DHS | HAB | Housing |
| DHS | HIV | HIV and AIDS |
| DHS | JUV | Youth |
| DHS | LDD | National Liberation and Defence of Sovereignty and Democracy and the War-Disabled—Demobilisation |
| DHS | MAS | Women, Family, and Social Action |
| DHS | SAU | Health |
| RCI | REX | External Relations |
| RDS | DSN | Defence of National Sovereignty |
Table 9
LOE 2013 Agricultural budget, by programmatic classification (in million Mozambican Meticais).
| Level | Code | Description | 2010 | 2011 | 2012 | 2013 |
|---|---|---|---|---|---|---|
| OCPQG Objective | DECa | Combating poverty and promoting the culture of work – economic development | 38,580 | 50,371 | 69,305 | 61,427 |
| Strategic Area (AE) | DEC-AGR | Agriculture, livestock, forestry and wildlife | 3,163 | 2,731 | 3,019 | 5,436 |
| Strategic Subarea (SAE) | DEC-AGR-00 | Agriculture, livestock, forestry and wildlife | 2,207 | 2,731 | 3,019 | 5,436 |
| DEC-AGR-00-AGR01 | Administrative institutional support | 68 | 353 | 299 | ||
| DEC-AGR-00-AGR02 | Agricultural production and productivity | 199 | 2,396 | 121 | ||
| DEC-AGR-00-AGR03 | Management of natural resources | 2,008 | ||||
| DEC-AGR-00-AGR04 | Production oriented market | 245 | 3 | 12 | ||
| DEC-AGR-00-AGR06 | Use and utilisation of land | 22 | 270 | |||
| DEC-AGR-00-AGR11 | Agricultural production | 1,424 | 4,266 | |||
| DEC-AGR-00-AGR12 | Agricultural productivity | 90 | 172 | |||
| DEC-AGR-00-AGR13 | Natural resource management | 879 | 565 | |||
| DEC-AGR-01 | Food security | 956 | ||||
| DEC-AGR-01-AGR02 | Agricultural productivity | 929 | ||||
| DEC-AGR-01-AGR03 | Natural resource management | 27 | ||||
| DEC-DRU-00 | Rural development | 3,028 | 2,786 | 1,998 | ||
| Total | DEC-AGR + DEC-DRU-00 | Agriculture, livestock, forestry and wildlife + rural development | 3,163 | 5,759 | 5,805 | 7,434 |
[i] Note: a The total expenditure at the DEC level contains more than the AE level expenditures shown here. The other AE level expenditures of DEC are not shown here for economy of space, since they do not relate to agriculture.
Table 10
Agricultural and rural development realized expenditure (CGE), by priority-sector and administrative classification (in millions of Mozambican meticais).
| Broad priority-sector categories and administrative classification | 2010 | 2011 | 2012 | 2013b | |
|---|---|---|---|---|---|
| Agriculture | 3,719 | 3,980 | 10,358 | 13,354 | |
| 01 | Office of the President | 14 | 39 | 5,446 | 6,923 |
| 0122 | District Administrations | 14 | 39 | 5,446 | 6,923 |
| 03 | Office of the Prime Minister | 100 | 34 | ||
| 0311 | Development Agency of the Zambeze valley | 100 | 34 | ||
| 26 | Ministry of Planning and Developmentc | 225 | 558 | 1,101 | 1,446 |
| 2601 | Ministry of Planning and Development | 225 | 220 | 191 | 267 |
| 2607 | National Institute of Statistics | 268 | |||
| 2609 | Millennium Challenge Account Program | 338 | 462 | 548 | |
| 2628 | Special Economic Zones | 18 | |||
| 2681 | Development Agency of the Zambeze valley | 65 | 558 | ||
| 2683 | Centre for Investment Promotion | 47 | |||
| 2685 | Office for Accelerated Development Economic Areas | 48 | |||
| 2687 | Fund for Economic Rehabilitation | 1 | 72 | ||
| 35 | Ministry of Agriculture | 3,380 | 3,349 | 2,998 | 4,024 |
| 3501 | Ministry of Agriculture | 1,186 | 1,185 | 1,218 | 1,364 |
| 3503 | Food and Nutritional Security Technical Secretariat | 7 | 7 | 17 | |
| 3521 | Provincial Directorate of Agriculture | 1,316 | 1,003 | 817 | 1,032 |
| 3522 | Cotton Institute Delegation | 1 | 8 | 14 | 21 |
| 3528 | Delegation of the Institute for Promotion of Cashew Nuts | 29 | 37 | 52 | 98 |
| 3529 | Provincial Delegation of Agriculture Promotion | 23 | 27 | ||
| 3581 | Mozambique Cotton Institute | 48 | 62 | 91 | 179 |
| 3582 | Institute of promotion of cashew nuts, INCAJU | 194 | 291 | 115 | 71 |
| 3586 | Agrarian Research Institute of Mozambique | 306 | 265 | 177 | 149 |
| 3590 | Agriculture Promotion Centre | 196 | 245 | 110 | 134 |
| 3591 | Training Institute on land and cartography adm. | 16 | 21 | 20 | 25 |
| 3592 | National Centre for Cartography and Remote Sensing | 25 | 36 | 25 | 51 |
| 3593 | Agricultural Development Fund (FDA) | 63 | 190 | 327 | 854 |
| 37 | Ministry of Fisheries | 813 | 961 | ||
| 3701 | Ministry of Fisheries | 241 | 201 | ||
| 3702 | National Board of Fisheries | 45 | 63 | ||
| 3707 | School of Fisheries | 19 | 29 | ||
| 3721 | Provincial Fisheries | 69 | 108 | ||
| 3726 | Delegations of the National Aquaculture Development | 8 | 21 | ||
| 3781 | Fisheries Development Fund | 151 | 163 | ||
| 3782 | National Institute for Fisheries Research | 78 | 107 | ||
| 3783 | National Institute for Development of Small Scale Fisheries | 121 | 142 | ||
| 3784 | National Institute of Fish Inspection | 44 | 75 | ||
| 3786 | National Institute of Aquaculture Development | 37 | 51 | ||
| Rural Development | 198 | 194 | |||
| 25 | Ministry of State Administration | 81 | 79 | ||
| 2501 | Ministry of State Administration | 77 | 68 | ||
| 2509 | National Institute of Disaster Management | 4 | 8 | ||
| 2521 | Provincial Directorate of Support and Control | 4 | |||
| 41 | Ministry of Industry and Trade | 118 | 115 | ||
| 4101 | Ministry of Industry and Trade | 110 | 109 | ||
| 4121 | Provincial Directorate of Industry and Tradea | 0 | |||
| 4185 | Institute for Promotion of small and medium enterprises | 7 | 5 | ||
| Total Agricultural and Rural Development | 3,719 | 3,980 | 10,557 | 13,548 | |
[i] Notes: a Zero in 2013 Provincial Directorate of Industry and Trade stands for a rounding issue. The actual number is 0.30 MMT. b The 2013 data was matched to the administrative coding system that was in place through 2012, although the coding system subsequently changed effective 2013 (for further details on this change, see Table 3). This is done for easier comparison of the data across years in this table.
c This also includes rural development expenditure.
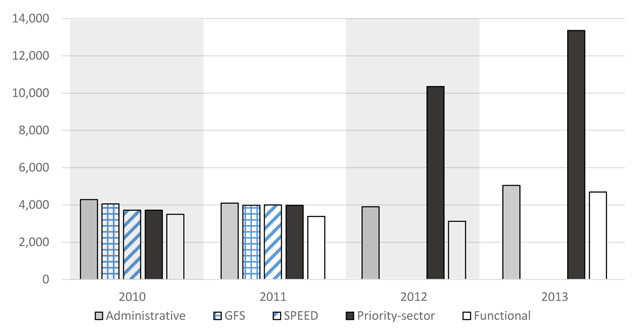
Figure 1
Comparison of agricultural public expenditures across different data sources, 2010–2013 (in millions of Mozambican meticais).
Notes: GFS = Government Finance Statistics; SPEED = Statistics on Public Expenditures for Economic Development.