
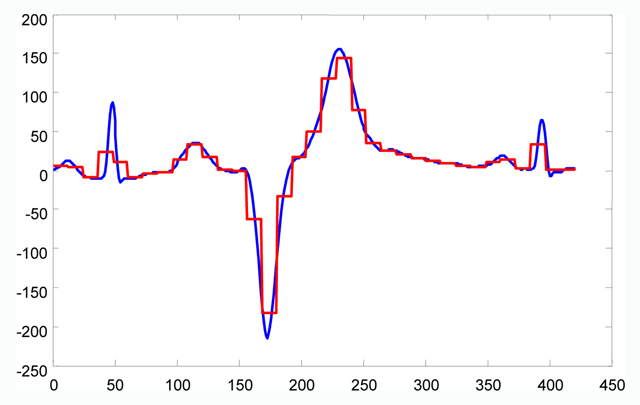
Figure 1
PAA representation of time series.
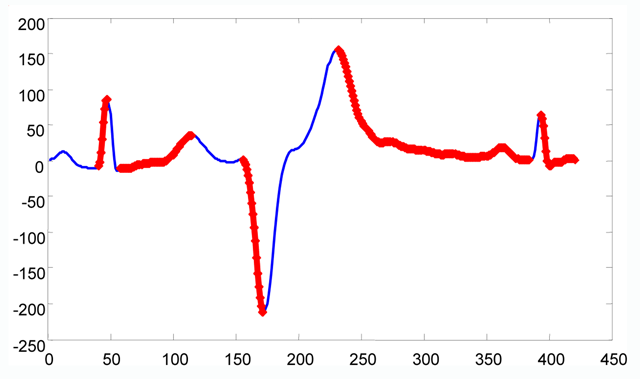
Figure 2
Subsequence matching section.
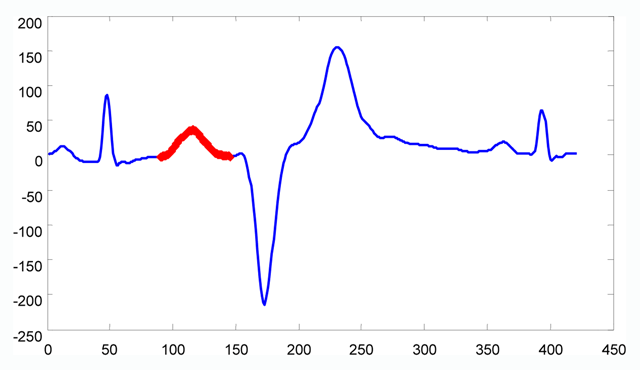
Figure 3
Time series shapelet.
Table 1
Test data.
| Datasets | Partition | Instances(train/test) | Length | Number(classes) |
|---|---|---|---|---|
| ECGFiveDays | Train/Test | 23/861 | 136 | 2 |
| GunPoint | Train/Test | 50/150 | 150 | 2 |
| DiatomSizeReduction | Train/Test | 16/306 | 345 | 4 |
| Ham | Train/Test | 109/105 | 431 | 2 |
| Herring | Train/Test | 64/64 | 512 | 2 |
| DP_Little | Train/Test | 400/645 | 250 | 3 |
| DP_Middle | Train/Test | 400/645 | 250 | 3 |
| DP_Thumb | Train/Test | 400/645 | 250 | 3 |
| MP_Little | Train/Test | 400/645 | 250 | 3 |
| MP_Middle | Train/Test | 400/645 | 250 | 3 |
| PP_Little | Train/Test | 400/645 | 250 | 3 |
| PP_Middle | Train/Test | 400/645 | 250 | 3 |
| PP_Thumb | Train/Test | 400/645 | 250 | 3 |
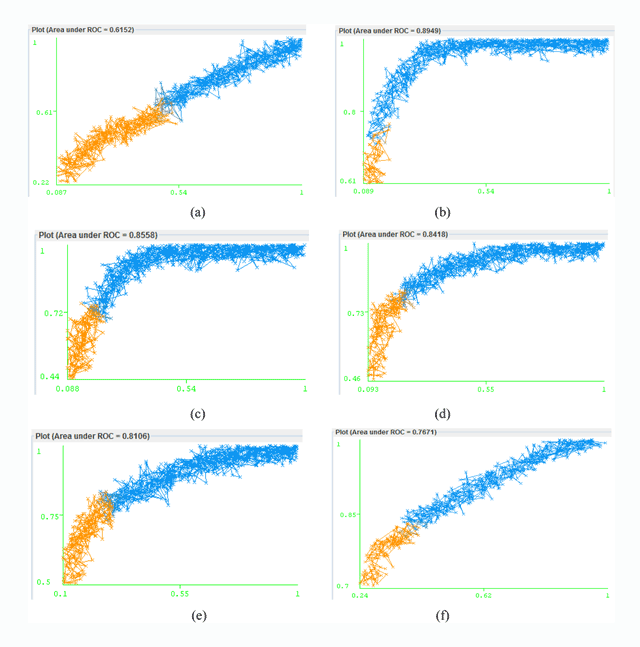
Figure 4
The ROC curve under different compression ratio.
Table 2
Computing time and the value of AUC.
| Value of v | Computing time (s) | The value of AUC |
|---|---|---|
| – | – | 0.6152 |
| v = 1 | 261097 | 0.8949 |
| v = 2 | 55889 | 0.8558 |
| v = 3 | 20790 | 0.8418 |
| v = 4 | 9970 | 0.8106 |
| v = 5 | 5193 | 0.7671 |
Table 3
Comparison of computing time (s) between the improved and original algorithm.
| Datasets | Traditional shapelet | Shapelet extract with PAA | Shapelet extract with PAA and efficient subsequence matching | Upgrade multiples of computing speed |
|---|---|---|---|---|
| ECGFiveDays | 32 | 3.6 | 1.5 | 21.3 |
| GunPoint | 195 | 16.4 | 6.7 | 29.1 |
| DiatomSizeReduction | 1334 | 128 | 46.4 | 28.75 |
| Ham | 6211 | 577 | 204 | 30.44 |
| Herring | 4873 | 365 | 151 | 32.27 |
| DP_Little | 37541 | 3057 | 1287 | 29.17 |
| DP_Middle | 38378 | 3106 | 1324 | 28.98 |
| DP_Thumb | 38332 | 3096 | 1318 | 29.08 |
| MP_Little | 38454 | 3122 | 1357 | 28.34 |
| MP_Middle | 37661 | 3084 | 1306 | 28.84 |
| PP_Little | 38339 | 3155 | 1388 | 27.62 |
| PP_Middle | 37854 | 3088 | 1315 | 28.79 |
| PP_Thumb | 38287 | 3135 | 1373 | 27.89 |
Table 4
General classifier Accuracy value using improved algorithm.
| Datasets | C4.5 Decision Tree | Logistic Regression | SVM | Random Forests | KNN | Naïve Bayesian |
|---|---|---|---|---|---|---|
| ECGFiveDays | 0.9334 | 0.9413 | 0.9614 | 0.9735 | 0.9512 | 0.9566 |
| GunPoint | 0.9323 | 0.9411 | 0.9812 | 0.9633 | 0.9025 | 0.9364 |
| DiatomSizeReduction | 0.8324 | 0.8847 | 0.9077 | 0.8522 | 0.9211 | 0.8913 |
| Ham | 0.7987 | 0.8214 | 0.8425 | 0.8333 | 0.8327 | 0.8185 |
| Herring | 0.8668 | 0.8843 | 0.9102 | 0.9121 | 0.8992 | 0.9058 |
| DP_Little | 0.7445 | 0.8753 | 0.8541 | 0.8336 | 0.7525 | 0.8425 |
| DP_Middle | 0.7300 | 0.8777 | 0.8635 | 0.8377 | 0.7356 | 0.8418 |
| DP_Thumb | 0.7364 | 0.8784 | 0.8621 | 0.8324 | 0.7412 | 0.8455 |
| MP_Little | 0.7544 | 0.8784 | 0.8758 | 0.8367 | 0.7664 | 0.8441 |
| MP_Middle | 0.7468 | 0.8823 | 0.8654 | 0.8552 | 0.7630 | 0.8663 |
| PP_Little | 0.7568 | 0.9002 | 0.8734 | 0.8651 | 0.7811 | 0.8667 |
| PP_Middle | 0.7633 | 0.8987 | 0.8787 | 0.8600 | 0.7798 | 0.8792 |
| PP_Thumb | 0.7618 | 0.9013 | 0.8842 | 0.8631 | 0.7744 | 0.8725 |

Figure 5
Accuracy comparison with different classifiers.