
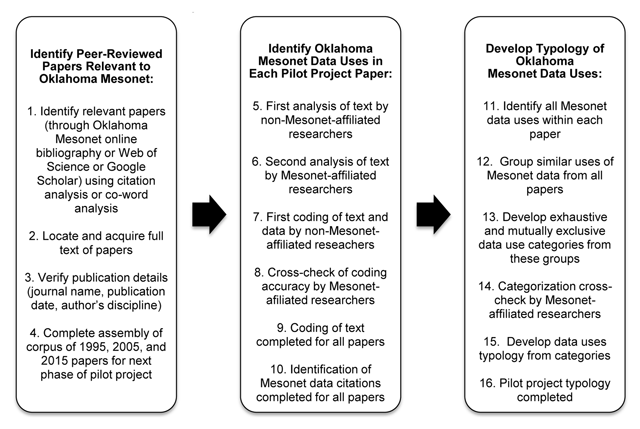
Figure 1
Pilot project processes for Oklahoma Mesonet data.
Table 2
Textual samples of Oklahoma Mesonet data citation categorization.
| Category | Source | Text of Data Citation |
|---|---|---|
| Assimilation | (Tanamachi, Heinselman & Wicker 2015: 511–512) | Twenty-eight Oklahoma Mesonet (Brock et al. 1995) stations were operating in the analysis domain on 24 May 2011 … recording observations of relative humidity RH, aspirated air temperature, wind speed, wind direction, and atmospheric pressure every 1 min. Of particular interest are the data from the El Reno Mesonet station [http://ticker.mesonet.org/select.php?mo505&da527&yr52011]. As the tornado passed, the atmospheric pressure decreased 17 hPa at 2120 UTC … while the 1-min-average ensemble of pressure traces from the lowest model scalar level (125 m AGL) to the surface using the hydrostatic equation and the surface pressure in the initial sounding (947 hPa). wind speed at 10 m AGL increased from 10 to 51 ms21 … We derived simulated near-surface observations for comparison by interpolating the model variables at 125 m AGL from the grid points closest to the El Reno Mesonet station …. We adjusted the simulated ensemble of pressure traces from the lowest model scalar level (125 m AGL) to the surface using the hydrostatic equation and the surface pressure in the initial sounding (947 hPa). |
| Experimentation | (Verburg et al. 2005: 1721–1722) | Starting on 10 February, 2002, temperatures inside the EcoCELLs were maintained based on 8-year (1993–2000), 5-min averages from a MESONET station (Brock et al., 1995) less than 1.6 km from the excavation site [in Purcell, Oklahoma] … Using a heating and cooling underneath the monoliths, soil temperatures in the deepest horizons (1.45 m depth) were kept as close as possible to the 1993–2000 mean annual ambient air temperature (16 1C) measured at the excavation site to simulate realistic soil temperature profiles … Precipitation was applied using an overhead rain simulator with a fixed intensity. We based frequency and amounts on measurements from the MESONET site (same 8-year period used for temperature) with precipitation at each watering applied at the mean monthly total divided by the mean frequency for that month. |
| Observation | (Tanner et al. 2015: 477–478) | Our objectives were to determine if sympatric populations of bobwhite and scaled quail respond behaviorally to artificial surface-water sources in a semiarid region at the species distribution extremes… Over the course of our study (2012–2014), average temperatures in summer ranged from 19.56–22.28, 25.72–27.22, and 26.78–30.06 °C during May, June, and July, respectively … Average temperatures in the winter ranged from –0.83 to 2.17, 1.28–1.33, and –0.33 to 2.39 °C during December, January, and February, respectively … Annual precipitation was 34.44, 50.29, and 39.42 cm in 2012, 2013, and 2014, respectively…. Climate data were obtained from the Beaver Mesonet station (Brock et al., 1995; McPherson et al., 2007). |
| Simulation | (Stadler, Dryden & Greene 2015: 210–211) | Wind measurements at individual wind farm turbines would have been ideal for use in this research, but wind farm owners are notoriously protective of such data, which could be used by competitors to plot the efficiency of performance. Therefore, we used proxy data from the Oklahoma Mesonetwork. The Oklahoma Mesonetwork (Mesonet) is a network of 120 automated meteorological observation stations across all 77 counties in Oklahoma [36]. A full suite of data is reported and quality-controlled for five-minute time increments. Wind was measured at the standard 10-m height by the RM Young wind monitor with an accuracy of ±0.3 m s–1 [37]. Each wind farm in Oklahoma is within 20 kilometers of a Mesonet station. We chose two wind farms in the western Oklahoma within areas of the most dramatic projected wind velocity changes in the NARCCAP output. Each wind farm was paired with the closest Mesonet station to represent that wind farm with a year of five-minute data (Figure 3). The Centennial wind farm in the northern portion of the study domain was paired with the Buffalo Mesonet station, and the Weatherford Wind Energy Center and the Weatherford Mesonet station were paired further south. |
| Utilization | (Kenkel & Norris 1995: 365) | The two objectives of the study were to estimate average willingness to pay and to determine the characteristics of producers who would pay to access and use mesoscale weather information. To this end, two maximum likelihood models were estimated: one for the raw [Oklahoma] Mesonet data and one for the raw data/value-added information combination …. Variables representing payments for agricultural publications, full- versus part-time farming, gross sales, use of irrigation, and weather-related crop income losses were found to significantly impact the willingness to pay for raw mesoscale weather data. |
| Validation | (Bajgain et al. 2015: 153) | Daily precipitation and soil moisture data from 2000–2013 at the Oklahoma Mesonet Marena and El Reno stations were downloaded from the Oklahoma Mesonet website (www.mesonet.org/index.php/weather/daily_data_retrieval). The daily data were aggregated into 8-day periods to match with the temporal resolution of the Moderate-Resolution Imaging Spectroradiometer (MODIS) derived VIs. Three different soil moisture data products (soil water potential, fractional water index and volumetric water content) are available at the Mesonet website. These soil moisture data products were derived based on the calibrated change in soil temperature over time after a heat pulse is introduced (Illston et al., 2008). In our analysis, we used volumetric soil water content (SWC) collected at three different soil profiles (5, 25, and 60 cm depth.) |