
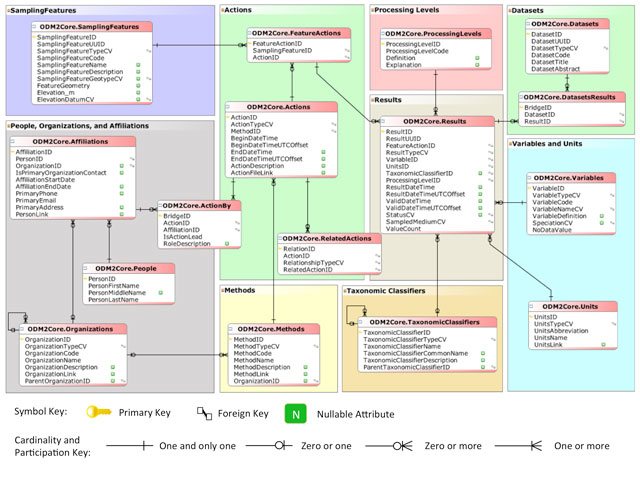
Figure 1
ODM2 core schema illustrated using entity relationship notation (Horsburgh et al., 2016).
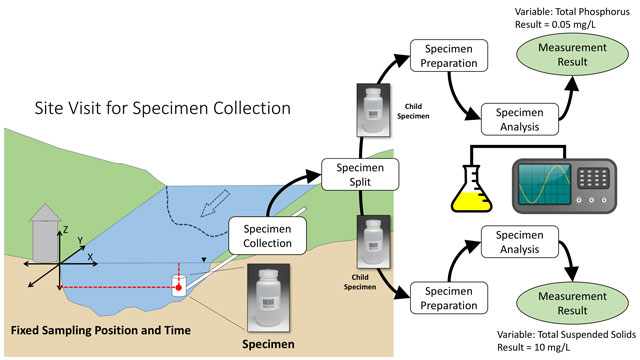
Figure 2
Depiction of a water quality sampling workflow. The separation of sampling features, actions, and results in ODM2 enables a much richer metadata description of specimens and the relationships between them (e.g., parent – child), their collection, preparation, and analysis actions (shown as white boxes in the figure), and the final measurement results.
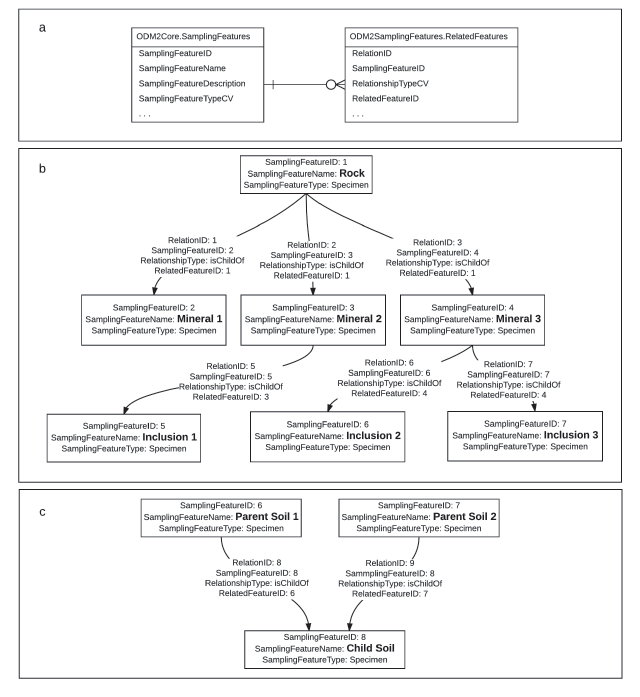
Figure 3
Examples of relationships between parent and child SamplingFeatures in ODM2. (a) shows the ODM2 SamplingFeatures and RelatedFeatures entities and their relationship. (b) the hierarchy of a rock specimen composed of minerals, which may have inclusions, as an example of multiple child SamplingFeatures derived from a single parent SamplingFeature. (c) an example of a soil specimen SamplingFeature created by mixing two parent soil specimen SamplingFeatures. In (b) and (c), SamplingFeatures are shown as boxes, and relationships between them are shown as arrows with text labels showing important attributes of each relationship.
Table 1
ODM2 Use Cases.
| Name | Hydrology: Little Bear River | Rock Geochemistry: PetDB | Soil Geochemistry: CZChemDB | Biogeochemistry: Marchantaria |
|---|---|---|---|---|
| Organization | Utah State University, Utah Water Research Laboratory | IEDA, Interdisciplinary Earth Data Alliance, Lamont Doherty Earth Observatory, Columbia University | Susquehanna Shale Hills Critical Zone Observatory, Pennsylvania State University | CAMREX, Carbon in the Amazon River Experiment (University of Washington and CENA/Universidade de Sao Paulo, Brazil) |
| Domain focus | hydrology, water quality | geochemistry, rocks, minerals, and inclusions | geochemistry, soils and regolith | aquatic geochemistry biogeochemistry, hydrology |
| Specimen, Time Series, or both? | both specimens and time series | specimen | specimen | specimen |
| Primary data management and generation, or synthesis/literature? | Data management for a research watershed. Data generated by in situ sensors and regular and event based field sampling of water quality. | synthesis of published literature | synthesis and data management | synthesis of data generated by the research project, but compiled only after publication |
| Time period | 2005 – Present. Some data collection ongoing. | earliest publication is 1937 to present (ongoing) | 2010 to present | 1982–1993 |
| Spatial domain | Little Bear River Watershed, Utah, USA | Global | Shale Hills Critical Zone Observatory, Other Critical Zone Observatories | Central Amazon mainstem river site, Brazil |
Table 2
ODM2 Implementation Summary.
| Name | Hydrology: Little Bear River | Rock Geochemistry: PetDB | Soil Geochemistry: CZChemDB | Biogeochemistry: Marchantaria |
|---|---|---|---|---|
| Changes/additions to ODM2 schema? | no | yes (see text) | yes (see text) | no |
| Other, external CVs? | no | yes | yes | no |
| Original RDBMS system used1 | Microsoft SQL Server | Oracle | Microsoft Access | Microsoft Access and PostgreSQL |
| RDBMS implemented for ODM2 | Microsoft SQL Server | PostgreSQL | PostgreSQL | PostgreSQL |
| # Sampling Feature Sites2 | 16 | 22,800+ “stations” | 265+ | 2 “water quality stations” |
| # Sampling Feature Specimens2 | 3600+ | 83,000+ | 1980+ | 700+ |
| # Results and Results Values2 | ~550 results, 30 million values | 3,000,000+ values | 22,700+ values | 2,510+ values |
| Result Types used | Time Series, Measurement | Measurement | Measurement | Measurement |
[i] 1 For data models used in the original data sources, see the Use Cases section.
2 Data collection and/or data mapping and loading are ongoing in all use cases. These values represent the state of the ODM2 mappings as of March 2016.