
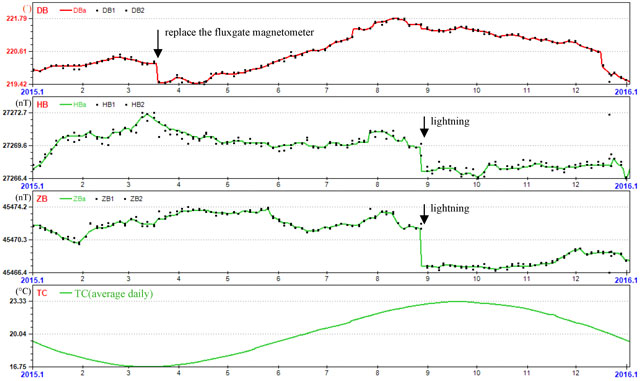
Figure 1
Baselines at KSH observatory in 2015, with absolute measurement log marked. From top to bottom: Declination (D), Horizontal component (H), Vertical component (Z). The black points indicate observed baseline values, and the solid lines are the adopted baselines for the three components D, H, and Z.
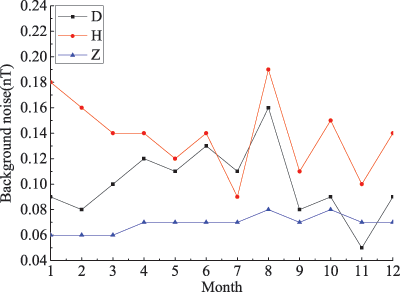
Figure 2
Background noise for elements D, H, and Z at observatory LYH in 2015.
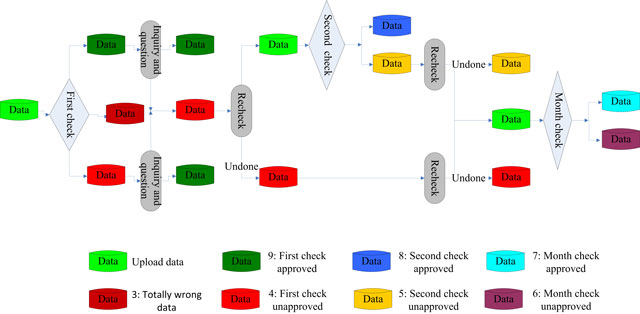
Figure 3
Flow diagram of data checking at GNC.
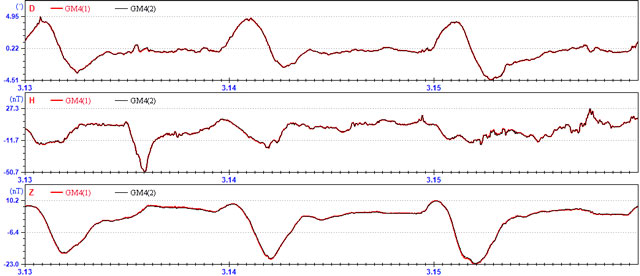
Figure 4
Inter-comparison of two sets of GM4 magnetometers at LYH observatory.
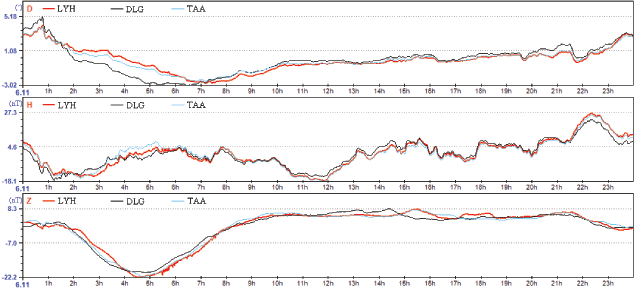
Figure 5
Raw data daily variation for D, H, and Z components at observatories LYH, DLG, and TAA.
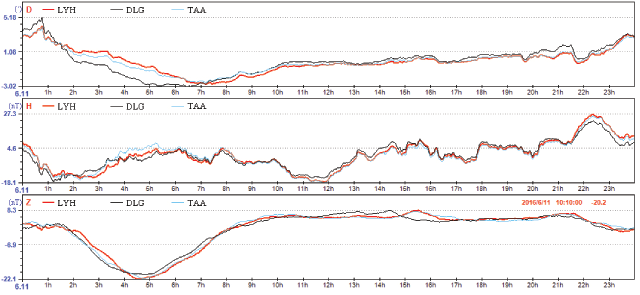
Figure 6
Processed data for D, H, and Z components at observatories LYH, DLG, and TAA.
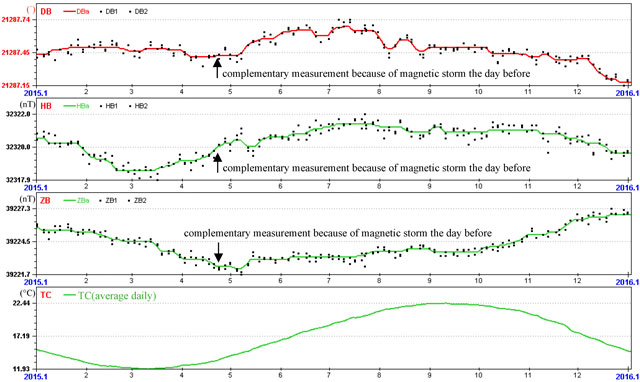
Figure 7
Baseline at MCH observatory in 2015. The points represent observed baseline values, and the solid lines show the adopted baseline. The arrows indicate the day on which complimentary measurements were made.
Table 1
Monthly RMSEs at MCH observatory in 2015.
| Station Code | Component | Root Mean Square Error | |||||||||||
|---|---|---|---|---|---|---|---|---|---|---|---|---|---|
| MCH | Z (nT) | 0.3 | 0.18 | 0.19 | 0.26 | 0.22 | 0.23 | 0.62 | 0.25 | 0.19 | 0.17 | 0.27 | 0.28 |
| MCH | H (nT) | 0.25 | 0.23 | 0.29 | 0.27 | 0.25 | 0.28 | 0.4 | 0.31 | 0.25 | 0.24 | 0.39 | 0.32 |
| MCH | D (°) | 0.05 | 0.03 | 0.03 | 0.04 | 0.03 | 0.03 | 0.05 | 0.03 | 0.02 | 0.03 | 0.03 | 0.02 |
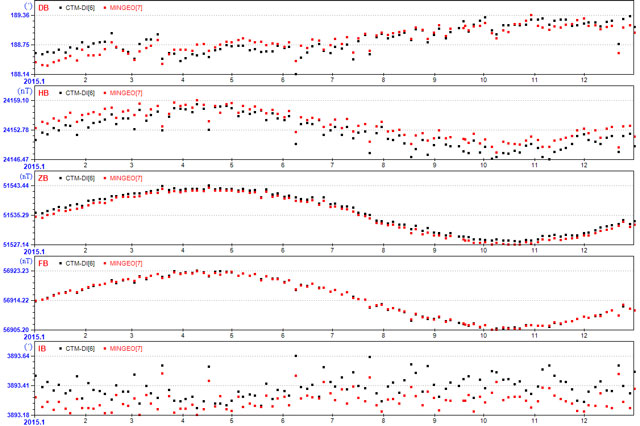
Figure 8
D, H, Z, F, and I baselines determined by the same variometer and by different fluxgate theodolites at WMQ in 2015.
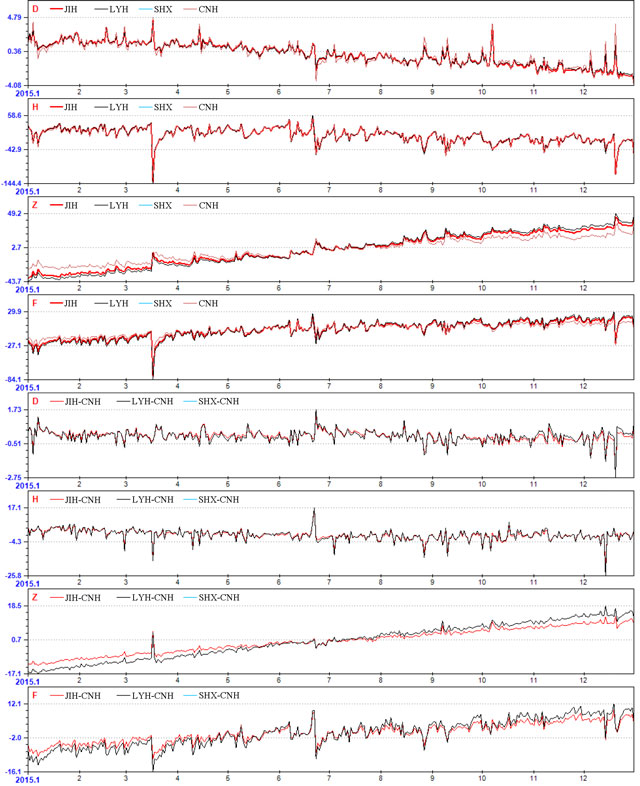
Figure 9
Time series of midnight means and their differences.
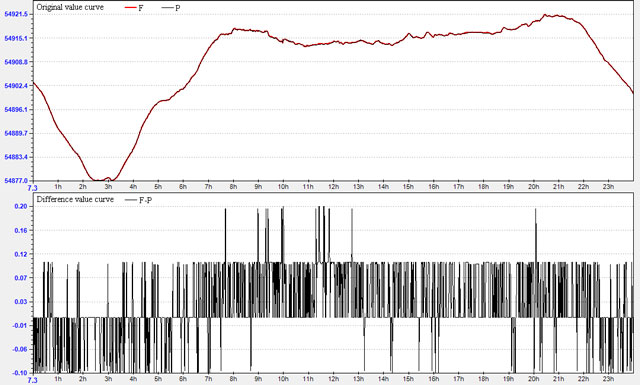
Figure 10
F-P minute data curve of CNH observatory.