
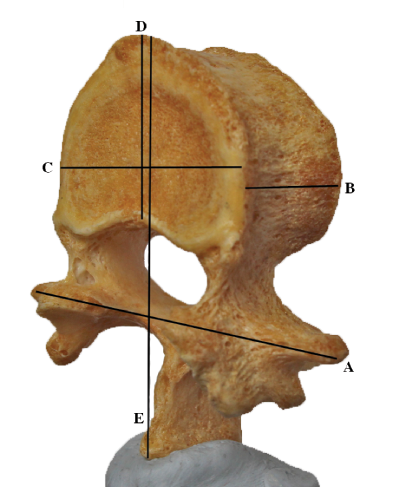
Figure 1
Distances measured on real vertebrae and 3D models. The figure shows a single real L4 lumbar vertebra mounted on Blu-tack with the five distances that were manually measured indicated by solid lines. A) Distance between most lateral points of the two transverse processes; B) Height of the vertebral body; C) Width of the vertebral body; D) Anterior-posterior length of vertebral body; E) Anterior-posterior distance between anterior edge of the vertebral body and the posterior tip of spinous process.
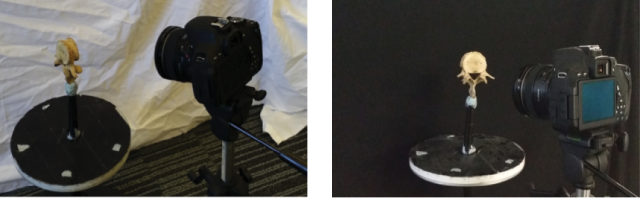
Figure 2
Photograph showing the set up for image acquisition. Here, a single vertebra is mounted on the turntable with Blu-tack, and the camera set up at 10cm above the horizon on the left image and at the horizon with black background on right image.
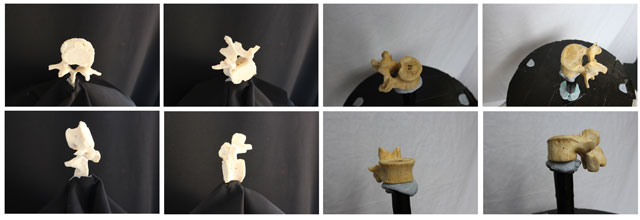
Figure 3
Eight different positions of the camera. The first row shows the camera raised by 10 cm from the horizon. The second row is at the horizon. The vertebra was mounted in four different positions. Images presented are examples of those used for reconstruction.
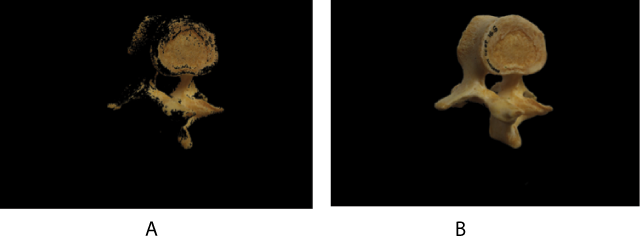
Figure 4
Pre-processed image showing examples of segmentation quality from the same single L3 vertebra. A) Poor segmentation; B) Good segmentation.
Table 1
Data on the five different measurements of each sampled vertebra. Differences between the measures on the real vertebrae using the callipers with an error of +/– 0.01 millimetres, and the models constructed with arm scanning. Model measurements were made using MeshLab’s measurement tool. The absolute error in millimetres and the percentage of relative error are given. 1–10) Numbers indicate individual vertebrae. A) Distance between most lateral points of the two transverse processes; B) Height of the vertebral body; C) Width of the vertebral body; D) Anterior-posterior length of vertebral body; E) Anterior-posterior distance between the anterior edge of the vertebral body and the posterior tip of spinous process.
| Arm Scanning Validation | |||||||||||
|---|---|---|---|---|---|---|---|---|---|---|---|
| Vertebra Number | 1 | 2 | 3 | 4 | 5 | 6 | 7 | 8 | 9 | 10 | |
| Arm Scanning Models (millimetres) | A | 56.0 | 81.6 | 90.4 | 65.2 | 69.6 | 63.2 | 79.0 | 73.2 | 53.5 | 76.0 |
| B | 26.6 | 25.3 | 27.5 | 22.1 | 22.3 | 20.4 | 23.6 | 22.5 | 24.6 | 24.9 | |
| C | 51.1 | 53.3 | 57.6 | 40.7 | 43.8 | 47.2 | 42.7 | 43.5 | 45.3 | 48.2 | |
| D | 38.6 | 38.7 | 37.0 | 28.1 | 28.5 | 30.7 | 31.1 | 33.5 | 33.8 | 33.2 | |
| E | 89.6 | 94.5 | 81.8 | 65.9 | 69.9 | 68.0 | 71.6 | 69.2 | 72.6 | 66.9 | |
| Real Models (millimetres) | A | 55.7 | 81.8 | 90.7 | 66.0 | 70.1 | 64.3 | 79.1 | 74.1 | 53.3 | 76.7 |
| B | 27.2 | 26.1 | 27.0 | 23.2 | 22.0 | 20.9 | 24.1 | 22.5 | 24.8 | 24.8 | |
| C | 51.9 | 54.4 | 57.3 | 41.4 | 43.5 | 47.6 | 42.4 | 43.8 | 45.6 | 48.2 | |
| D | 40.3 | 39.3 | 36.9 | 28.7 | 28.6 | 31.1 | 31.6 | 33.0 | 34.0 | 33.3 | |
| E | 91.5 | 96.2 | 83.1 | 65.8 | 69.4 | 67.9 | 71.8 | 69.9 | 75.2 | 66.5 | |
| Absolute Error (millimetres) | A | 0.3 | 0.2 | 0.3 | 0.8 | 0.5 | 1.1 | 0.1 | 0.9 | 0.2 | 0.7 |
| B | 0.6 | 0.8 | 0.5 | 1.1 | 0.3 | 0.5 | 0.5 | 0.0 | 0.2 | 0.1 | |
| C | 0.8 | 1.1 | 0.3 | 0.7 | 0.3 | 0.4 | 0.3 | 0.3 | 0.3 | 0.0 | |
| D | 1.7 | 0.6 | 0.1 | 0.6 | 0.1 | 0.4 | 0.5 | 0.5 | 0.2 | 0.1 | |
| E | 1.6 | 1.7 | 1.3 | 0.1 | 0.5 | 0.1 | 0.2 | 0.7 | 2.6 | 0.4 | |
| Relative Error (%) | A | 0.5 | 0.2 | 0.3 | 1.2 | 0.7 | 1.7 | 0.1 | 1.2 | 0.3 | 0.9 |
| B | 2.2 | 3.1 | 1.8 | 4.8 | 1.3 | 2.4 | 2.0 | 0.0 | 0.8 | 0.4 | |
| C | 1.5 | 2.0 | 0.5 | 1.7 | 0.6 | 0.8 | 0.7 | 0.6 | 0.6 | 0.0 | |
| D | 4.3 | 1.5 | 0.2 | 2.1 | 0.3 | 1.2 | 1.5 | 1.5 | 0.5 | 0.3 | |
| E | 1.7 | 1.7 | 1.5 | 0.1 | 0.7 | 0.1 | 0.2 | 1.0 | 3.5 | 0.5 | |

Figure 5
Different views of the vertebrae constructed by arm scanner.
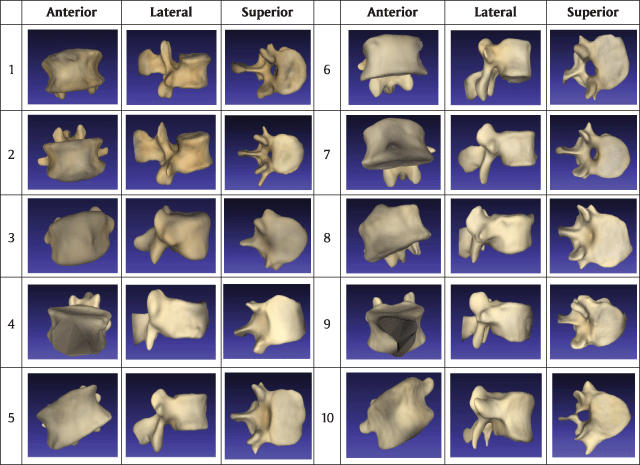
Figure 6
Different views of 10 vertebrae constructed by image-based method.
Table 2
The differences in the five distances between the image-based models and the real vertebrae. Entries marked * indicate that the data was not constructed so could not be compared. 1–10) Numbers indicate individual vertebrae. A) Distance between most lateral points of the two transverse processes; B) Height of the vertebral body; C) Width of the vertebral body; D) Anterior-posterior length of vertebral body; E) Anterior-posterior distance between anterior edge of the vertebral body and the posterior tip of spinous process.
| Image-based models validation with real vertebrae | |||||||||||
|---|---|---|---|---|---|---|---|---|---|---|---|
| Vertebra Number | 1 | 2 | 3 | 4 | 5 | 6 | 7 | 8 | 9 | 10 | |
| Image-based Models (millimetres) | A | 51.7 | 81.5 | –* | –* | –* | 53.1 | –* | –* | 52.5 | 72.0 |
| B | 25.2 | 25.9 | 29.4 | 22.6 | 23.9 | 19.7 | 27.1 | 22.7 | 25.9 | 22.7 | |
| C | 48.2 | 53.0 | 53.3 | 34.3 | 45.1 | 43.4 | 44.6 | 44.1 | 45.1 | 42.7 | |
| D | 39.1 | 38.7 | 38.7 | 27.8 | 30.4 | 30.5 | 33.8 | 34.9 | 35.1 | 32.9 | |
| E | 95.2 | 92.6 | 85.0 | 61.3 | 69.0 | 67.7 | 75.4 | 66.5 | 73.6 | 64.3 | |
| Real Models (millimetres) | A | 55.7 | 81.8 | 90.7 | 66.0 | 70.1 | 64.3 | 79.1 | 74.1 | 53.3 | 76.7 |
| B | 27.2 | 26.1 | 27.0 | 23.2 | 22.0 | 20.9 | 24.1 | 22.5 | 24.8 | 24.8 | |
| C | 51.9 | 54.4 | 57.3 | 41.4 | 43.5 | 47.6 | 42.4 | 43.8 | 45.6 | 48.2 | |
| D | 40.3 | 39.3 | 36.9 | 28.7 | 28.6 | 31.1 | 31.6 | 33.0 | 34.0 | 33.3 | |
| E | 91.5 | 96.2 | 83.1 | 65.8 | 69.4 | 67.9 | 71.8 | 69.9 | 75.2 | 66.5 | |
| Absolute Error (millimetres) | A | 4.0 | 0.3 | –* | –* | –* | 11.2 | –* | –* | 0.8 | 4.7 |
| B | 2.0 | 0.2 | 2.4 | 0.6 | 1.9 | 1.2 | 3.0 | 0.2 | 1.1 | 2.1 | |
| C | 3.7 | 1.4 | 4.0 | 7.1 | 1.6 | 4.2 | 2.2 | 0.3 | 0.5 | 5.5 | |
| D | 1.2 | 0.6 | 1.8 | 0.9 | 1.8 | 0.6 | 2.2 | 1.9 | 1.1 | 0.4 | |
| E | 3.7 | 3.6 | 1.9 | 4.5 | 0.4 | 0.2 | 3.6 | 3.4 | 1.6 | 2.2 | |
| Relative Error (%) | A | 7.4 | 0.4 | –* | –* | –* | 19.1 | –* | –* | 1.5 | 6.3 |
| B | 7.6 | 0.8 | 8.5 | 2.6 | 8.2 | 5.9 | 11.7 | 0.9 | 4.3 | 8.8 | |
| C | 7.4 | 2.6 | 7.2 | 18.8 | 3.6 | 9.2 | 5.1 | 0.7 | 1.1 | 12.1 | |
| D | 3.0 | 1.5 | 4.8 | 3.2 | 6.1 | 1.9 | 6.7 | 5.6 | 3.2 | 1.2 | |
| E | 4.0 | 3.8 | 2.2 | 7.1 | 0.6 | 0.3 | 4.9 | 5.0 | 2.1 | 3.4 | |
Table 3
The differences in the five distances between the image-based models and the arm scanning models from arm scanning. Entries marked * indicate that the data was not constructed so could not be compared. 1–10) Numbers indicate individual vertebrae. A) Distance between most lateral points of the two transverse processes; B) Height of the vertebral body; C) Width of the vertebral body; D) Anterior-posterior length of vertebral body; E) Anterior-posterior distance between anterior edge of the vertebral body and the posterior tip of spinous process.
| Image-based models validation with arm scanning models | |||||||||||
|---|---|---|---|---|---|---|---|---|---|---|---|
| Vertebra Number | 1 | 2 | 3 | 4 | 5 | 6 | 7 | 8 | 9 | 10 | |
| Arm Scanning Models (millimetres) | A | 56.0 | 81.6 | 90.4 | 65.2 | 69.6 | 63.2 | 79.0 | 73.2 | 53.5 | 76.0 |
| B | 26.6 | 25.3 | 27.5 | 22.1 | 22.3 | 20.4 | 23.6 | 22.5 | 24.6 | 24.9 | |
| C | 51.1 | 53.3 | 57.6 | 40.7 | 43.8 | 47.2 | 42.7 | 43.5 | 45.3 | 48.2 | |
| D | 38.6 | 38.7 | 37.0 | 28.1 | 28.5 | 30.7 | 31.1 | 33.5 | 33.8 | 33.2 | |
| E | 89.9 | 94.5 | 81.8 | 65.9 | 69.9 | 68.0 | 71.6 | 69.2 | 72.6 | 66.9 | |
| Image-based Models (millimetres) | A | 51.7 | 81.5 | –* | –* | –* | 53.1 | –* | –* | 52.5 | 72.0 |
| B | 25.2 | 25.9 | 29.4 | 22.6 | 23.9 | 19.7 | 27.1 | 22.7 | 25.9 | 22.7 | |
| C | 48.2 | 53.0 | 53.3 | 34.3 | 45.1 | 43.4 | 44.6 | 44.1 | 45.1 | 42.7 | |
| D | 39.1 | 38.7 | 38.7 | 27.8 | 30.4 | 30.5 | 33.8 | 34.9 | 35.1 | 32.9 | |
| E | 95.2 | 92.6 | 85.0 | 61.3 | 69.0 | 67.7 | 75.4 | 66.5 | 73.6 | 64.3 | |
| Absolute Error (millimetres) | A | 4.3 | 0.1 | –* | –* | –* | 10.1 | –* | –* | 1.0 | 4.0 |
| B | 1.4 | 0.6 | 1.9 | 0.5 | 1.6 | 0.7 | 3.5 | 0.2 | 1.3 | 2.2 | |
| C | 2.9 | 0.3 | 4.3 | 6.4 | 1.3 | 3.8 | 1.9 | 0.6 | 0.2 | 5.5 | |
| D | 0.5 | 0.0 | 1.7 | 0.3 | 1.9 | 0.2 | 2.7 | 1.4 | 1.3 | 0.3 | |
| E | 5.3 | 1.9 | 3.2 | 4.6 | 0.9 | 0.3 | 3.8 | 2.7 | 1.0 | 2.6 | |
| Relative Error (%) | A | 7.9 | 0.1 | –* | –* | –* | 17.3 | –* | –* | 1.8 | 5.4 |
| B | 5.4 | 2.3 | 6.6 | 2.2 | 6.9 | 3.4 | 13.8 | 0.8 | 5.1 | 9.2 | |
| C | 5.8 | 0.5 | 7.7 | 17.0 | 2.9 | 8.3 | 4.3 | 1.3 | 0.4 | 12.1 | |
| D | 1.2 | 0.0 | 4.4 | 1.0 | 6.4 | 0.6 | 8.3 | 4.1 | 3.7 | 0.9 | |
| E | 5.7 | 2.0 | 3.8 | 7.2 | 1.2 | 0.4 | 5.1 | 3.9 | 1.3 | 3.9 | |
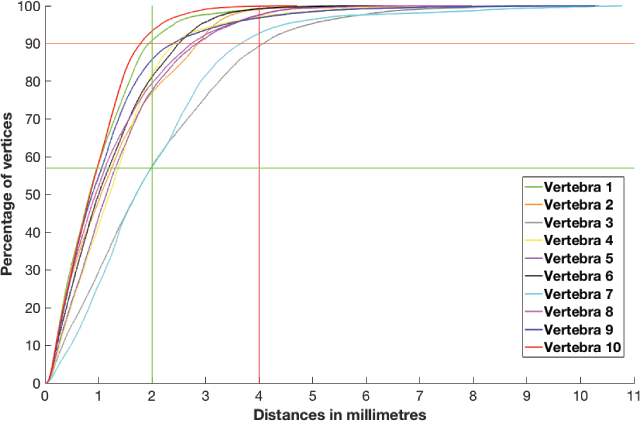
Figure 7
Distribution of the errors of the ten vertebrae, after post-processing. The x-axis represents the distance in millimetres and the y-axis represents the percentage of the vertices of the vertebra having that error or smaller. 57% and 90% of vertices are less than two and four millimetres error respectively for the worst case among the ten chosen vertebrae.
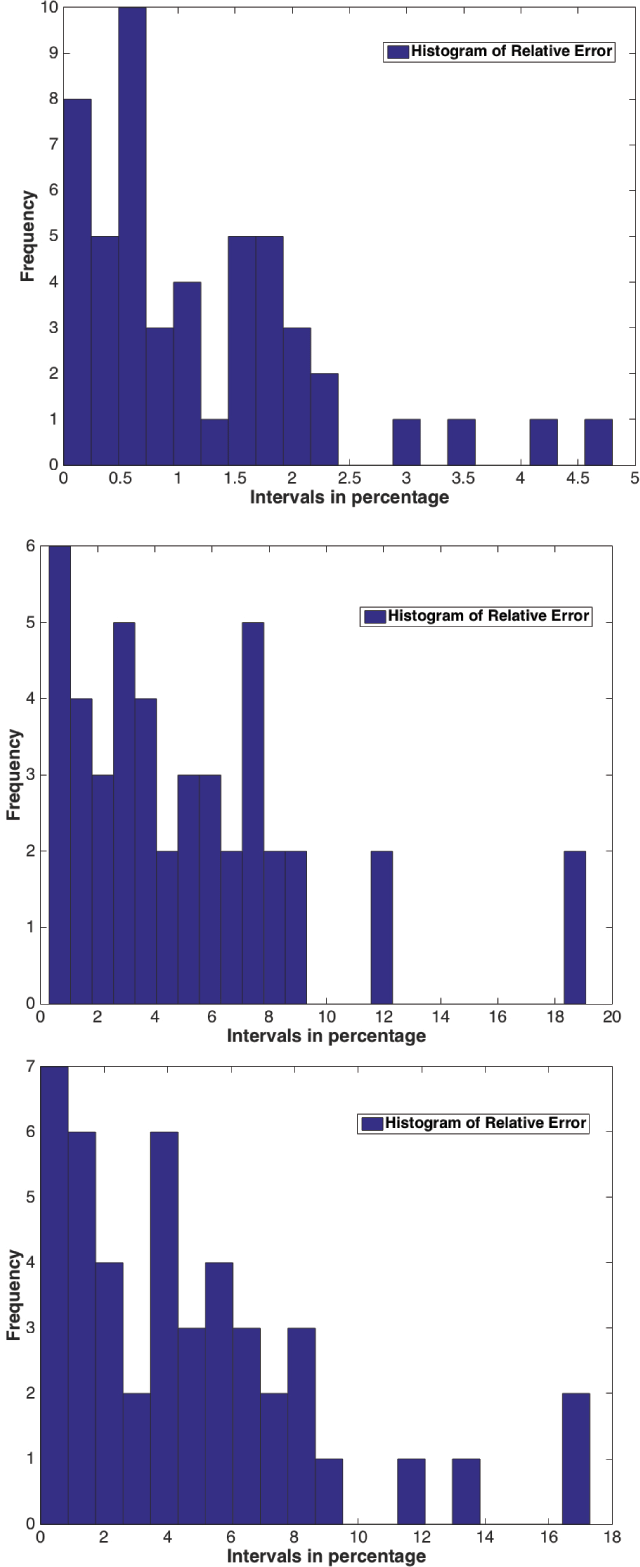
Figure 8
Histogram of relative errors of different comparisons. First histogram shows errors between arm scanning and real vertebrae, second one between real vertebrae and image-based models and last one between arm scanning and image-based models.
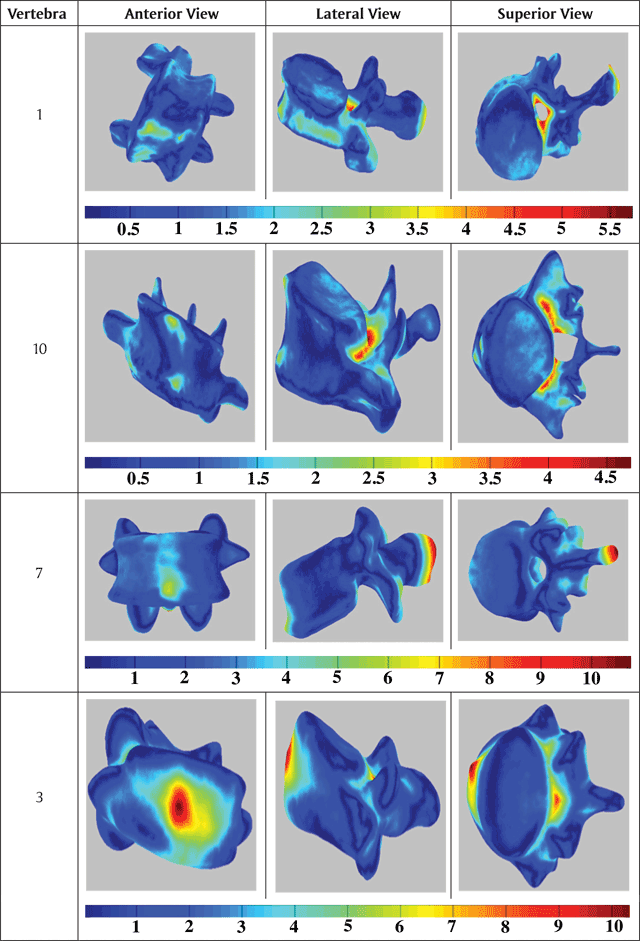
Figure 9
Heat map of the errors of the two best vertebrae shown in Figure 7 and the two worst. The numbers shown represent millimetres and the colours represent the scale. The vertebrae numbering corresponds to the legend in Figure 7.