
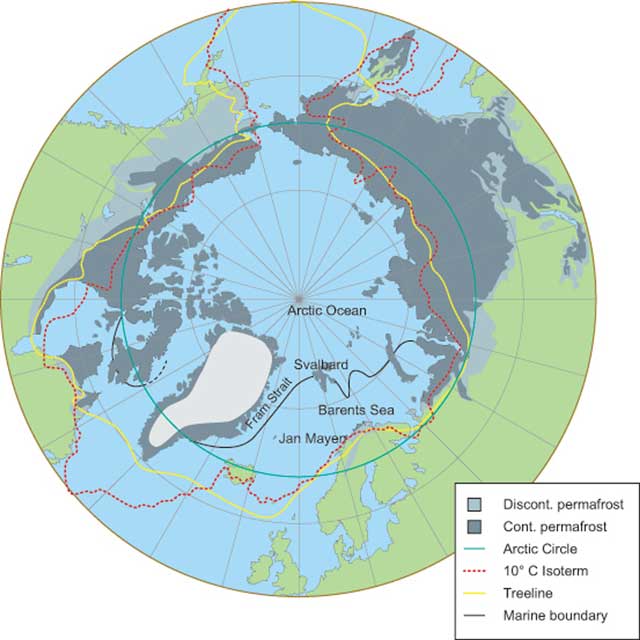
Figure 1
Summary of the different geographic limits for the Arctic commonly used. The geographic limits are defined in a variety of ways, such as by the distribution of permafrost, the Arctic Circle, the 10°C isotherm, the tree-line and/or the salinity boundary in the sea. Most boundaries of the Arctic are drawn further north in Norway and Scandinavia than in the rest of the world. This is because a branch of the warm Gulf Stream flows northwards along the coast of Norway and continues past Svalbard into the polar regions (Source http://www.arcticsystem.no/en/arctic-inc/headquarters.html).
Table 1
Summary of all the metadata included in the portal for each dataset.
| Dataset | Projects | Contacts | Parameters |
|---|---|---|---|
| Dataset Title | Short Name | Role | Category |
| Purpose | Long Name | Full Name | Parameter |
| Abstract | URL | Units | |
| Acquisition Methodology | Description | Phone | |
| DOI | URL Type | Fax | |
| Access Constraints | Organism short Name | ||
| Use Constraints | Organism long Name | ||
| Keywords | URL | ||
| Status | Description | ||
| Temporal Coverage | URL Type | ||
| Start Date | Address | ||
| Stop Date | City | ||
| Datacenter | References | Multimedia sample | Distribution |
| Short name | Title | Multimedia file | Distribution Format |
| Long name | Authors | Caption | Media |
| Address | Publication Date | Description | Size |
| City | Series | Fees | |
| Postal Code | Edition | ||
| Country | Volume | ||
| URL | Issue | ||
| Description | Report number | ||
| URL Type | Publication Place | ||
| Publisher | |||
| Pages | |||
| ISBN | |||
| DOI | |||
| Other details | |||
| URL | |||
| Description | |||
| URL Type | |||
| Data resolution | Instrument | Spatial Coverage | Paleo Coverage |
| Latitude Resolution | Site name | Southern latitude | Start date |
| Longitude Resolution | Location | Northern latitude | Stop date |
| Horizontal Resolution Range | Detailed location | Western longitude | Eon |
| Vertical Resolution | Site longitude | Eastern longitude | Era |
| Vertical Resolution Range | Site latitude | Minimum altitude | Period |
| Temporal Resolution | Site altitude | Maximum altitude | Epoch |
| Temporal Resolution Range | Site depth | Minimum depth | Stage |
| Platform short name | Maximum depth | ||
| Platform long name | |||
| Instrument longitude | |||
| Instrument latitude | |||
| Network coordinates | |||
| Instrument altitude | |||
| Instrument depth | |||
| Instrument description |
Table 2
Summary of all the datasets included in the Arctic metadata portal, illustrated in different categories to facilitate the visualisation.
| Type of measurement | Description/name | Main parameters | Spatial coverage | |
|---|---|---|---|---|
| Atmosphere | In situ | CLIMSLIP-NyA campaigns: chemical composition over the snow pack | BC | Svalbard |
| NDACC-SAOZ Balloons and ground based long-term observations of atmospheric composition change | O3, NO2, O4, H2O, Colour Index | Arctic stations | ||
| ICOS-ATC station | CO2, CO, CH4, meteorological parameters, water vapour isotopic content | West-Greenland | ||
| Water vapour isotopes dataset | δD, d-excess, meteorological parameters | Global network | ||
| RMR lidar observations of the atmosphere from Andoya station | T, aerosol properties | Andoya (Norway) | ||
| IAOOS buoys network (real time observations and radiative budget from OPTIMISM | Aerosol properties, cloud properties, T, meteorological parameters, radiative budget | Arctic ocean | ||
| Satellite | Global climatological data from microwave radiometers: AMSU-A/B and MHS instruments) | Brightness T, precipitation, convection, humidity, surface T | Global | |
| Atmospheric vertical profiles: CALIPSO | Lidar attenuated backscatter, reflectance, BT, aerosol and cloud properties, | Global | ||
| Atmospheric composition: IASI on board Meteop A/B | CO, Skin and atmospheric T, RH, cloud properties | Global | ||
| Greenhouse gases observations: GOSAT | CO2, CH4, Cloud cover, H2O | Global | ||
| atmospheric chemistry dataset: GOMOS | O2, OClO, NO3, NO2, O3 | Global | ||
| Ice cloud properties measurements: DARDAR | Global | |||
| Aircraft campaigns | Aerosol, cloud and radiative properties: ASTAR, RACEPAC, SoRPIC campaigns (as part of CLIMSLIP+IPEV) and RALI campaigns | Scattering phase function, extinction coefficient, Asymmetry parameter, LWC, TWC, aerosol and cloud properties, lidar backscatter | Svalbard, Canada | |
| Atmospheric chemical composition YAK-AEROSIB: Siberia | Equivalent BC, O3, CO2, aerosol concentration, water vapour concentration, wind speed, WBPT | Siberia | ||
| Aerosol measurements over the Arctic during POLARCAT project | CO, total particle concentration, aerosol concentration, O3 | Sweden, Greenland | ||
| Emissions inventories | MACCity: Global Anthropogenic emissions inventory | NOx, OC, ethane, CO2, acetone | Global | |
| Ocean | Buoys | OPTIMISM: Sea ice, ocean and meteorological observations from an Arctic network | Currents, SST, SSS, sea ice thickness and T | Arctic ocean |
| IAOOS: Sea ice, snow and oceanographic real time measurements in the Arctic | Sea ice concentration and T, SST, ice drift | Arctic ocean | ||
| Ships | TARA 2013 Expedition; CORIOLIS project; sea surface salinity drifters (OVIDE mission); R/V Polarstern | SST, SSS, pCO2, fCO2, CTD profiles, CO, non-methane hydrocarbon concentrations, chlorophyll | Arctic ocean and sub-polar North Atlantic | |
| Land | In situ | Permafrost observations: study of the influence of fluvial thermal erosion during the ice breakup of the Lena River | Erosion rate, T of the frozen layer, geographical distribution of the thaw slump | Siberia |
| Satellites | Plant functional Type (PFT) maps based on GlobCover 2005, surface temperature maps over the Arctic (SSM/I and SSMIS) | PFT classification, land surface T | Arctic | |
| Ice core observations | NEEM North-west Greenland, Isotopic composition from the last interglacial period till present at the summit of Greenland GRIP; NGRIP, North Greenland; | δ18O, ice and gas age, air content, δ—Kr/Ar, δ—Xe/Ar, CH4, ice sheet elevation change, δ15 N, d-excess, δD | Greenland |
Table 3
List of the data-centres that contain part or all the datasets from the portal presented in this paper. The numbers correspond to the item number of each dataset described before as numbered in the supplementary material document.
| Data centre | Dataset | URL link | Data access |
|---|---|---|---|
| ICARE | CALIPSO (2); DARDAR (5); AMSU-A, B and MHS (6); IAOOS (11) | http://www.icare.univ-lille1.fr/drupal/ | Data access through registration: http://www.icare.univ-lille1.fr/drupal/register. Some can require prior authorizationfrom the PI |
| ETHER | GOMOS (7); GOSAT (8); MACCity global anthropogenic emissions inventory (16); NDACC-France SAOZ Balloons (17); NDACC-France ground based (18); IASI (12) | http://www.pole-ether.fr/ | Data access free within the scientific framework. Login request is required: http://www.pole-ether.fr/etherTypo/index.php?id=1553&L=1 |
| NOAA Paleoclimatology | GRIP (9); NGRIP (10); NEEM(19) | http://www.ncdc.noaa.gov/paleo/icecore/greenland/greenland.html | Access to online data is free of charge. Some orders could be subject to a certification, consultation fee or handling charge. |
| Water Isotopes database | Atmospheric water vapour isotopes (13) | http://waterisotopes.lsce.ipsl.fr/ | Data directly available through website (plots or tabulated). Database completion: work in progress. |
| ICOS-ATC | Ivittuut Observatory (Greenland) (14) | https://icos-atc-demo.lsce.ipsl.fr/ | Data available through data centre asplots. Data points available through email. |
| Pangaea | Land surface temperature maps (15); PFT maps over Siberia (22) | http://www.pangaea.de/ | Data access directly through website as tab-delimited text or HTML format |
| CORIOLIS | CORIOLIS (4) | http://www.coriolis.eu.org/ | Data downloadable in different ways through website. A user desk allow customers to communicate with the CORIOLIS team. |
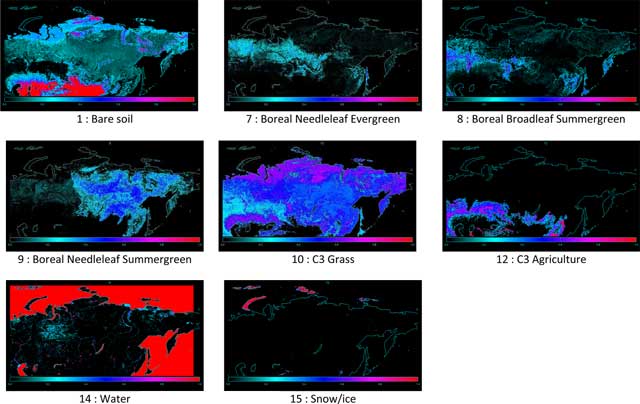
Figure 2
Plant Functional Types (PFT) maps used in ORCHIDEE land surface model. The respective fractions of the following eight classes are represented in colour scale, from blue (0%) to red (100%): bare soil (PFT1), boreal needle-leaf evergreen (PFT7), boreal broad-leaf summer-green (PFT8), boreal needle-leaf summer-green (PFT9), C3 grass (PFT10), C3 agriculture (PFT12), water (PFT14), and snow/ice (PFT15) (Source (Ottlé et al., 2013)).
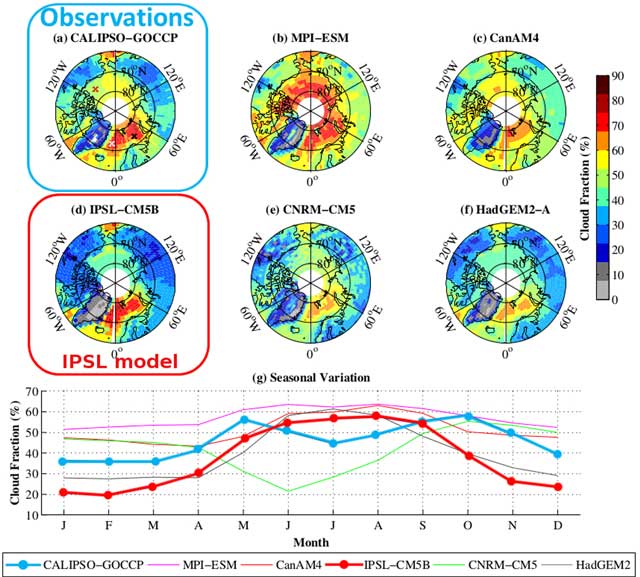
Figure 3
Annual mean Arctic low cloud cover. (a) Observations CALIPSO-GOCCP (highlighted with a blue box). (b–f) CMIP5 Climate models, with the IPSL-CM5B highlighted with a red box. (g) Seasonal variation over open ocean (60°N—82°N without land), blue circles represents de observations CALIPSO-GOCCP and red circles the IPSL-CM5B model (Modified from Cesana and Chepfer (2012)).
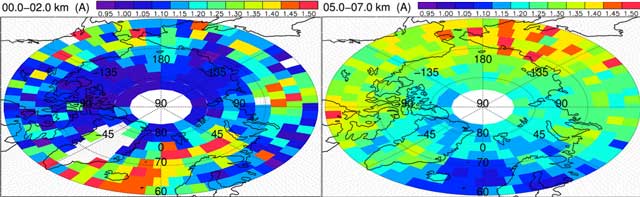
Figure 4
Map of the 532 nm backscatter ratio using the April 2008 filtered level 1 CALIOP data in the 0–2 km (left) and in the 5–7 km (right) altitude range. Colour scales are in relative units (modified from Ancellet et al. (2014)).