
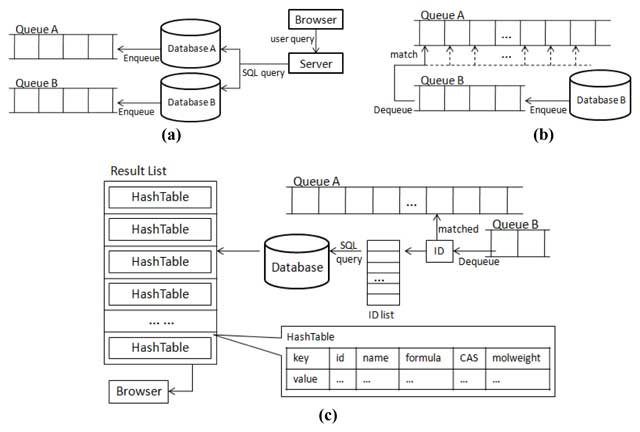
Figure 1
The design of the synchronous search strategy.
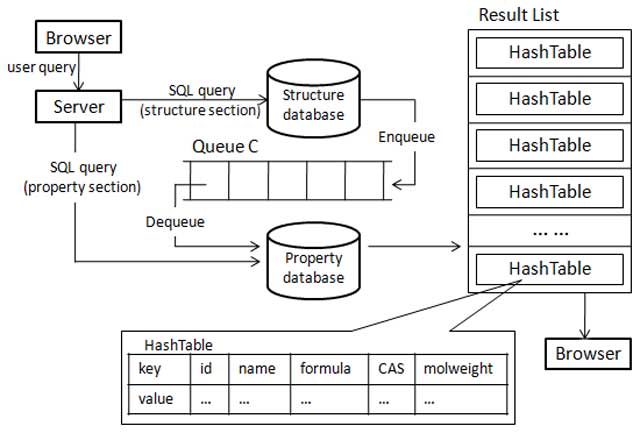
Figure 2
The design of the asynchronous search strategy.
Table 1
The partial combination queries for the comparison experiment.
| NO. | Structure Limit | Search Type | Property Limit | Result Number |
|---|---|---|---|---|
| 1 |  | substructure | Molar Mass [0,200] Formal Charge [0,0] Solubility(logS) S:mol/L [-1,1] | 100/50/20 |
| 2 |  | substructure | Molar Mass [0,200] Formal Charge [0,0] | 100/50/20 |
| 3 |  | substructure | Molar Mass [300,500] Formal Charge [0,0] Number of Hydrogen Bond Ligand [1,20] | 100/50/20 |
| 4 |  | substructure | Molar Mass [100,300] Formal Charge [0,0] Solubility(logS) S:mol/L [-1,1] | 100/50/20 |
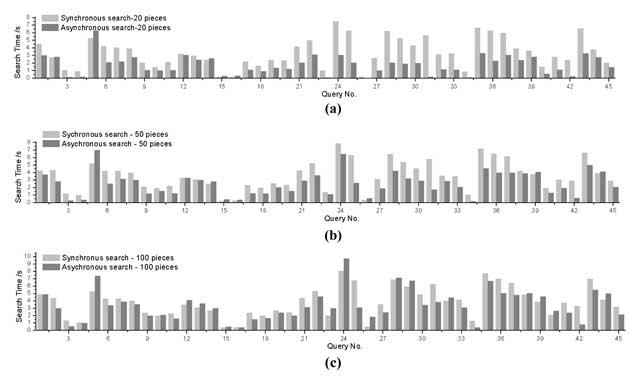
Figure 3
Test statistics of the queries. (a), (b), (c) show the performance when the search returns 20, 50, 100 result records.
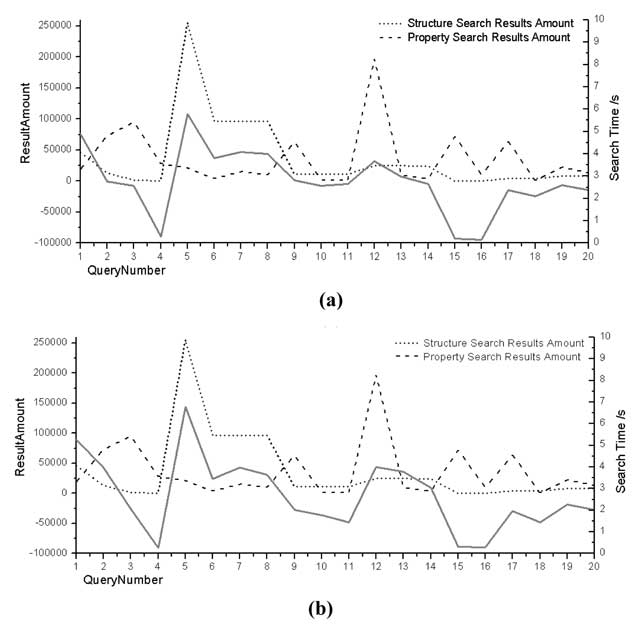
Figure 4
The statistics of the combined search for 100 results records. (a), (b) respectively depict the performance of the synchronous search and the asynchronous search.


