
Introduction
Well-planned citizen science projects have clearly defined intended impacts across domains including data and knowledge generation, participants and communities, and the environment. Success will be determined, in part, by who participates (Pateman and West 2023). This is particularly important given the demographics of citizen science participants often do not reflect those of wider society (NASEM 2018; Waugh et al. 2023). Marginalised groups (those systematically excluded or disadvantaged in society) are less likely to participate, missing out on benefits such as gaining new skills, knowledge, and scientific capital (Pateman and West 2023). Unequal representation can also skew or create gaps in scientific data, thus compounding environmental justice issues if datasets are used to target resources for environmental protection and improvement (Blake, Rhanor, and Pajic 2020; Grineski, Collins, and Mullen 2022; Mahmoudi et al. 2022). In co-created projects, only the priorities of those “in the room” are considered when deciding the direction of research, with needs of the underrepresented potentially being excluded from any arising impacts.
Knowing who participates is, therefore, essential for citizen science evaluation and impact assessment. Participant demographic information can be used in formative evaluation to develop strategies to make projects more inclusive. In summative evaluation and impact assessment, it can be used to assess who a project reached (Land-Zandstra, Agnello, and Gültekin 2021), to consider the consequences for project outcomes, and to inform future project design. However, many projects do not collect participant data. Waugh et al. (2023) found demographic data was reported in only ~7.5% of 157 scientific papers on citizen science. Where demographics are reported, they are often limited in scope and do not assess intersectionality (how combinations of different characteristics interact to affect participation).
Currently there is a lack of guidance for citizen science practitioners on how to design and deploy inclusive and robust demographic surveys. Various guidance exists to support impact reporting in citizen science, including gathering participants’ experiences and feedback (e.g., DITOs consortium 2019; JNCC 2024). While some highlight the importance of gathering demographic data, guidance on how to design and disseminate surveys (the most common way of collecting this information) is missing. This may deter data collection, especially where project staff lack confidence or expertise, or result in poor-quality, inconsistent datasets. At worst, surveys may be unintentionally insensitive and exclusionary, particularly to those from marginalised groups (Hughes et al. 2022), and deter further participation (Li et al. 2024). By contrast, intentional design of survey questions to ensure they are sensitive and accessible to diverse populations is an act of inclusion which can help everyone feel welcome in citizen science.
To address this gap, we present guidelines for designing ethical and inclusive participant demographic surveys for citizen science. While general best practice guidelines exist in social science literature (e.g., Hughes et al. 2022), here we aim to make up-to-date advice accessible to citizen science practitioners and researchers, particularly those less familiar with social science methodologies. Furthermore, we tailor our guidelines specifically to the citizen science context. In part 1, we discuss general survey design considerations for citizen science projects, including defining aims; when and how to deploy surveys; ethical, legal and institutional considerations; and incorporating principles of co-design. In part 2, we cover how to write questions about demographic characteristics particularly relevant to citizen science, offering advice on the circumstances in which these may be relevant and good practice for wording. Our article begins describing the process we used to develop these guidelines, and we conclude by discussing our aim to give more citizen science practitioners the confidence and skills to design and deploy effective demographic surveys to evaluate their projects, and the importance of doing this carefully as we strive for greater inclusion in citizen science.
Methods for Development of Guidelines
We conducted a rapid search of the academic and non-academic literature for (1) dedicated guidance on demographic surveys in citizen science, and (2) descriptions of surveys of citizen science participants with associated justification and/or evaluation of their effectiveness. Web of Science and Google were each searched using the terms [“citizen science” AND “participant demographics”], [“citizen science” AND “participant diversity”] and [“citizen science” AND “participant survey”]. The first 25 results from each of the six searches were screened for relevance. We also searched citizen science books and websites for best practice guidance. Full details of these searches and results are presented in Supplemental File 1.
Searches revealed resources relating to ethics, inclusion, and measuring impact, but we found no dedicated guidance on demographic survey design for citizen science. We found 34 descriptions of demographic surveys in citizen science (detailed in Supplemental File 1). This showed that the demographic characteristics most frequently asked were age, gender, and education level (Figure 1). However, these studies rarely included justifications for how and why particular questions were asked.
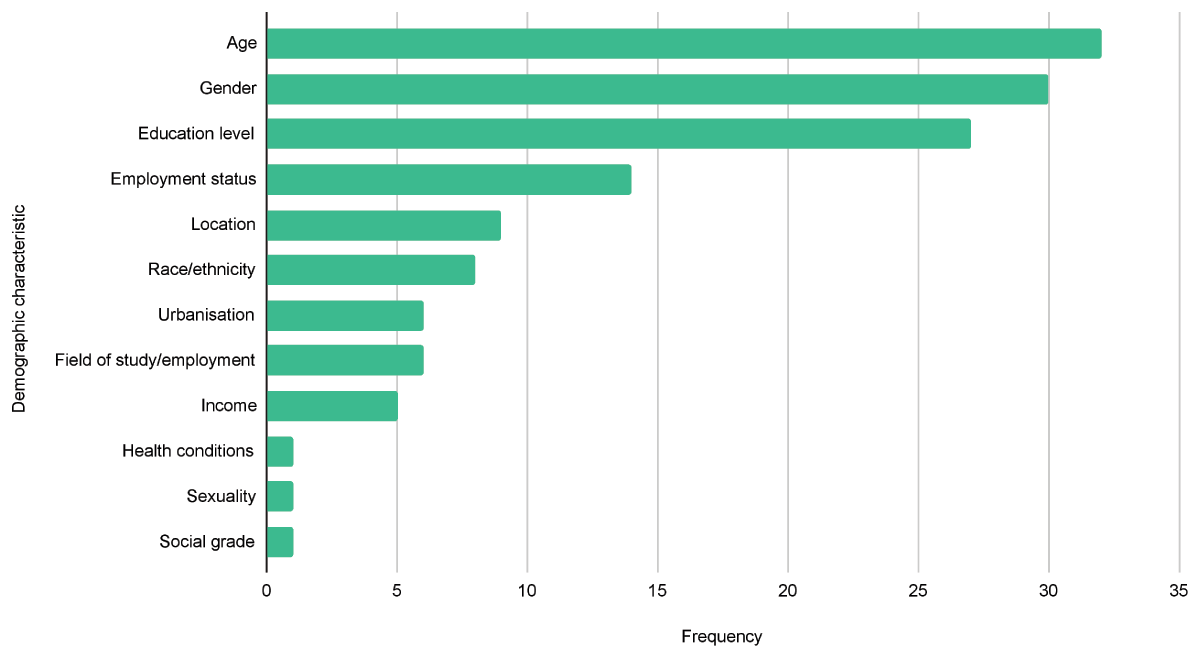
Figure 1
Frequency of inclusion of demographic characteristics in surveys identified in 34 papers in review.
Because of the gap in available guidance, we drew on three sources to create guidance for conducting demographic surveys in citizen science. First, we used our own experience, following the example of Hughes et al. (2022). We are United Kingdom (UK)-based citizen science researchers and practitioners, with experience working outside of the UK (e.g., Pateman et al. 2025). Our research focuses on inclusion in citizen science (e.g., Pateman and West 2023), and we have designed and deployed demographic surveys for evaluation in citizen science projects (e.g., Pocock et al. 2023). The lead author is undertaking PhD research into citizen science for increasing audience diversity in cultural heritage institutions, including developing and deploying a global survey of participants. We also bring equity, diversity, and inclusion (EDI) experience from our research, advocacy, and lived experience.
Second, we consulted social science literature on general survey design good practice (Bickman and Rog 2008; Fowler 2009; Groves et al. 2009) and inclusive demographic survey design (Hughes et al. 2022). To ensure our recommendations are up-to-date, we reviewed question wording advice from government bodies responsible for collecting demographic data such as the UK Office for National Statistics (ONS) and Eurostat; and charities such as Equally Ours and Stonewall that are leaders in areas of inclusive language, equality, and human rights.
Third, we consulted with citizen science and EDI experts from the wider Inclusive Citizen Science Group at the Stockholm Environment Institute York and the UK Joint Nature Conservation Committee (JNCC), which helped refine our guidance based on real-world experiences of designing and deploying demographic surveys for citizen science.
Positionality statement
The authors’ lived experience impacts this work by shaping our understanding of demographic characteristics through our experience of language, and cultural and social norms (Cooper et al. 2024). Within the author team there is lived experience of disability, living in poverty, being LGBTQ+, being women, pregnancy, and parenthood. We also have professional experience of working with diverse intersectional communities both in the UK and internationally, though all authors’ main lived experience comes from living in the UK. In producing these guidelines, we have drawn on our own experience of disclosing these characteristics in surveys while acknowledging that our individual experience is not representative of a whole group. We also acknowledge characteristics that afford us privilege, such as being white researchers. This means that for questions around race, cultural identity, and religion, we have leant solely on literature resources, as opposed to any lived experience. We also acknowledge that our lived experience as white researchers may mean we understand other guidance through a lens that may be inaccurate given the power imbalance in society.
The authors studied in UK universities, influencing the way we approach research and impact assessment with our training in the context of a globally western research practice and understanding of knowledge production. With two authors’ disciplinary backgrounds in physics and materials engineering, we were able to reflect on their early experience of navigating social science research to produce guidelines that are practical and accessible for those new to survey design.
Inclusive Demographic Survey Design Guidelines
The guidelines we present here do not state what a survey “should” look like but instead use prompts and guidance to support the design of surveys appropriate for specific aims and contexts. A worksheet (Figure 2) is available to download (Supplemental file 2) for practitioners working through the guidelines. Although the guidance is broad, examples come largely from our experience of working in the UK. An example survey for a UK-based citizen science project with justification of design decisions is also available (Supplemental file 3).
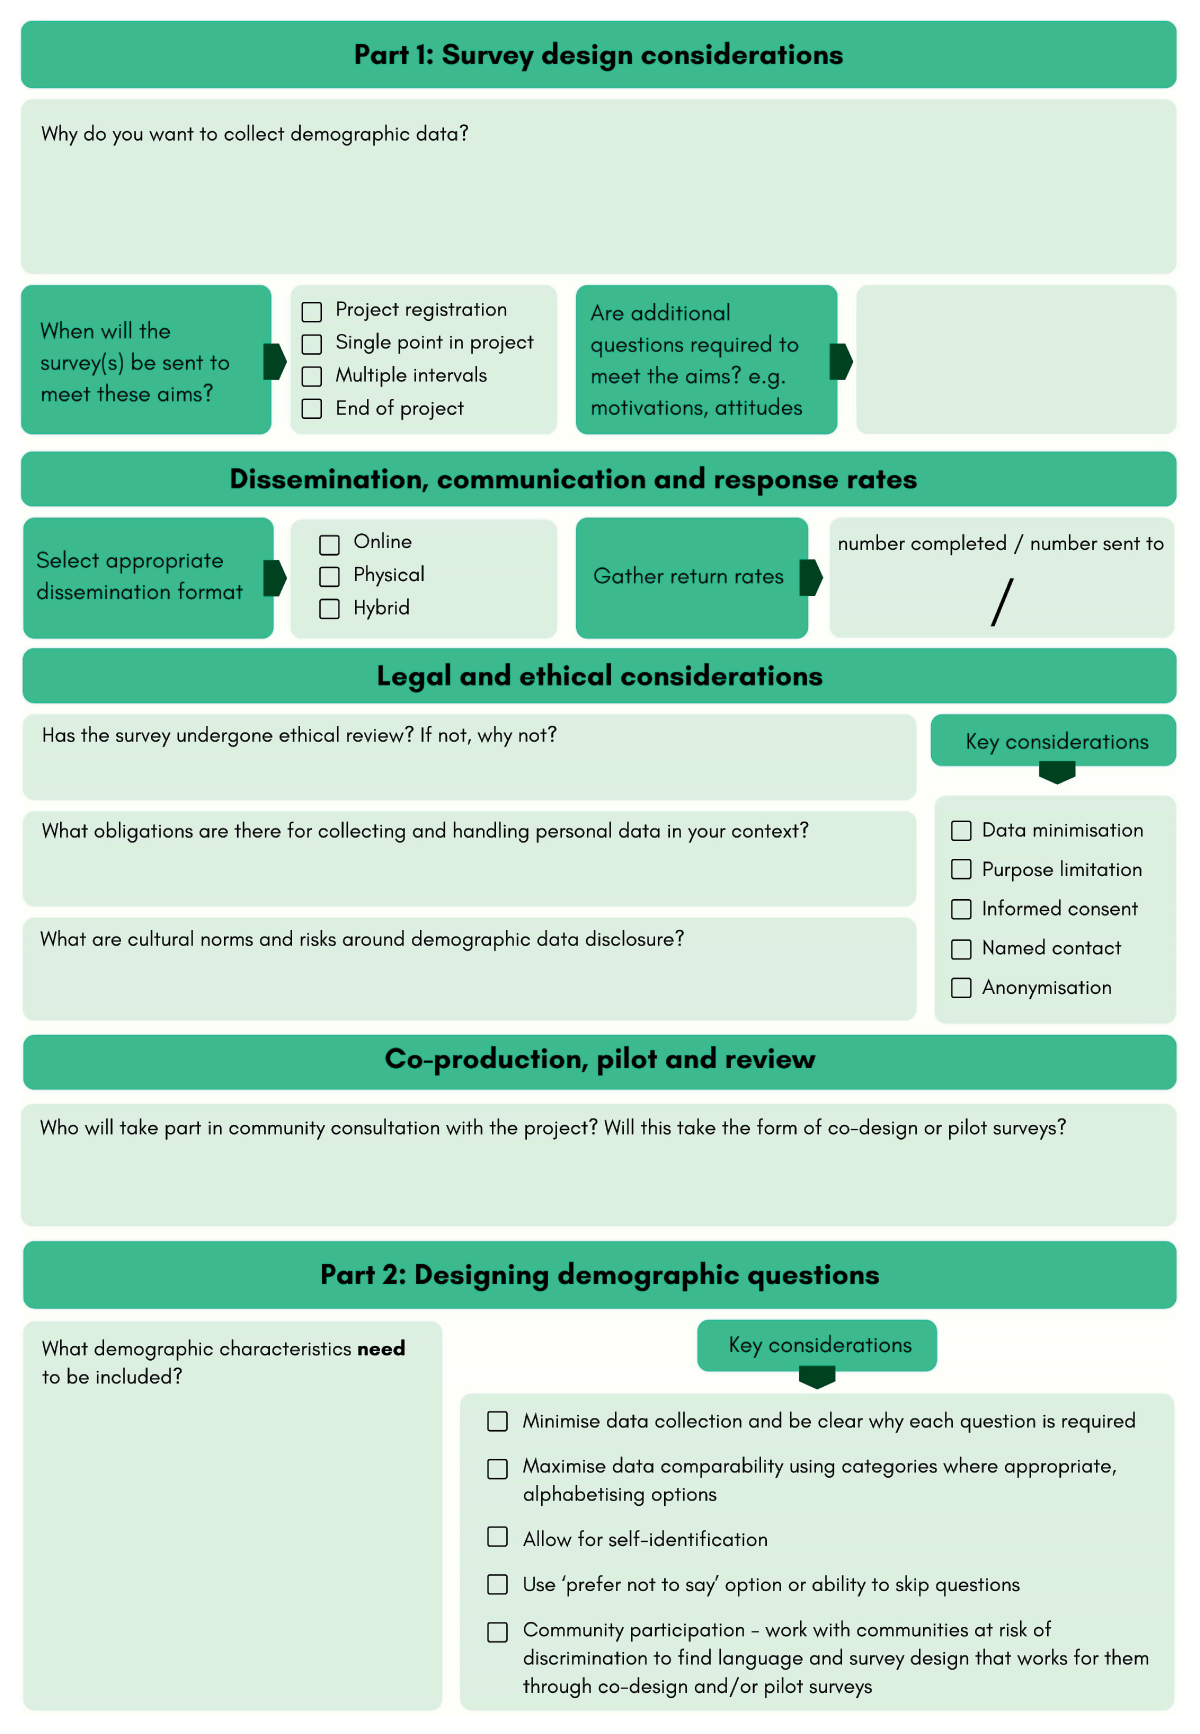
Figure 2
Inclusive demographic survey guidelines worksheet with questions to guide decisions throughout survey design.
Part 1: Survey design considerations
Here, in part 1, we provide overall considerations for running demographic surveys for citizen science projects.
Aims
Defining clear aims is foundational for a demographic survey. Aims can be diverse. For formative evaluation, surveys can help to identify groups currently underrepresented in a project, informing future activities to increase inclusion and ensure the project achieves its intended outcomes. Follow-up surveys can assess if interventions to reach new audiences were effective. For summative evaluation and impact assessment, demographic data helps to document who the project reached and how this affected its outcomes.
Timing
These aims will inform decisions about the timing of surveys, alongside considerations of reach and participant burden. Collecting demographic information during sign-up will reach every participant at a consistent point, document the overall reach of a project, and track changes in participant demographics over time for long-running projects. However, it may deter people from completing the registration process if it becomes overly burdensome (Jay et al. 2016). Not everyone who signs up will go on to participate so this should be considered when interpreting results. One-off, optional surveys place less burden on participants and can provide a useful snapshot for summative evaluation (if deployed at the end of a project) and formative evaluation (if deployed midway through) but cannot track changes over time, unlike periodic surveys sent at regular intervals (e.g., Bruckermann et al. 2021). Periodic surveys also have a greater chance of capturing people who participate only for a short time, and are useful for tracking changes in participation in response to interventions, or differences in retention rates between demographic groups. However, too many surveys could lead to survey fatigue.
Additional questions
It may be useful to include questions in addition to those on demographic characteristics. Questions at signup on motivations, aspirations, and potential barriers to participation can help explore how the project is working for different groups (MacPhail, Gibson, and Colla 2020) and inform project design, supporting formative evaluation of projects that aspire to being inclusive (Pateman et al. 2026), providing a baseline against which to assess project successes. Similarly, additional questions post-participation can help assess experiences and outcomes for different groups to support summative evaluation and impact assessment. Adding questions to demographic surveys reduces survey fatigue compared with deploying them separately, but results in longer surveys, which may be off-putting. Question order should also be considered. It is common to start with straightforward questions, followed by those that are more in-depth, and then demographics. However, if demographics are the primary focus, it may be sensible to put these questions first.
Dissemination, communication, and response rates
Response rates for demographic surveys vary (e.g., in four German citizen science projects, response rates were from 27.1% to 78.6% [Moczek, Hecker, and Voigt-Heucke 2021]) and may differ between demographic groups, with evidence of lower rates from marginalised groups (Goyder, Warriner, and Miller 2002; Dembosky et al. 2019; Harrison et al. 2020). Inclusive survey design and clear communication can encourage participation and reduce biases. For example, in one study nearly half of citizen scientists said they never completed surveys but after they were presented with findings, survey outcomes were valued, and some stated they wished they had responded (Moczek, Hecker, and Voigt-Heucke 2021).
The way in which surveys are deployed also influences return rates. Digital dissemination is common, particularly for participants who are comfortable online (Bickman and Rog 2008). However, these requests can be easily missed or ignored, and inequalities in digital accessibility may affect representativeness of responses (Harrison et al. 2020). If projects run physical events, deploying surveys in person gives added opportunity to communicate their purpose and answer participant questions. However, not all participants may be present, and projects should consider confidentiality issues and costs of printed surveys. A hybrid approach with physical and digital survey options may meet the different needs of participants (Wu, Zhao, and Fils-Aime 2022).
Calculating return rates and using insights about who is responding (e.g., for in-person surveys it may be possible to observe who is/is not completing surveys) is important to contextualise survey results. Higher return rates may indicate results are more representative of the overall population (though may still omit key minority demographics); whereas low return rates may impact confidence in results. When reporting results, declare any limitations and avoid generalizations across participants as the sample may not speak for the entire population.
Legal and ethical considerations
Legal requirements relevant to the context in which surveys are deployed must be considered. For organisations in or interacting with the European Union, the General Data Protection Regulation (GDPR) applies. The UK’s seven principles of GDPR—transparency, purpose limitation, data minimisation, accuracy, storage limitation, security, and accountability—provide clarity on good practice regardless of context (ICO 2024). Full exploration is beyond the scope of this paper, but we highlight some key considerations herein.
For many projects, especially those run by universities, Institutional Review Boards (IRBs; also known as Ethics Committees) provide guidance on ethical, legal, and cultural considerations and approval for survey deployment (Capili and Anastasi 2024). Developing an openly-available data management plan will support many of the decisions discussed here (Science Europe, no date).
Always follow the principle of data minimisation: Ask only what is relevant, necessary, and can be justified based on the defined aims. Do not use the data collected for purposes beyond those communicated to participants when they completed the survey. Ensure participants can give informed consent based on information about who is collecting the data and why, and how it will be stored, processed, and deleted. Where participants are minors or vulnerable adults, they may need a parent/guardian to consent for them. Name a person who can be contacted with queries about the survey. Inform participants of their right to withdraw, and the point after which this is not possible (e.g., if surveys are completed anonymously, withdrawal may not be possible once responses are submitted).
We recommend that demographic data should usually be anonymous at the point of collection (i.e., names or other information that could identify someone should not be collected). Be aware participants may become unintentionally identifiable, for example if there is a small number of respondents overall or in certain demographic categories, especially where categories are combined to explore intersectionality. If demographic characteristics are connected to other information (e.g., participation patterns, feedback), then separate the datasets and limit access to the combined dataset to those conducting analysis. In some cases, there may be justification for collecting names; for example, when working with advocacy groups, it may be important that individuals’ identities are reflected in outputs. Project leaders should consult closely with participants in such cases. Dynamic informed consent, where participants are asked if they would prefer anonymisation every time their data is shared, can promote agency and shared ownership.
Co-design, piloting, and review
Co-designing surveys with participants to ensure they are accessible, inclusive, and culturally appropriate aligns with the citizen science principle of involving participants in different stages of the research process (Robinson et al. 2018). This could include decisions about how a survey is deployed and communicated, which questions are included, the language used, and which response categories are presented. Describing aspects of identity is inherently personal and can be particularly sensitive for marginalised and indigenous communities who may have been subject to extractive research practices in the past. Co-creation and community consultation can help to make sure practices benefit communities, respect their ownership, and centre their voices, as supported by the CARE (Collective Benefit, Authority to Control, Responsibility, and Ethics) Principles for Indigenous Data Governance (Carroll et al. 2020).
Running a pilot survey with a small group of participants can test if questions give the information needed and provide feedback about required changes to survey design (Fowler 2009). Language and societal expectations are always changing, so if surveys are deployed at regular intervals or are continuously open, good practice should be checked regularly. This is particularly important if running demographic surveys outside of your own community (Mondain, Bologo, and Arduin 2010).
Part 2.1: Designing demographic questions
Here in part 2, we provide guidance about how to ask demographic questions in surveys. We begin by outlining some general considerations for question design (part 2.1), and then provide guidance for designing questions about different characteristics (age, gender, education level, etc.) (part 2.2).
Response categories: offer categories for respondents to select from
It is common for demographic surveys to offer categories that respondents can select from. These are straightforward to analyse and completion is simple for participants, which may increase response rates (Groves et al. 2009). National or international standards can be used to decide on categories: national censuses are a good starting point as they are relevant to specific contexts. Alternatively, categories can be developed in collaboration with participants, for example, if trying to identify more nuanced patterns of participation within a broader community. Collaboration can help to find language that is comfortable for participants and best reflects their identity.
Categories often differ between geographical and cultural contexts so these will need to be collated in surveys with an international audience (e.g., the OECD offers comparison of some demographic data across its members [Balestra and Fleischer 2018]). If comparison with existing datasets—relating to citizen science participants or the wider population—is required, categories should align with these (Fowler 2009). Presenting options in alphabetical order is good practice; putting majority categories first can be convenient for majority audiences but can reinforce marginalisation.
Make it optional
It is best practice to always offer a “prefer not to say” option or the ability to skip a question. This shows respect for participants’ privacy and gives them the ability to omit questions that they are uncomfortable with.
Allow self-identification (ideally in addition to response categories)
It is also good practice to allow respondents to explain their identity in their own words. For some respondents, this will feel more comfortable than fitting into predefined boxes. However, the lack of a controlled vocabulary makes analysis more complex, and for some respondents, answering open text questions will require more effort and may be off-putting (Bickman and Rog 2008). A hybrid option is to provide categories and space for self-identification. If taking this approach, avoid using the term “other” as it gives the notion of dominant, “normal” identities being separate from a second group who are “different” (Staszak 2020). Current guidance is to give the option to “prefer to self-identify” with space for open text response.
Part 2.2: Guidance for asking about individual characteristics
The demographic questions described here are based on characteristics protected in anti-discrimination laws (European Union, UK, United States [US], and Australia) and relevant to citizen science (Figure 1). The choice of which characteristics to include in any specific survey should be guided by its aims and adherence to principles of data minimisation. Legal constraints should also be considered (e.g., Germany and France do not allow the collection of ethnicity data) and cultural context (e.g., in some countries and cultures, certain gender identities or sexual orientations are illegal or stigmatised; in others it is taboo to ask about disability or income).
Age
Age is frequently asked in citizen science surveys (Figure 1). Asking date (or year) of birth allows for greatest detail and comparability with different datasets, but may appear intrusive. Therefore, we recommend using non-overlapping age group categories that align to typical life stages, for instance: under 18; 18–24; 25–34; 35–44; 45–54; 55–64; 65+ (Hughes et al. 2022). These can be broken down (or aggregated) depending on the specific aims and audience; for example, if focusing on the detail of participation by younger or older people, more categories within these ranges can be added.
Disability
Few citizen science surveys ask about disability (Figure 1), and clear justification is needed to include a question on this due to sensitivity of the topic; for example, health-related projects may have a particular need for this information. However, failing to ask about disability may mean that projects overlook accessibility needs and the opportunity to capture information that can be used to make projects more inclusive. Thus, if including a question on this, carefully consider the level of detail needed and whether it is justified (e.g., if separating mental and physical disability is required). In some countries, there are very clear definitions of disability (e.g., under the UK Equality Act 2010) which will influence responses unless another definition is clarified in the survey. It is best to ask if people consider themselves to have a disability to include those who do not want or cannot access a diagnosis. Where appropriate, consult with participants to use terms that individuals are most comfortable with; for example, the term “disabled people” is often preferred because it reflects the social model of disability: People with impairments are disabled by barriers in society, rather than a disability being caused by the person (Disability Rights UK, no date), but others prefer the term “person with a disability” as it puts the person first and doesn’t define them by their disability.
Education level, employment status, and science capital
Information about education and employment can be used to understand participants’ existing familiarity with science, which is valuable because seeking to develop science capital is a common goal for citizen science projects (Edwards et al. 2018). National and international standards with detailed occupation and education categories can be used; for example, Bruckermann et al. (2021) used the International Standard Classification of Education (ISCED) in their survey of citizen scientists. Asking for the highest education level attained (such as secondary/high school; apprentice; undergraduate university degree; postgraduate degree) is common and simplifies analysis while providing sufficient detail to compare with other datasets. Asking about employment status (e.g., full-time employed; part-time employed; student; retired; unemployed looking for employment; unemployed not looking for employment) may also be helpful. A description of participants’ occupation or field of study can help understand their level of familiarity with science (Edwards et al. 2018), although might exclude those not in work or study. In one online citizen science project, Planet Hunters, volunteers were simply asked “Do you have a background in science?” (Depper 2019).
Gender and sex
The terms gender and sex are sometimes incorrectly used to mean the same thing. While some countries have a long history of non-binary gender identities, discussion of gender as separate from sex is more recent in English sources (Li et al. 2024). Sex refers to “the categories of male and female, which are assigned to a person on the basis of their primary sex characteristics (genitalia) and reproductive functions” whereas gender is “a person’s innate sense of being a man, woman, non-binary, or another gender,” and gender identity may not align with sex assigned at birth (Stonewall, no date). For most citizen science projects, it is unnecessary to know about someone’s sex—it is most appropriate to ask about gender. Asking people to self-describe their gender identity can be sufficient, although it may be necessary to provide an explanation of the term for clarity (Hughes et al. 2022). Where response categories for gender are used, consider cultural context for language as this shifts with time and place (Li et al. 2024). Sex may be justifiable for health research, or if a survey is being used to understand the experience of transgender people. In these cases, consider adding an option for “intersex,” recognising people who do not fit the male/female binary at birth.
Location
Participants’ household location can help understand biases in data or if barriers to participation differ in rural versus urban areas, for example. Use the least detailed measure possible to protect participant privacy (i.e., country or state rather than postal code). Refer to local government guidance for standard regional divisions such as the UK’s International Territorial Level (ITL), or the NUTS2 in the EU. Some digital survey tools allow the collection of IP addresses to show location data, but participants must be informed this is being collected, and how and why it is being used. For some purposes (e.g., to understand the coverage of data), the location of sample sites will be of interest rather than the home location of participants (e.g., Blake, Rhanor, and Pajic 2020).
Race, ethnicity, and cultural heritage
The terms “race” and “ethnicity” are often confused or combined. While race is used in the UK and US census, it is usually recommended to use the term “ethnicity” (or ethnic origin) in citizen science contexts because it links to people’s self-defined identity rather than their appearance (ONS no date) and influences many aspects of perceived or actual lack of inclusion in society (Pew Research Center 2019). The term “cultural heritage” can also be helpful, particularly for people who are travellers, indigenous, or have multiple racial or ethnic identities (Warwick University 2023). Designing questions on ethnicity can be challenging. There is no global standard, so questions must be designed for the specific context (Balestra and Fleischer 2018). Suggested categories often legitimise some identities but miss others (Williams and Husk 2013); and evolving definitions of ethnic groups make questions difficult both to design and answer (Williams and Husk 2013). Government census organisations should be able to provide best practice, or you may engage with groups of potential respondents to co-design survey language appropriate to them.
Asking “What is your ethnicity and/or cultural heritage,” having the option to select multiple categories, and providing a free text box allows for expression of identity in participants’ own terms.
Religion and belief
Surveys of citizen science participants do not regularly ask about religion (Figure 1). However, there may be justifications for doing so, for example, to inform scheduling of events around important religious celebrations or understand people’s willingness to survey particular taxa. The role of religion has also been considered in studies of volunteer motivations outside of citizen science (Penner 2002). For such purposes, asking if participants consider themselves to be religious and/or spiritual rather than their specific religion may be sufficient. If specific religions are listed as response categories, use options relevant to local context (e.g., consulting local census options), and consider including a “spiritual” option for those who do not identify with a particular religion (Hughes et al. 2022).
Socioeconomic background
Socioeconomic background reflects “the relative social and economic position of individuals or households within a stratified society” (Mandal and Hossain 2025, p. 2,423) and can influence citizen science participation through access to economic capital (Pateman, Dyke, and West 2021). There are various potential indicators, including household income, education level, employment, location, or relevant local indicators of wealth/poverty (e.g., government assistance like free school meals) (APA 2015). Using individual indicators can simplify the complex factors that combine to indicate socioeconomic standing. However, these potentially place people in categories that do not reflect their lived experience. Scales such as India’s Kuppuswamy scale, combining occupation, education, and income (Mandal and Hossain 2025), and the UK’s National Statistics Socio-economic Classification, based on multiple dimensions of occupation (ONS 2016), place people in a social class based on household status. These are well developed and widely used in their contexts so offer useful comparisons for research in these countries.
Sexual orientation
Sexual orientation is defined as “A person’s sexual attraction to other people, or lack thereof” and is separate to gender identity (Stonewall, no date). Sexual orientation is not commonly asked in citizen science surveys (Figure 1) but may be justified in health research or to understand inclusion and experiences of LGBTQ+ participants (Harwell et al. 2023). In such cases, avoid the term “sexual preference” as it implies a choice; instead use “sexual orientation.” Surveys often offer options for bisexual, gay/lesbian, and heterosexual/straight, while also giving a self-identify option with open text response; however, offering a wider range of options with the ability to select multiple options can be more inclusive. Where relevant, work with LGBTQ+ community members to identify appropriate options relevant to the cultural context (Li et al. 2024).
Conclusion
Knowing who participates in a citizen science project is a crucial part of evaluation and impact assessment (Pateman and West 2023). Designing good demographic surveys is therefore both a practical requirement and an ethical practice, but until now, as demonstrated by our review, there has been no consolidated guidance for citizen science practitioners.
Understanding participant demographics is key to assessing project reach, who benefits from taking part, and who is missed. It is important for identifying potential biases in citizen science datasets, and how this might affect decision-making, particularly when this may disadvantage those who are not represented (Blake, Rhanor, and Pajic 2020; Grineski, Collins, and Mullen 2022). Citizen science has potential to change the scientific process, challenging harmful historical practices, and transforming outcomes for participants and communities (Harwell et al. 2023), but if done poorly, it can further exclude marginalised groups. Knowing who participates (and who does not) helps plan for greater inclusion and accessibility by refining projects through formative evaluation and informing design of future projects. Evidencing any lack of representation can help to leverage funding and support for initiatives to make projects more accessible and inclusive (Pateman et al. 2026).
Our guidelines demonstrate how to design and implement surveys in citizen science to support collection of demographic data in a comparable, ethical, and inclusive way. Historical scientific practices mean minoritised participants may be sceptical of disclosing information about protected characteristics when unsure of how they will be used (Williams and Husk 2013; Pho et al. 2023) or may regard questions as irrelevant (Mondain, Bologo, and Arduin 2010). Therefore, we emphasise that it is not only important to collect demographic data but to do so in an inclusive way: being sensitive with language used and respectful of participant privacy. Done well, good survey design can contribute to people’s feeling of inclusion in citizen science, and increase accurate reporting of demographic data (Li et al. 2024).
Assessing participant demographics is not straightforward. These guidelines do not solve all the difficult questions around terminology and survey design: Collaboration with potential respondents and challenging conversations around language and identity may still be required. Following the guidelines will help make design decisions that are better informed by participant and project needs, and are grounded in good principles of data ethics such as data minimisation and privacy.
Collection of demographic data is only the starting point. Although we hope these guidelines help create inclusive surveys and encourage responses from all participants, return rates should be assessed and generalisations avoided where results may not be representative of all participants. In the spirit of citizen science, working with participants to communicate and present results can be a valuable process—giving autonomy to participants over the narrative and ensuring that language used reflects their identities. For example, fear of identification (especially through intersectionality when sample sizes are small) has been shown to stop LGBTQ+ participants disclosing their identity in surveys (Pho et al. 2023).
Despite these challenges, we believe these guidelines will give citizen science researchers and practitioners more confidence to investigate demographic characteristics of their participants and report on this as part of their project impact work.
Supplementary Files
The Supplementary files for this article can be found as follows:
Supplemental file 1
Citizen science literature and websites reviewed. DOI: https://doi.org/10.5334/cstp.999.s1
Acknowledgements
We thank Stephanie Mills and Katrin Bohn (Natural England) for support through the project; Niki Newton and Jasmin Salvati (JNCC) for discussions about their experience designing surveys for environmental citizen science; and Smriti Safaya and Sagarmoy Phukan for offering insights from citizen science experience in East Asia and India.
Author Contributions
RMP and MJOP conceptualised the project; SLL conducted the literature review; SLL and RMP conducted expert consultation; SLL, RMP, MJOP and RA developed the guidelines, wrote the first draft, and edited the manuscript.