
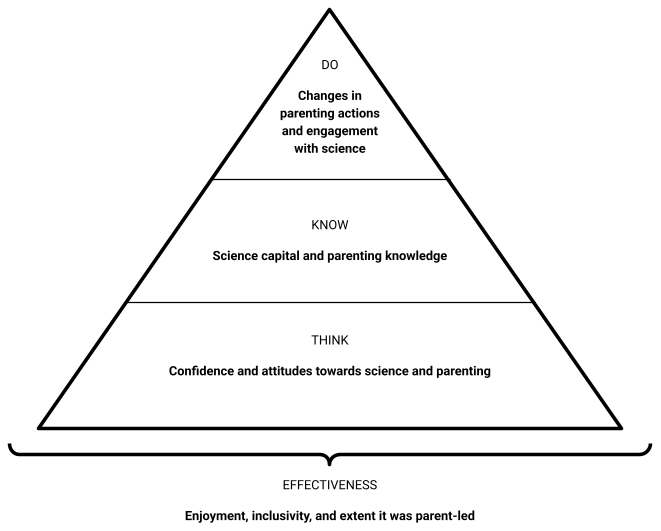
Figure 1
The different dimensions of the project evaluated.
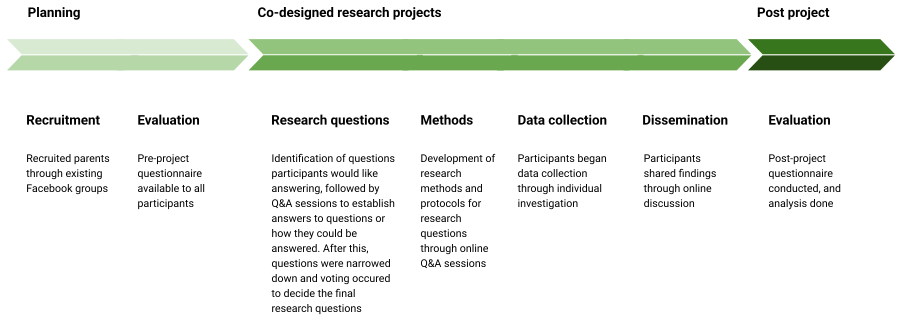
Figure 2
Timeline of the Parenting Science Gang project, showing the different activities that took place.
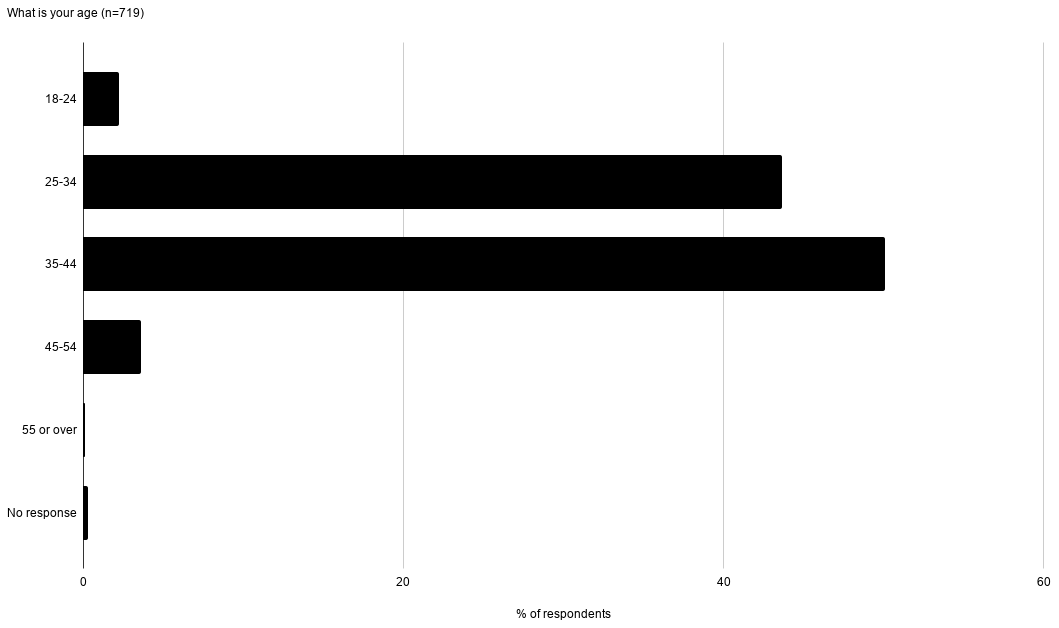
Figure 3
Age profile of Parenting Science Gang members. Data is from the post-survey; n = 272.
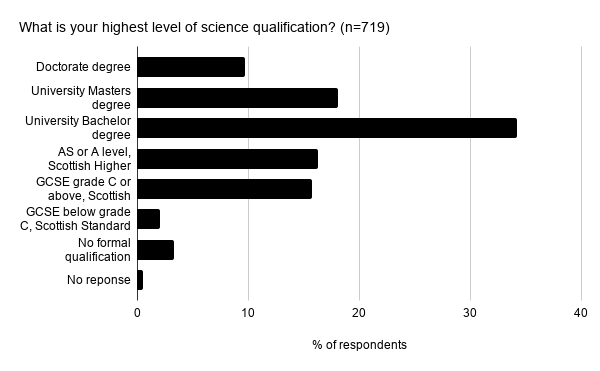
Figure 4
Highest level of science qualification of Parenting Science Gang members, showing that the majority had at least an undergraduate degree. Data is from the pre-survey; n = 719.
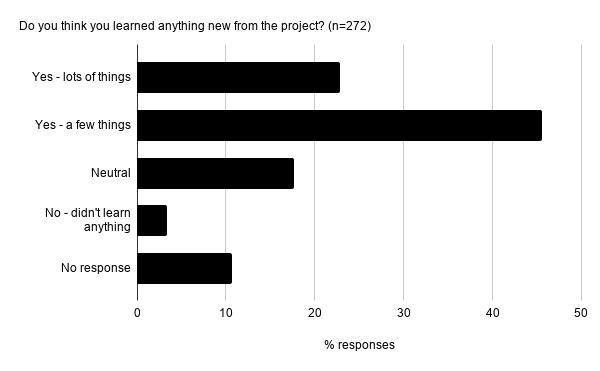
Figure 5
Responses to the post-survey (n = 272) about whether participants had learned anything new.
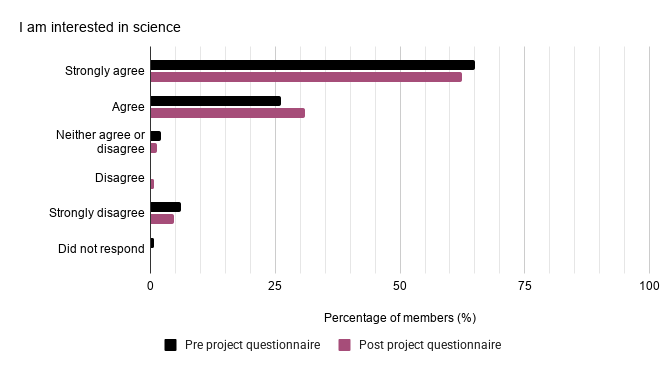
Figure 6
Percentage of participants who completed both surveys responding to “I am interested in science.”
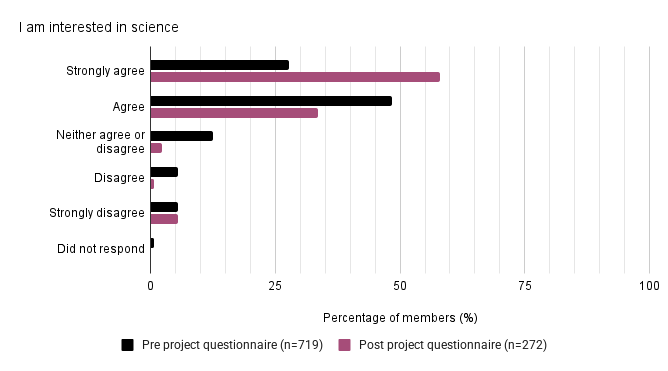
Figure 7
Percentage of participants responding to “I am interested in science.”
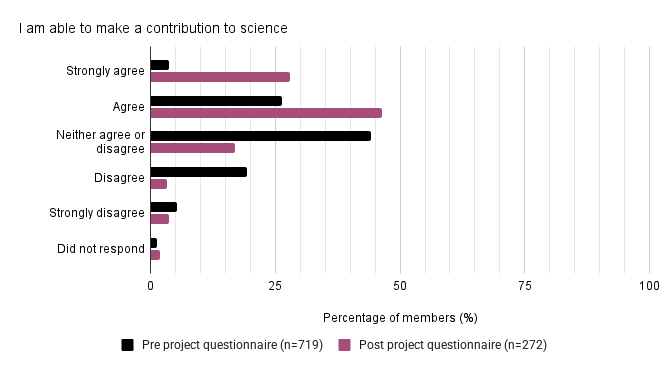
Figure 8
Percentage of participants responding to “I am able to make a contribution to science.”
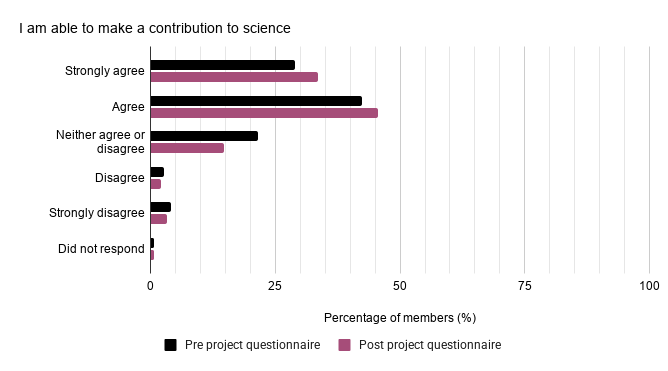
Figure 9
Percentage of participants who completed both surveys responding to ‘I am able to make a contribution to science.”
Table 1
Evaluation of Parenting Science Gang using “Participant dimension” from Kieslinger et al. 2018.
| CRITERIA RELATING TO THE PARTICIPANT DIMENSION | ||
|---|---|---|
| Target group alignment | Does the project have an involvement plan that considers specifics of different target groups? | Yes – each group designed their own engagement strategy |
| Are the options for participation and the degree of involvement diversified (e.g., gamification)? | Partly – had to be on Facebook, but lots of flexibility in how much and which stages to be involved in | |
| Degree of participation intensity | Can citizens participate in various project phases? | Yes – from deciding topic through to dissemination |
| Do citizens and scientists work as mutually respected partners in the knowledge generation process? | Yes – scientists brought in as experts and co-designed methods with parents | |
| Facilitation and communication | Are support and training measures adapted to the different participant groups? | Partly – limited training through the project (mainly through question and answer sessions) |
| Are objectives and results clearly and transparently communicated? | Partly – objectives unclear at times and extent of results communication determined by group and scientist enthusiasm | |
| Do citizens receive regular feedback? | Yes – regularly during lifetime of project (Facebook updates, newsletter, website) | |
| How interactively is communication and collaboration between scientists and citizens organised? | Very – Question and answer sessions led by parents. | |
| Knowledge, skills and competencies | What are the learning outcomes with regards to new knowledge, skills and competencies for the participants? | Varied depending on the participant – high for some. |
| Science literacy | Does the project contribute to a better understanding of science? | Partly - depending on the participant – high for some. |
| Does the project contribute to a better understanding of the scientific topic? | Partly – depending on the participant – high for some. | |
| Behaviour and ownership | Does the project foster ownership amongst participants? | Partly – depending on the participant, but most felt it was parent-led. |
| Does the project contribute to facilitating personal change in behaviour or political citizenship? | Yes – for some participants | |
| Motivation and engagement | Does the project raise motivation, self-esteem and empowerment amongst participants? | No significant difference in confidence talking about science but yes for some participants. |
| Are participants motivated to continue the project or involve in similar activities? | Yes – 95% would take part in a similar project | |