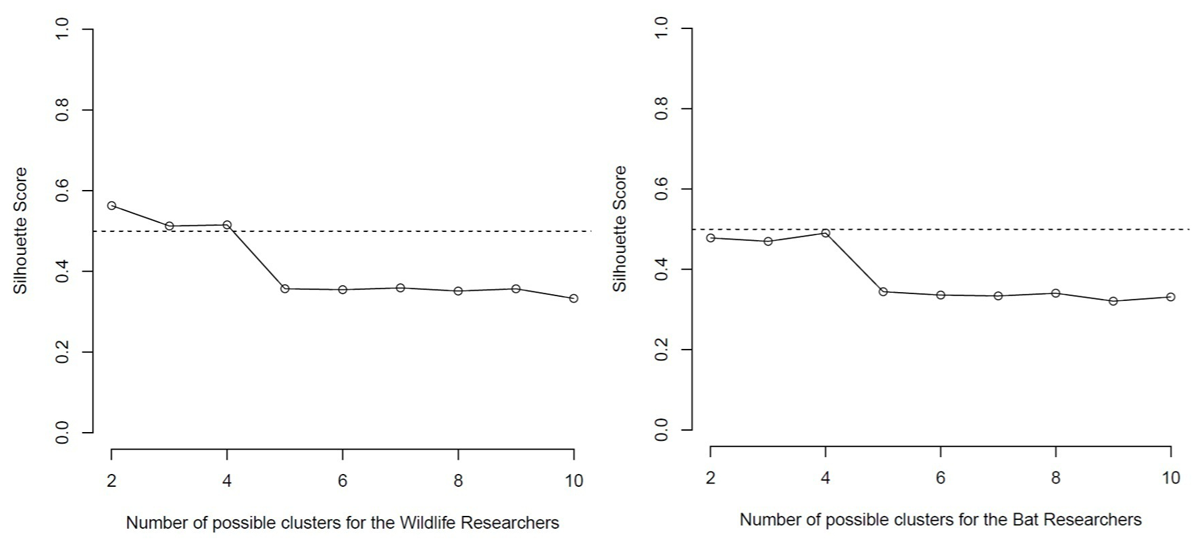
Figure 1
Silhouette scores for two to ten possible clusters for the Wildlife Researchers (N = 847, left) and the Bat Researchers (N = 223, right). The dashed line represents the ideal least Silhouette score.
Table 1
Number of participants (and percentage related to the sample size of N = 847) and age, gender, highest level of education, and status of employment (with percentages related each to the cluster sizes of n = 500, n = 148, n = 152, and n = 47) of the four clusters in the CS project on urban wildlife ecology (Wildlife Researchers). M = mean, SD = standard deviation.
| CLUSTER | CLUSTER 1: ACADEMIC EMPLOYEES | CLUSTER 2: ALL-ROUND WORKERS | CLUSTER 3: ACADEMIC FREE-TIMERS | CLUSTER 4: FREE-TIMERS |
|---|---|---|---|---|
| n (percentage) | 500 (59%) | 148 (17%) | 152 (18%) | 47 (6%) |
| Age: M (SD) | 48.65 (9.35) | 48.73 (10.57) | 65.89 (9.43) | 60.36 (15.75) |
| Gender | 299 Female (60%) 199 Male (40%) 2 Non-binary (0.4%) | 89 Female (60%) 58 Male (39%) 1 Non-binary (1%) | 53 Female (35%) 99 Male (65%) | 20 Female (43%) 27 Male (57%) |
| Education | 45 Technical college degree (9%) 379 College/University degree (76%) 76 PhD/Habilitation (15%) | 2 Secondary education certificate (1%) 24 General secondary education certificate (16%) 6 College entrance qualification (4%) 62 University entrance qualification (42%) 54 Vocational training degree (37%) | 17 Technical college degree (11%) 108 College/University degree (71%) 27 PhD/Habilitation (18%) | 3 Secondary education certificate (6%) 12 General secondary education certificate (26%) 5 College entrance qualification (11%) 11 University entrance qualification (23%) 16 Vocational training degree (34%) |
| Employment | 5 Vocational training (1%) 26 Marginally/Occasionally employed (5%) 156 Part-time employed (31%) 313 Full-time employed (63%) | 2 Vocational training (1%) 12 Marginally/Occasionally employed (8%) 43 Part-time employed (29%) 91 Full-time employed (62%) | 140 Non-employed (92%) 11 Partial retirement (7%) 1 Vocational training (1%) | 41 Non-employed (87%) 6 Partial retirement (13%) |
Table 2
Number of participants (and percentage related to the sample size of N = 223) and age, gender, highest level of education, and status of employment (with percentages related each to the cluster sizes of n = 129, n = 52, n = 23, and n = 19) of the four clusters in the CS project on urban bat ecology (Bat Researchers). M = mean, SD = standard deviation.
| CLUSTER | CLUSTER 1: ACADEMIC EMPLOYEES | CLUSTER 2: ALL-ROUND WORKERS | CLUSTER 3: ACADEMIC FREE-TIMERS | CLUSTER 4: FREE-TIMERS |
|---|---|---|---|---|
| n (percentage) | 129 (58%) | 52 (23%) | 23 (10%) | 19 (9%) |
| Age: M (SD) | 43.43 (10.71) | 39.33 (11.05) | 49.70 (16.69) | 33.11 (12.40) |
| Gender | 78 Female (60%) 50 Male (39%) 1 Non-binary (1%) | 24 Female (46%) 28 Male (54%) | 14 Female (61%) 9 Male (39%) | 13 Female (68%) 6 Male (32%) |
| Education | 9 Technical college degree (7%) 105 College/University degree (81%) 15 PhD/Habilitation (12%) | 1 Secondary education certificate (2%) 10 General secondary education certificate (19%) 4 College entrance qualification (8%) 24 University entrance qualification (46%) 13 Vocational training degree (25%) | 23 College/University degree (100%) | 1 Secondary education certificate (5%) 3 General secondary education certificate (16%) 2 College entrance qualification (11%) 11 University entrance qualification (58%) 2 Vocational training degree (11%) |
| Employment | 7 Marginally/Occasionally employed (5%) 38 Part-time employed (30%) 84 Full-time employed (65%) | 5 Marginally/Occasionally employed (10%) 15 Part-time employed (29%) 32 Full-time employed (62%) | 19 Non-employed (83%) 4 Vocational training (17%) | 15 Non-employed (79%) 1 Partial retirement (5%) 3 Vocational training (16%) |

Figure 2
Percentages of non-active, visiting, and engaging participants during the data collection (a,b) and data analysis phase (c,d) of each cluster of the Wildlife Researchers (N = 847, a,c) and the Bat Researchers (N = 223, b,d).