
Introduction
Publicly available and easily accessible online biodiversity data portals are an increasingly common instructional tool, hobbyist activity, and formal data gathering methodology. Ranging from taxonomically and geographically particular (e.g., Western Monarch Milkweed Mapper) to global (e.g., iNaturalist), these projects increasingly engage K–16 students, adult hobbyists, and professional scientists for the forwarding of pedagogical goals, personal interest and skills, and formal research. While much research has focused on reliability and potential bias within various portals (outlined below), questions remain about how data can be combined across platforms that have different observation protocols and participant recruitment. This project establishes a methodology and merge criteria to assess whether iNaturalist (hereafter, iNat) and eBird observations of the same Northern California bird species can be meaningfully combined to model trends in seasonality of bird presence.
Herein, we use the term participatory science to refer to publicly available programs and platforms through which amateur and nonprofessional scientists engage in scientific research through question development, study design, data collection, and analysis. People who post observations to iNaturalist or eBird are referred to as observers.
The iNaturalist platform
iNat first launched in 2008 as a Masters project by graduate students at UC Berkeley (Seltzer 2024). In 2014, it was incorporated into the California Academy of Sciences (CalAcad), and from 2017 to 2023 was jointly managed by the CalAcad and the National Geographic Society. Since 2023, iNat has operated as a 501c3 nonprofit based in the United States. As of November 2024, iNat numbers more than 4.3 million individual observers who have posted more than 242 million observations of more than 505,000 total species worldwide. The iNat platform allows observers to post observations of any organism and provides AI-based suggestions on organism identification. Evidence of the organism (photo or audio recording) is not required, though it is heavily encouraged (as of November 2024, 97.7% of iNat observations included at least one photo and an additional 0.4% included audio). Once an observation is posted, other iNat observers can confirm or refute a given identification based on the provided evidence, and currently over 408,000 iNat observers have contributed identifications to others’ observations. Observations that meet certain data quality assessment criteria, such as including metadata and community agreement on identification, are deemed “research grade,” and observations not meeting these criteria are deemed “casual” observations. Currently, approximately 56.5% of observations are categorized as research grade. Lastly, iNat observations can include additional fields of data, such as sex, age, and type of evidence (for birds, this can include feather and egg). Track, scat, or other signs of an organism (such as nests) can also be posted as an observation. Each observation also has an open-ended notes section in which observers can document behavioral or ecological information. The inclusion of a photograph in observations also allows for ecological or behavioral data to be gleaned from an observation even if the observer did not note it in the moment.
The eBird platform
eBird was first launched in 2002 as a joint project between the Cornell Lab of Ornithology and the National Audubon Society. Initially, the platform focused on the Western Hemisphere, but was expanded to also include New Zealand in 2008, and the entire globe in 2010 (Sullivan et al. 2009; 2014). Observers can submit observations using the eBird website, a mobile app, or by importing lists from other software. The unit of observation is a checklist: a list of the number of individuals of each species recorded at a location within a fixed period of time. eBird guidelines encourage observers to start a new checklist each time they have traveled 5 miles or stayed at a single fixed location for 3 hours, and to submit checklists of all observed birds whenever possible (eBird Team n.d.). By the end of 2023, more than 930,000 birders had submitted more than 1.6 billion bird observations, and several hundred million observations are now submitted each year (eBird Team 2024). eBird observations are quality-controlled through a combination of automated filtering and human review by regional experts. This ensures the review of observations of unusual species or anomalously high counts, and publicly confirmed rare records are generally supported by attached text, photo, or audio evidence (Sullivan et al. 2014). Age and sex of the birds can be noted in the checklist, as well as codes that indicate confirmed or potential breeding. For each species, observers can also upload images and audio recordings and add open-ended text comments.
Data quality in participatory science
Since its inception, the field of participatory science has faced questions about data quality and reliability (studies relating specifically to iNat and eBird are outlined in more detail in the Supplemental File 1: Appendix A). Some studies have shown comparable precision and variability between volunteer- and professional-collected data (Lewandowski and Specht 2015; Kosmala et al. 2016), while others have reported low concordance among datasets and have cautioned against overstating the reliability of participatory science data (Aceves-Bueno et al. 2017). These concerns are being addressed by an increasingly robust collection of literature outlining best practices in data collection and reporting (e.g., Aceves-Bueno et al. 2017), statistically addressing error and bias (e.g., Bird et al. 2014), aligning data from multiple sources (e.g., Schacher et al. 2023), etc. In the words of Stevenson et al. (2021), “blanket criticism of [participatory science] data quality is no longer appropriate” and instead, researchers must consider the particular strengths and weaknesses of a given project’s structure, participants, and data output.
Integrating datasets with different biases, resolution, and sampling methodologies generates its own questions on best practices (Ball-Damerow et al. 2019; Miller et al. 2019; Van Eupen et al. 2021; Randler 2021; see Supplemental File 1: Appendix A for details of differences in user experience between iNat and eBird). Given the prevalence of using data from multiple projects directly or large-scale observation warehouses such as the Global Biodiversity Information Facility (GBIF), the question of how best to integrate data from multiple participatory science projects remains an important one.
Details and objectives of this study
The primary research objective of this project is to develop a methodology and merge criteria for combining individual observation data from different participatory science platforms (iNaturalist and eBird) using quantitative tools rooted in the cyclical nature of seasonality (e.g., circular statistical methods to reflect seasonality in annual records). Here, merging refers to the process of summing weekly species-level observation counts across distinct datasets to form a single dataset, pooling records together across platforms or years to increase the total sample size for downstream visualization and analysis; see Table 1 for a concrete illustration of an example merge for the acorn woodpecker across the iNat 2022 and eBird 2022 datasets. We first express the general trends in how eBird and iNat differ through exploratory statistics. Then, we explore one example of a biological application of cross-platform data: seasonality of migratory bird populations in Northern California. In this exploratory example, we report if and how the seasonality of merged iNat and eBird observation records match known migratory behavior of a subset of Northern Californian bird species. Finally, in the discussion we emphasize the benefits and importance of working together in a multidisciplinary team of domain specialists, quantitative researchers, and project participants with experience contributing and leveraging participatory science data.
Table 1
Example of data merging for the acorn woodpecker across the iNat 2022 and eBird 2022 datasets. The merge process continues like this for the remaining weeks of the year, and repeats across all other species for which databases are deemed mergeable by the proposed merge criteria.
| BIRD | DATABASE | WEEK 1 OBSERVATION COUNT | WEEK 2 OBSERVATION COUNT | WEEK 3 OBSERVATION COUNT | … | WEEK X OBSERVATION COUNT |
|---|---|---|---|---|---|---|
| acorn woodpecker | iNat 2022 | 31 | 42 | 38 | … | y |
| acorn woodpecker | eBird 2022 | 1,568 | 1,480 | 1,463 | … | z |
| acorn woodpecker | Merged | 1,599 | 1,522 | 1,501 | … | y+z |
Methods
Data
We consider the relative abundance of 254 species of birds in Northern California and Nevada, comparing seasonality from iNat and eBird data over 2019 and 2022. For a practical reference to these birds, see, for example, the Field Guide to Birds of California (Jaramillo and Small 2015). We chose a representative year before and after the COVID-19 pandemic, as shutdowns altered overall observer activity in both iNat and eBird, with some regions showing increased/decreased numbers of observations, as well as consistent shifts in observations towards urban or human-impacted environments (Crimmins et al. 2021; Hochachka et al. 2021; Sánchez-Clavijo et al. 2021).
Our dataset was acquired using eBird and GBIF Application Programming Interfaces (APIs), the latter used for research grade iNat observations. Research grade observations from iNat and eBird from 2019 and 2022 were filtered using a bounding box surrounding Northern California and Nevada, with boundaries at [36.470113°, 42.009518°] latitude and [–124.409591°, –114.131211°] longitude (Figure 1). To ensure that frequency curves were accurately estimable, we removed species with sparse observation counts, defined as absent in more than 46 out of the 52 weeks of the year, from any of the datasets. Our analysis was limited to species split taxonomically to the same degree in both datasets (e.g., ignoring subspecies), and excluded taxonomic revisions during the study period. After filtering, our dataset consisted of 254 unique species of birds, with counts of 3,806,983 (eBird 2019), 5,180,666 (eBird 2022), 68,334 (iNat 2019), and 134,312 bird sightings (iNat 2022).
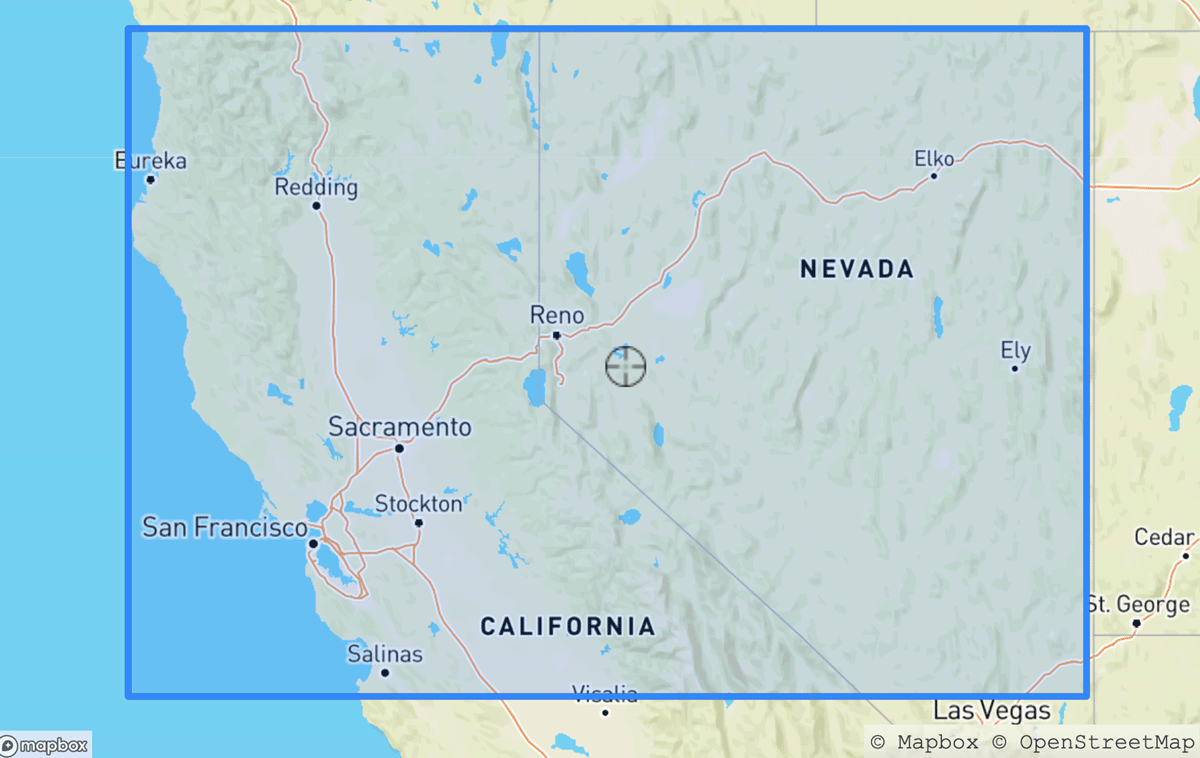
Figure 1
Research grade observations from iNaturalist and eBird were drawn from this region in Northern California/Nevada.
For visualizing seasonal trends, we construct smooth seasonality curves from raw eBird and iNat observation count data, accessible via the NorCal Bird dashboard, which also provides capability to view original unsmoothed frequency data (Carroll and Waterman 2024). Fourier smoothing is used so that resulting densities respect the periodic nature of seasonal trends over the course of a year; visual inspection finds that truncating the Fourier expansion at B = 8 basis functions preserves fidelity to the raw data. Computation is implemented using the R package “fda” (Ramsay et al. 2024). Code is available at the OSF page provided in the Supplemental File 1: Appendix A.
Merge Criterion
To assess whether distinct databases (or years) should be merged for a species, we develop a resampling-based test to evaluate whether two samples of observations are generated from the same underlying density (Figure 2). For analysis, the eBird 2022 data was taken as the baseline and other datasets were compared relative to this reference. Calculations for merging use raw frequency distributions rather than smoothed curves to ensure the merge criteria is not influenced by the choice of smoothing method.
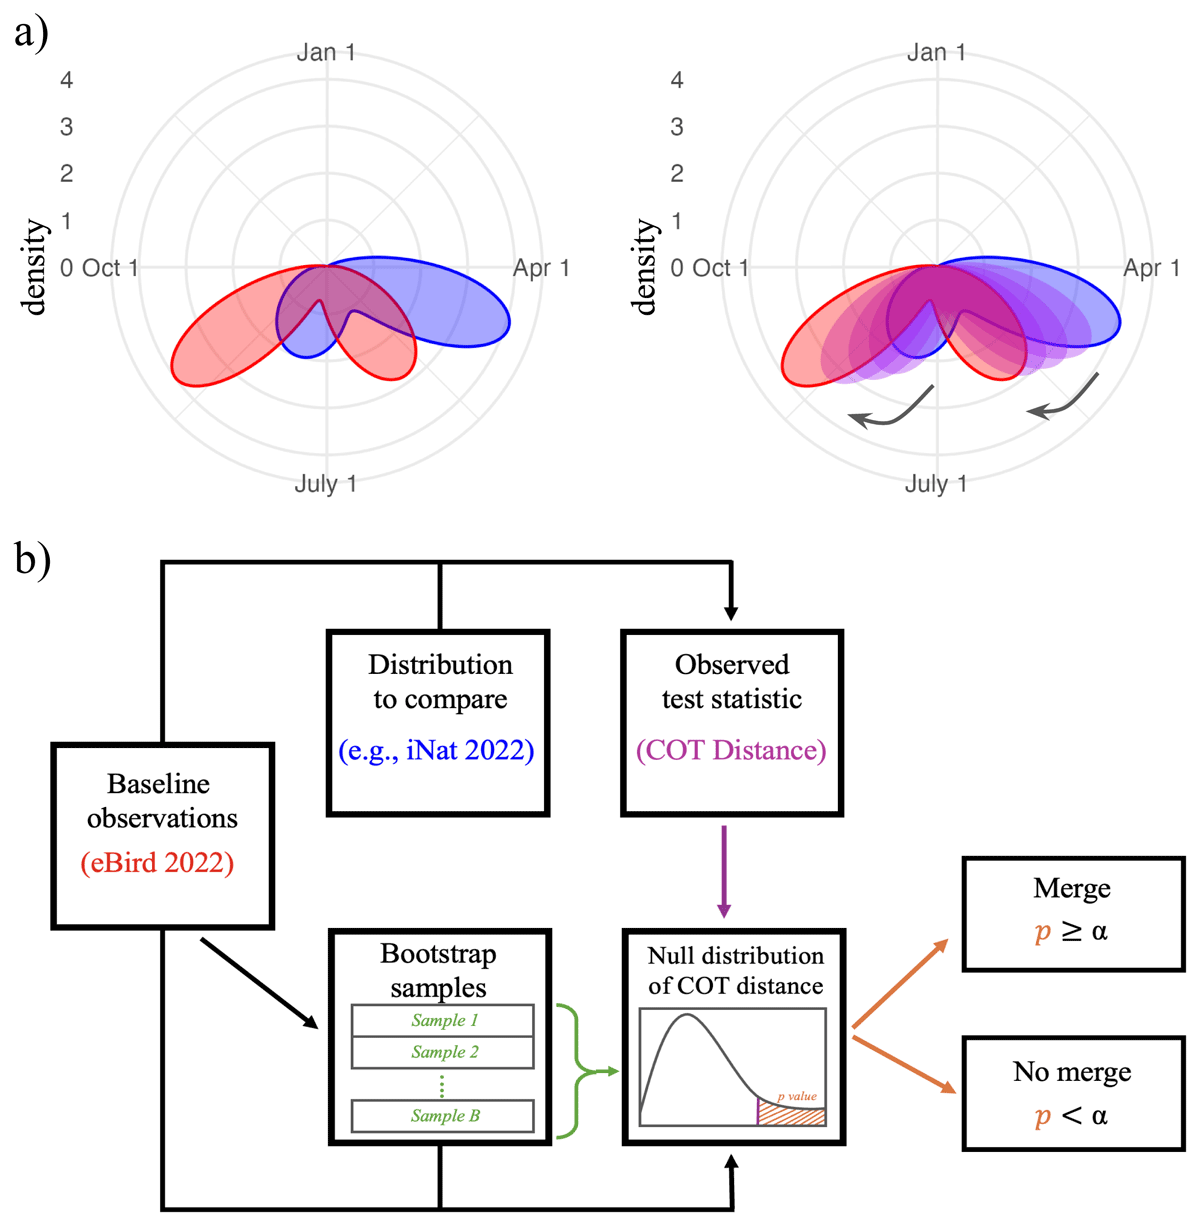
Figure 2
(a) The circular optimal transport (COT) distance quantifies the dissimilarity between two distributions as the energy required to transform one distribution into another, viewing the distributions as mass. (b) A schematic of the merge decision process for a given species. The criterion employs a resampling-based hypothesis test for the COT distance between a baseline distribution (here, eBird 2022) and the merge candidate (in this example, iNat 2022). If repeated for multiple species/databases, merge decisions should be adjusted for multiple comparisons.
Differences between a pair of distributions are quantified with the circular optimal transport (COT) distance (Rabin, Delon, and Gousseau 2011). COT distance is suitable since optimal transport distances compare distributions while respecting the geometry of their support (Villani 2021). We modified a two-sample bootstrap version of the circular optimal transport test (Hundreiser, Klatt, and Munk 2021), described briefly in our context as follows.
Suppose for a given species, we seek to test for a difference between iNat 2022 and eBird 2022 observations. If the test finds a difference, we choose not to merge the two datasets; if not, we allow the merge.
To perform inference, the eBird 2022 observations are resampled to create 10,000 bootstrapped null distributions of the original sample size. The COT distance is calculated between the observed eBird 2022 distribution and each bootstrap-generated distribution; these distances are then used to construct an empirical null distribution of the COT distance. The p-value is the fraction of null COT distances that exceed the observed COT distance between the observed eBird 2022 distribution and the observed comparison distribution. A significant difference is detected if the p-value is less than the significance level. Because hypothesis testing requires the detection of a significant difference to prevent merging, species with low observation counts may suffer from low-powered tests and therefore experience higher false negative rates (i.e., Type II errors). This means the risk of mistakenly merging is higher for species with noisy seasonality signals and low observation counts. In such cases, visual inspection should be used as a secondary measure to confirm merging is appropriate.
One may perform this inferential step for multiple data sources and across many species, introducing multiple comparisons. To correct for several comparisons, we modify the merge decisions of the test using the Benjamini-Yekutieli procedure which controls the false discovery rate (i.e., the fraction of true merges missed) at a given level α (Benjamini and Yekutieli 2001). More concretely, for C comparisons indexed by c = 1, …, C, we sort the observed p-values in ascending order, p(1), …, p(C), and detect a significant difference for all comparisons such that , where . For our analysis we have C = 3 × 254 = 762 comparisons and we bound the false discovery rate at 𝛼 = 0.05.
Results
Data Comparison for iNat and eBird
eBird generally has more sightings, on the scale of 35 to 50 times more records of individual birds in a given year, which is consistent with previous reports (Jacobs and Zipf 2017) and is expected given the ability to report multiple birds at once in an eBird checklist (Table 2). For the 254 sample species, in 2019 there were about ~270 observations per bird in iNat, compared with ~15,000 in eBird. In 2022, these numbers increased: there were about ~525 observations per bird in iNat, compared to ~20,400 in eBird.
Table 2
Summary of observations for bird species sampled across platforms in 2019 and 2022.
| PLATFORM | TOTAL OBSERVATIONS (2022) | AVERAGE COUNT PER SPECIES (2022) | TOTAL OBSERVATIONS (2019) | AVERAGE COUNT PER SPECIES (2019) |
|---|---|---|---|---|
| eBird | 5,180,666 | 20,396 | 3,806,983 | 14,988 |
| iNaturalist | 134,312 | 528 | 68,334 | 269 |
For 2022, an overwhelming majority of species (~99.6%) had more observations in eBird than iNat. The average species had about 40 times more observations in eBird than iNat. Only one bird was observed more in iNat than eBird in 2022: the cattle egret (Bubulcus ibis). These patterns are for the most part consistent for 2019 data. In 2019, the average species had about 65 times more observations in eBird than iNat. No bird was observed more on iNat than eBird in 2019.
Merge Criteria Results
The majority of species in each dataset are mergeable with the baseline eBird 2022 dataset (Table 3). The dataset most consistent with eBird 2022 was, unsurprisingly, the eBird 2019 dataset, with 97.6% of species classified as mergeable. iNat 2022 data was comparably consistent, achieving 97.2% mergeability. The iNat 2019 dataset exhibited the most discordance with eBird 2022, with 88.6% mergeability; though this rate suggests data is still fairly consistent for most species, even when varying databases and years.
Table 3
Fraction of species mergeable with the eBird 2022 dataset according to the two-sample COT test after Benjamini-Yekutieli correction. Non-mergeable species are listed for each database in the Supplemental File 1: Appendix A. An unsummarized list of mergeability for each species is available as a downloadable .csv (Supplemental File 2: Mergeability List).
| DATA SOURCE | EBIRD 2019 | INAT 2019 | INAT 2022 |
|---|---|---|---|
| Fraction of species mergeable with eBird 2022 | 97.6% (N = 248) | 88.6% (N = 225) | 97.2% (N = 247) |
Figure 3 displays three example species to illustrate the acceptable amount of variation in distributions across sources. Seasonality trends are visualized through relative frequency curves over time in Cartesian coordinates and in circular coordinates, which preserve the cyclic nature of the year and facilitates studying trends of birds whose prevalence is split across the beginning and end of the calendar year (e.g., the bufflehead).
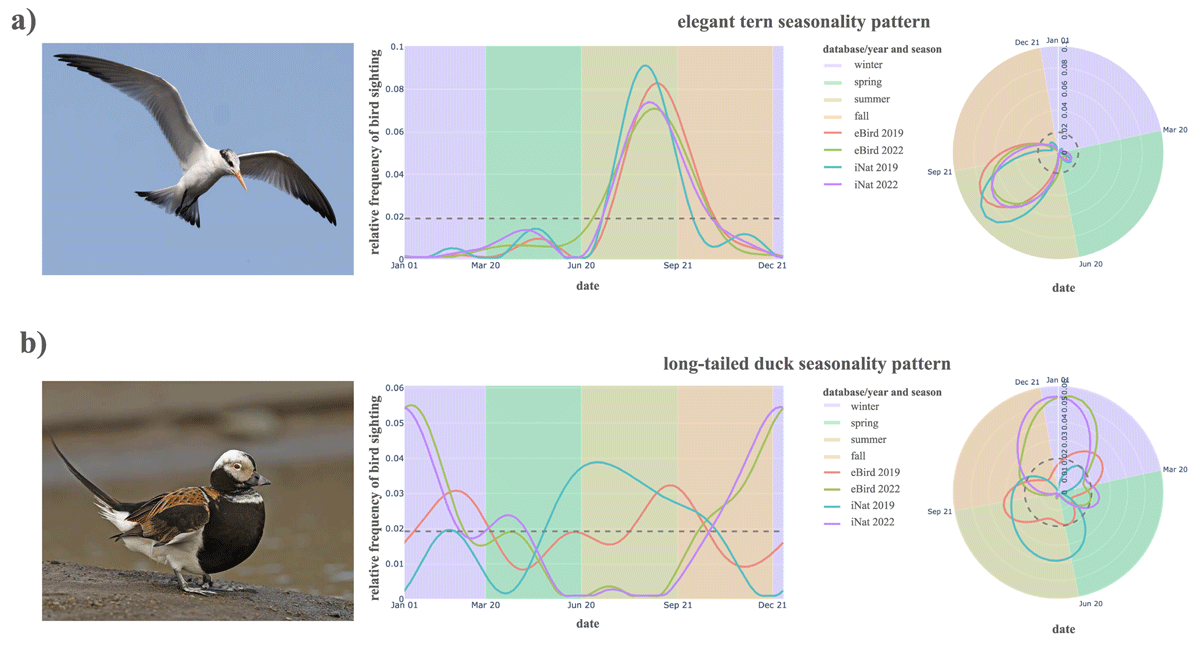
Figure 3
Relative frequency curves for the (a) elegant tern (mergeable across all sources) and (b) long-tailed duck (mergeable only within 2022) in Cartesian and circular coordinates. Background colors denote the seasons of winter (purple), spring (green), summer (yellow), and fall (orange). Photographs reproduced via iNaturalist with credits to: (a) Mac 2023, (b) clicque 2014.
The elegant tern (Thalasseus elegans) is an example bird whose distributions experience variation across platforms and years, but ultimately not enough to flag a significant difference: Each of the compared curves are similar enough to baseline (eBird 2022) to merge across all across datasets. This regularity corresponds to the elegant tern’s consistent annual migration to Northern California in late summer and early fall after breeding. The long-tailed duck (Clangula hyemalis), however, illustrates what more extreme deviations may look like. For this species, the merge criterion does detect a difference for some datasets: neither of eBird or iNat 2019 distributions fell within the acceptable merge envelope, though the iNat 2022 pattern was mergeable. Here, the merge criterion highlights a year-based difference in seasonality patterns. Long-tailed ducks are coastal birds present mainly in winter, but some individuals may linger through the summer. This inter-annual variation in summer occurrence prevents the data from meeting the merge criterion, even though it is not due to bias in detection or reporting.
Archetypal Seasonality Patterns
In this section, we explore an application of data merged using our methodology: assessing seasonality patterns in Northern California birds. There are two major factors that could influence seasonality of records in participatory science datasets: 1) seasonal migration of birds through the study region, and 2) seasonal changes in behavior of observers contributing to the portals. We explore archetypal examples of seasonality patterns and discuss whether or not the seasonality pattern of observations in the dataset accurately reflects known migratory behavior for that species.
We identified seven major archetypes of curves: seasonal peakedness during 1) spring, 2) summer, 3) fall, and 4) winter, as well as 5) consistent year-round prevalence, 6) bimodal prevalence, and 7) anomalous observation patterns or inconsistency across data sources (Figures 4 and 5). Boundaries between seasons are demarcated by colored backgrounds, where purple denotes winter (December 21–March 21), green denotes spring (March 21–June 21), yellow denotes summer (June 21–September 21), and orange denotes fall (September 21–December 21). However, note that some species make their northbound “spring” migration before March 21, and many species begin their southbound “fall” migration before September 21. While we focus on eight representative birds here, a dashboard visualizing all 254 birds’ prevalence patterns is available at the NorCal Bird dashboard (Carroll and Waterman 2024).
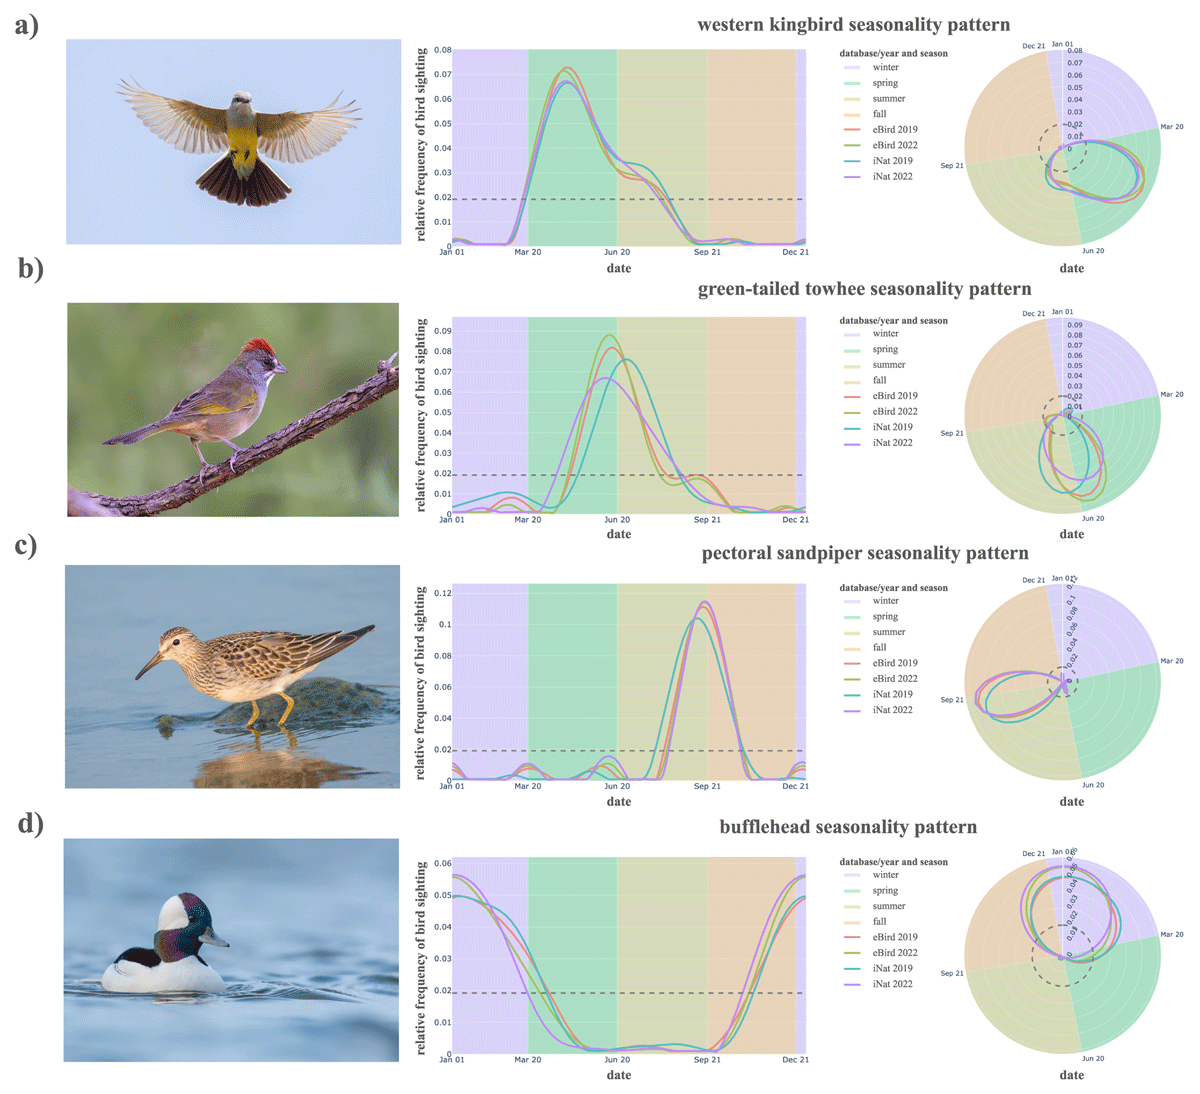
Figure 4
Relative frequency curves over time for the (a) western kingbird, (b) green-tailed towhee, (c) pectoral sandpiper, and (d) bufflehead (top to bottom) in standard coordinates (left panels) and in circular coordinates (right panels). Background colors denote the seasons of winter (purple), spring (green), summer (yellow), and fall (orange). Photographs reproduced via iNaturalist with credits to (a) Mikeintyler 2014, (b) Konings 2020, (c) Cannizzaro 2016, and (d) Naef 2022.
For seasonal patterns, we use four birds to illustrate the typical frequency pattern observed in the participatory science databases: western kingbird (Tyrannus verticalis) for spring, green-tailed towhee (Pipilo chlorurus) for summer, pectoral sandpiper (Calidris melanotos) for fall, and bufflehead (Bucephala albeola) for winter (Figure 4). Observation counts in each species’ curve, partitioned by database, are displayed in Table 4. Unless otherwise cited, details in the sections below on each species’ migratory timing are supported by publicly available data from the eBird Status and Trends tools (Fink et al. 2023).
Table 4
Observation counts of the representative birds for each archetype, by data source and year.
| BIRD\OBSERVATION COUNTS | EBIRD 2019 | INAT 2019 | EBIRD 2022 | INAT 2022 |
|---|---|---|---|---|
| western kingbird | 12,269 | 269 | 14,309 | 392 |
| green-tailed towhee | 3,047 | 76 | 3,670 | 75 |
| pectoral sandpiper | 4733 | 9 | 678 | 35 |
| bufflehead | 29,368 | 590 | 41,776 | 1,209 |
| California scrub-jay | 97,752 | 1,260 | 138,634 | 2,964 |
| western tanager | 13,331 | 176 | 19,913 | 454 |
| rock sandpiper | 385 | 21 | 875 | 20 |
| black-backed woodpecker | 394 | 14 | 718 | 34 |
| common murre | 15,351 | 195 | 16,303 | 445 |
Spring
The western kingbird represents a typical frequency pattern for the seasonal spring bird archetype with frequency curves that are consistent in shape and timing across platforms and years. The western kingbird is most frequently observed in the spring across both iNat and eBird, then observed at lower rates in summer into the start of fall. Birds then depart in late summer and early fall to return through the American southwest into Mexico.
Summer
The green-tailed towhee typifies a summer-only migrant in this region. Individuals winter in Mexico and parts of the southwestern US, and the bulk of their range during the breeding season spans the Great Basin and bordering mountain ranges. The first northbound individuals reach Northern California breeding sites in late April or early May. After breeding, southbound migration is completed by the end of September. This summer-only pattern is also likely to occur for other summer-breeding species that reach their northernmost extent within our study region.
Fall
The pectoral sandpiper is a model fall bird representative. Its frequency curve is characterized by observations almost only in the early weeks of fall. Pectoral sandpipers are long-distance migrants that breed in the arctic but winter largely in southern South America. During their northbound spring migration, they mostly move through areas east of the Rocky Mountains (Harrington 1984). However, their southbound migration is more longitudinally widespread, with birds occurring throughout the study region. This species demonstrates that data can satisfy inclusion and merging criteria even when sightings are relatively sparse. The iNat 2019 data included only 9 records of pectoral sandpipers, but they align with the predictable movements of this fall migrant.
Winter
The bufflehead typifies a winter prevalent species in Northern California and Nevada. Bufflehead observations start increasing in mid-autumn and peak in the early weeks of winter, then gradually decline through the remainder of winter and early spring. This pattern of winter occurrence primarily arises when species breed north of the study region and arrive in the region only for the winter period.
Year-round
The California scrub-jay (Aphelocoma californica) is non-seasonal, year-round resident of this region, with a frequency curve showing only minor variation across seasons (Figure 5a). California scrub-jays may occasionally undertake regional movements, for example if there is acorn crop failure in an area (Carmen 1988), but are not documented to have a large-scale seasonal migration.
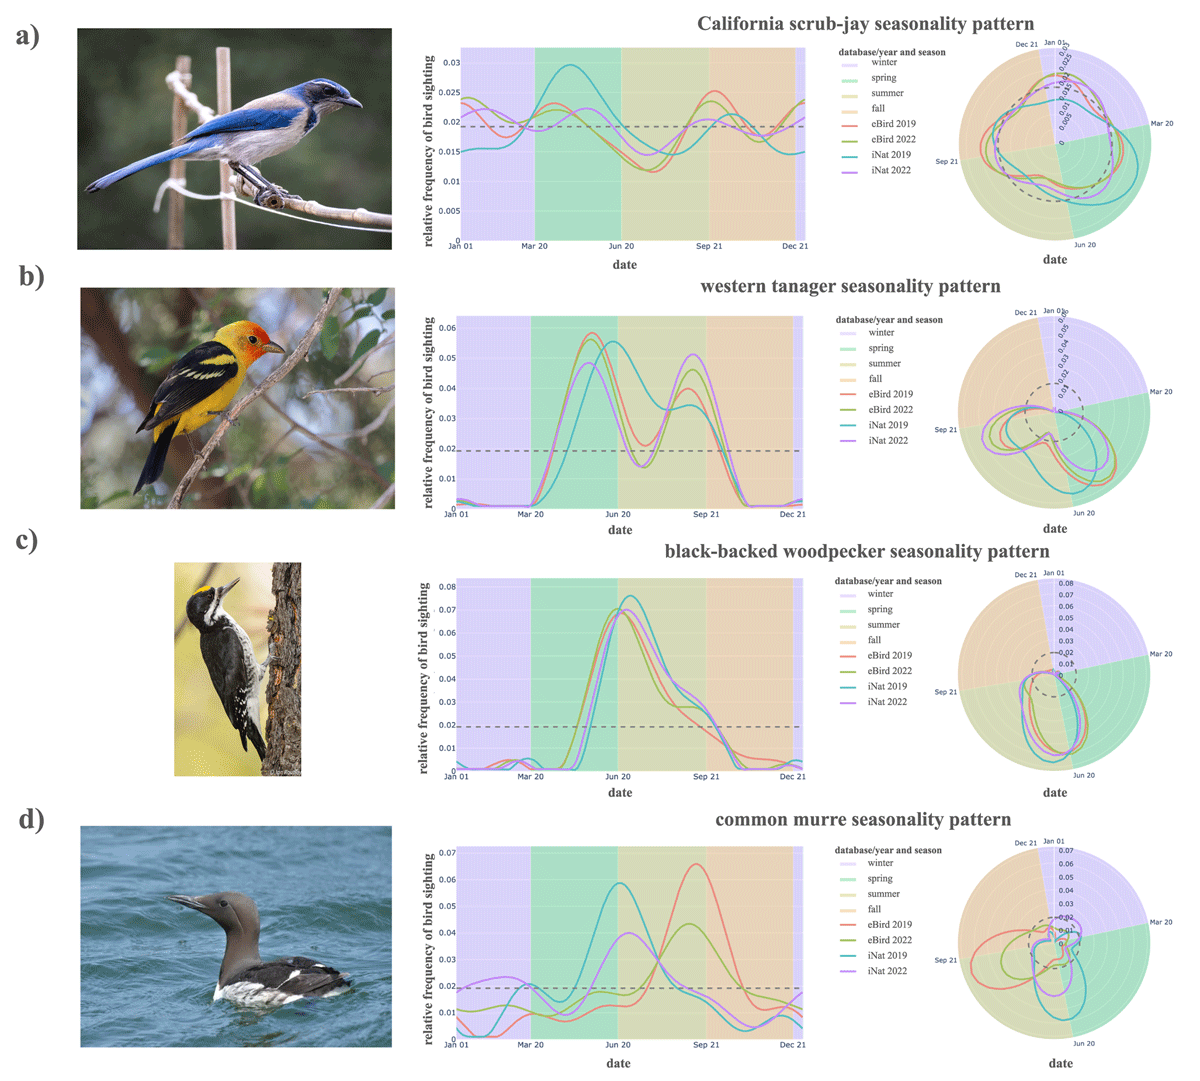
Figure 5
Relative frequency curves over time for the (a) California scrub-jay, (b) western tanager, (c) black-backed woodpecker, and (d) common murre (top to bottom) in standard coordinates (left panels) and in circular coordinates (right panels). Background colors denote the seasons of winter (purple), spring (green), summer (yellow), and fall (orange). Photographs reproduced via iNaturalist with credits to (a) Eisen 2022, (b) Konings 2024, (c) Routley 2009, and (d) Artemeva 2023.
Bimodal Prevalence
The western tanager (Piranga ludoviciana) represents a bimodal seasonal pattern. Its frequency distribution shows two observation peaks, one in late spring and a second in late summer, with fewer observations in early summer (Figure 5b). This pattern arises because most observations are likely to reflect passage migration—the movement of birds through a region to a final destination outside the region. The breeding range of the Western Tanager is primarily north of our study region, and the wintering range is primarily south of the study region.
Caveats in Interpreting Seasonal Patterns
A potential confound when interpreting seasonality patterns in participatory science datasets is seasonality in observer effort or behavior. Intentional observation drives (the City Nature Challenge, Global Big Days, etc.), as well as spatial and temporal variation in observer effort, could produce bias in observation records for a species that appears to reflect seasonality in presence of the species in the study area. The high degree of mergeability across the species presented in this study shows that these potential biases are not severe enough to warrant avoiding merging data entirely; however, they may intersect with other aspects of data bias or species behavior in ways that produce inaccurate outcomes.
The black-backed woodpecker (Picoides arcticus) is an example of a seasonality pattern that appears similar to migration-driven seasonal patterns, but which likely is primarily influenced by observer behavior. Its frequency curve is very consistent across data sources and years, beginning to increase in late spring and peaking in early summer with a slow decline in observation throughout the summer and into early fall (Figure 5c). While this pattern appears to support a summer-migratory behavior, black-backed woodpeckers are not known to have large-scale seasonal migration. The pattern of summer detection of black-backed woodpeckers may instead reflect seasonal variation in observer effort within the species’ range, rather than seasonal movements of birds through the study area. In California, black-backed woodpeckers are found in relatively high elevation and latitude regions (Saracco, Siegel, and Wilkerson 2011), which are less accessible in winter than other seasons. Our methodology of smoothing annual curves controls for overall effort in observing a species, but may still be susceptible to seasonal changes in the type of effort.
Variation in observer behavior can also lead to discrepancies between patterns in eBird and iNat. For example, occurrences of common murre, Uria aalge, peaked around the end of June both years in iNat while occurrence was highest in September in eBird (Figure 5d). Inspection of the spatial distribution of these sightings reveals that eBird has a high number of August, September, and October observations reported from deep water off the California coast. These reports generally come from pelagic birding trips, in which regularly scheduled boats travel to seabird hotspots many miles offshore. On these trips, the group generates a new checklist at least once per hour (eBird pelagic protocol), so a single trip can produce a dozen or more checklists, leading to many separate reports of birds like common murre. iNat, on the other hand, has no such protocol. Even when a birder uses iNat on a pelagic, they are unlikely to be repeatedly adding observations of different common murres (of which there may be many thousands observed). Because pelagic birding trips are conducted most frequently in these months, it produces a strong seasonal pattern that is only reflected on eBird.
Discussion
The primary objective of our study was to develop a methodology for combining observation data of bird species from two robust participatory science datasets (iNat and eBird) that use different observation protocols, recruit different observers, and report data in different ways. We first reviewed the datasets using exploratory statistics, then developed quantitative methods to evaluate which species can be reliably merged across the two datasets. This methodology has many biological applications. Herein, we explore one possible avenue of study: seasonality in bird species observations in Northern California.
Constructing merge criteria as a function of relative frequency instead of counts partially controls for bias in absolute prevalence by implicitly assuming scale differences are species-level random effects uniform in time. Furthermore, the nonparametric merge approach leverages circular statistics and optimal transport, which are specifically designed to respect the geometry of seasonal frequency curves, as opposed to a naive Euclidean approach, which introduces an arbitrary break at the end of the calendar year and could result in incorrect merge decisions for winter birds. Finally, relying on a bootstrap procedure ensures that differences in sample size are reflected in the acceptable merge criteria: A species with fewer observations will generally carry more uncertainty around its baseline distribution and thus will tolerate more discrepancy, while a well-documented species will have less variability and thus higher standards for merging.
We identified several factors that influence mergeability of participatory science data. For eBird and iNat, variation in the timing and frequency of bird observations across years and data platforms could be due to 1) seasonal migratory behavior, 2) variation in observer behavior, and 3) differences in observer activity and reporting mechanisms between the two data portals. All of these factors may contribute to seasonality of observations within a given species. One of the biggest strengths of the proposed methodology is that it applies in all cases, regardless of which underlying factor is driving the seasonality.
Identifying the relative influence of these factors is benefitted by a multidisciplinary approach and collaborative teams should be strategically built to intentionally represent the different knowledge needs required for working with these sources of data. For example, our team includes collaborators with expertise in quantitative methodology, detailed knowledge of bird migration behavior in Northern California species, and extensive experience both with contributing observations to iNat and eBird and utilizing observation data from these and other data portals such as GBIF. This combination of perspectives and domain expertise facilitated our interpretation of seasonality patterns both quantitatively and qualitatively. These advantages also highlight an important takeaway message: Deliberate, project-informed team construction is an essential consideration in participatory science-driven research, and more investigation into establishing principles of ideal team design for different project types is an important area for future work.
Our methodology can also be applied to other projects in which observers track seasonal occurrence of organisms or events. Participants in the National Phenology Network can report seasonal patterns in occurrence of events like a deciduous tree leafing out in spring, an overwintering insect emerging, or a bird building a nest. Many smaller participatory science projects may focus on a subset of these events, such as the occurrence of caterpillars and beetles (e.g., Caterpillars Count!) and nesting behavior in birds (e.g., NestWatch). Merging diverse data using our approach may allow researchers to explore complex and specific research questions and offers ways to amplify the usefulness of participatory science projects large and small. In this way, a participatory science project need not be the largest or most engaged program in order to contribute to broad research questions; instead, data merging can serve to leverage the power of smaller, more focused projects.
The process of developing the quantitative merge criteria and qualitatively identifying if results matched known migratory behavior elucidated the inherent biases of each platform. Interestingly, biases that we anticipated being problematic often were not. For example, broad-scale differences in data reporting (bird count versus species presence) and differences in timing of observation drives did not result in non-mergeable data. There was also not an obvious type of non-mergeable bird, ecologically. Timing of migration, rare/vagrant status, preferred habitat, etc., did not consistently lead to non-mergeable data. However, species with seasonally inaccessible habitats (e.g., black-backed woodpecker) or that are most readily found via specialized approaches such as pelagic boat trips (e.g., common murre) may be more vulnerable to the impact of biases in effort and reporting, even if they still pass the merge criteria.
Conclusion
This project shows that data from participatory science projects with different goals, observers, structure, protocols, and biases can be combined into reliable and robust datasets to address broader scientific questions. Here, we focus on iNat and eBird, two of the most robust naturalist participatory platforms currently in existence. Critically, both iNat and eBird have publicly accessible data portals for reviewing and downloading observation records and their metadata, and both portals report to GBIF allowing for downloads in common format. We encourage public participatory projects to build easily accessible, public-facing data portals (or contribute their data to other public portals) not only to support formal research such as the project described here, but also to encourage exploratory engagement by the public community who contributes data to these portals. Publicly generated data should also be publicly accessible in order for participatory science projects to develop a scientifically-engaged public community.
Data Accessibility Statement
Data in this report is publicly available via eBird and iNaturalist.
Supplemental Materials
The Supplemental Materials for this article can be found as follows:
Supplemental File 1.
Appendix A: An appendix of supporting information regarding the study and data sources to accompany the main text. DOI: https://doi.org/10.5334/cstp.825.s1
Supplemental File 2.
Mergeability List: A full version of Table 3 from the main text, including an unsummarized list of mergeability for each species. DOI: https://doi.org/10.5334/cstp.825.s2
Supplemental File 3.
Observation Counts: A full version of Table A1 from Appendix A, including species-level observation counts across both platforms. DOI: https://doi.org/10.5334/cstp.825.s3
Acknowledgements
The authors thank Devendra Govil, Rushil Manglik, Seneth Waterman, Ada Zhang, and Jaedyn Lehrer for conversations and support regarding data acquisition and visualization. We are also grateful for constructive suggestions from two anonymous reviewers. The authors also thank all of the participatory scientists who contribute data to portals like iNaturalist and eBird every day, and whose voluntary contributions make studies like this one possible.
Competing Interests
The authors have no competing interests to declare.
Author Contributions
CC and LMG were responsible for project conception and administration. CC was responsible for data processing and statistical analysis. CC, LMG, and REF were responsible for data interpretation and the original draft. LMG provided expertise on participatory science platforms, REF provided expertise on bird behavior and seasonality, and CC provided expertise on statistical methodology.