
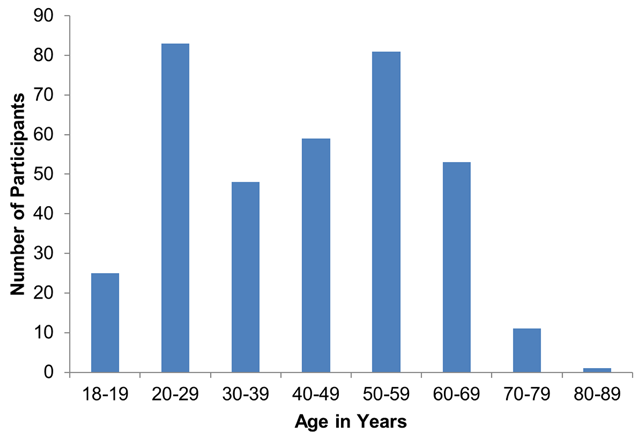
Figure 1
Age of participants. N = 361.
Table 1
Regression coefficients for three measures of familiarity with the concept of citizen science: Familiarity with the term, recollection of hearing about citizen science after being provided with a definition, and familiarity with other similar terms. For details on independent variables, see text. Asterisks indicate significant p-values for coefficients: *p < 0.05, **p < 0.01, ***p < 0.001. N = 357.
| Familiarity | Intercept | CS Experience | Education | Age | Gender (Male) | Fair CS | Pseudo R2 |
|---|---|---|---|---|---|---|---|
| Term | –2.17*** | 0.95** | 0.43*** | –0.01 | 0.12 | 0.33 | 0.27 |
| Definition | –0.33 | 1.26*** | 0.16 | –0.01 | –0.07 | 0.14 | 0.30 |
| Other Terms | 1.74*** | 0.82* | 0.10 | –0.02* | –0.11 | –0.64* | 0.31 |
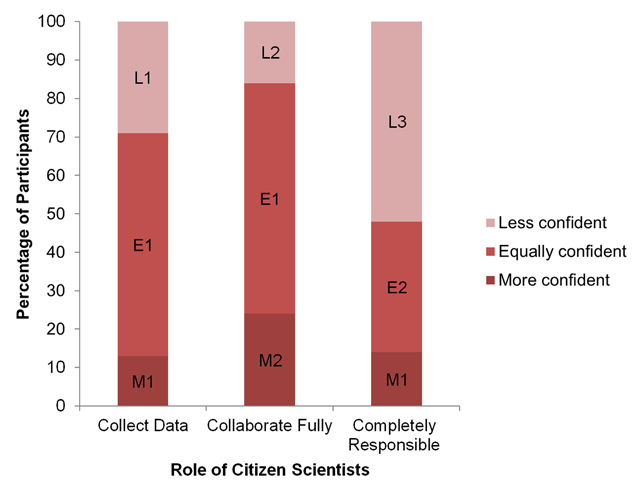
Figure 2
Confidence in citizen science findings compared to those generated by professional scientists. Pairwise comparisons were conducted within each confidence level (e.g. collect data vs. collaborate fully for results of “less confident”). Different number combinations for each letter indicate significant differences (p < 0.05) based on pairwise chi-square tests with Bonferroni corrections. Ntotal = 479.
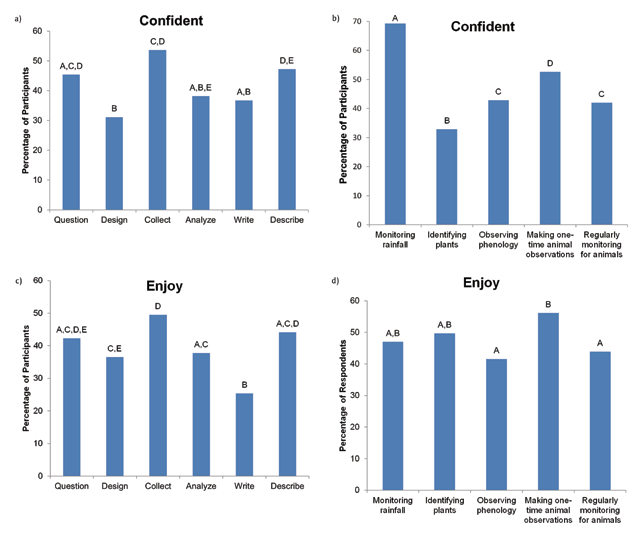
Figure 3
Percentage of participants who reported that they would feel confident (a) or enjoy (c) science process tasks; percentage of participants who reported that they would feel confident (b) or enjoy (d) engaging in nature-based data collection tasks. Details on tasks can be found in the text. Different letters between tasks indicate significant differences (p < 0.05) based on pairwise chi-square tests with Bonferroni corrections. Ntotal = 484.
Table 2
Regression coefficients with confidence in citizen science activities as dependent variables, and prior citizen science experience, education, age, gender, and participation in other fair activities as independent variables. Bolded coefficients indicate significant p-values: *p < 0.05, **p < 0.01, ***p < .001. N = 357.
| Confidence | Intercept | CS Experience | Education | Age | Gender (Male) | Fair CS | Pseudo R2 |
|---|---|---|---|---|---|---|---|
| Question | 0.28 | 0.58* | 0.29** | –0.04*** | 0.59* | 0.04 | 0.32 |
| Design | –0.01 | 0.95** | 0.17 | –0.04*** | 0.75** | –0.13 | 0.32 |
| Collect | 0.68 | 0.76* | 0.16 | –0.03*** | 0.31 | 0.16 | 0.31 |
| Analyze | 0.29 | 0.59* | 0.02 | –0.03*** | 0.81*** | 0.17 | 0.27 |
| Write | –0.14 | 0.75** | 0.20 | –0.03*** | 0.60* | 0.17 | 0.30 |
| Describe | –0.07 | 1.22*** | 0.25* | –0.03*** | 0.68** | 0.44 | 0.33 |
| Rainfall | 0.36 | 0.17 | 0.22 | –0.01 | 0.27 | 0.20 | 0.28 |
| ID Plants | –1.42*** | 0.78** | 0.13 | 0.00 | 0.33 | 0.47* | 0.29 |
| Phenology | –0.52 | 0.90** | 0.13 | –0.01 | 0.39 | 0.15 | 0.29 |
| One-time Obs | –0.04 | 0.27 | 0.11 | –0.01 | 0.09 | 0.44 | 0.27 |
| Monitoring | –0.55 | 0.40 | 0.06 | –0.01 | 0.24 | 0.64** | 0.29 |
Table 3
Regression coefficients with enjoyment of citizen science activities as dependent variables, and prior citizen science experience, education, age, gender, and participation in other fair activities as independent variables. Bolded coefficients indicate significant p-values: *p < 0.05, **p < 0.01, ***p < .001. N = 357.
| Enjoyment | Intercept | CS Experience | Education | Age | Gender (Male) | Fair CS | Pseudo R2 |
|---|---|---|---|---|---|---|---|
| Question | –0.56 | 0.79** | 0.04 | 0.00 | 0.03 | 0.14 | 0.28 |
| Design | –0.57 | 0.72** | 0.06 | –0.01 | 0.05 | –0.05 | 0.27 |
| Collect | –0.30 | 0.32 | 0.03 | 0.00 | –0.12 | 0.31 | 0.27 |
| Analyze | –0.32 | 0.56* | 0.11 | –0.02* | 0.27 | 0.18 | 0.28 |
| Write | –1.64*** | 0.52 | 0.27* | –0.01 | 0.20 | 0.11 | 0.28 |
| Describe | –0.44 | 0.52 | 0.13 | –0.01 | –0.07 | 0.21 | 0.27 |
| Rainfall | –1.17** | 0.19 | 0.20 | 0.01 | –0.14 | 0.30 | 0.28 |
| ID Plants | –0.58 | 0.41 | 0.09 | 0.00 | –0.51* | 0.60** | 0.29 |
| Phenology | –0.77 | 0.75** | 0.08 | 0.00 | –0.50* | 0.12 | 0.29 |
| One-time Obs | –0.01 | 0.49 | 0.01 | 0.00 | –0.22 | 0.40 | 0.28 |
| Monitoring | –0.56 | 0.49 | –0.08 | 0.01 | –0.30 | 0.13 | 0.27 |