
Table 1
Values of behavioral and morphological traits assigned to study species, with non-native species in bold (World Spider Catalog 2023).
| SPECIES | SIZE (mm) | BRIGHT | CONTRAST | UNIQUE | DIURNAL | SEASON1 | POLYMORPHIC | WEB DECORATION |
|---|---|---|---|---|---|---|---|---|
| Acanthepeira stellata (Walckenaer 1805) | 11.50 | no | no | yes | no | early | no | no |
| Araneus bicentenarius (McCook 1888) | 24.75 | no | yes | yes | no | early | no | no |
| Araneus diadematus2 Clerck 1757 | 13.25 | no | yes | no | yes | late | yes | no |
| Araneus marmoreus Clerck 1757 | 13.50 | yes | yes | no | yes | late | yes | no |
| Araneus nordmanni (Thorell 1870) | 13.00 | no | yes | no | yes | late | no | no |
| Araneus pegnia (Walckenaer 1841) | 5.93 | no | yes | no | yes | late | yes | no |
| Araneus trifolium (Hentz 1847) | 14.50 | yes | yes | no | yes | late | yes | no |
| Araniella displicata (Hentz 1847) | 6.00 | yes | yes | no | yes | early | yes | no |
| Argiope argentata (Fabricius 1775) | 14.00 | yes | yes | yes | yes | early | no | yes |
| Argiope aurantia Lucas 1833 | 23.75 | yes | yes | no | yes | late | no | yes |
| Argiope trifasciata (Forsskål 1775) | 20.00 | yes | yes | no | yes | late | no | yes |
| Cyclosa turbinata (Walckenaer 1841) | 4.25 | no | no | yes | yes | late | no | yes |
| Eriophora ravilla (C. L. Koch 1844) | 18.00 | yes | yes | no | no | early | yes | no |
| Eustala anastera (Walckenaer 1841) | 7.15 | no | no | no | no | early | no | no |
| Gasteracantha cancriformis (Linnaeus 1758) | 8.13 | yes | yes | yes | yes | late | no | yes |
| Gea heptagon (Hentz 1850) | 5.15 | no | no | yes | yes | early | no | no |
| Larinioides cornutus (Clerck 1757) | 10.25 | no | no | no | no | early | no | no |
| Larinioides sclopetarius (Clerck 1757) | 11.00 | no | no | no | no | early | no | no |
| Mangora gibberosa (Hentz 1847) | 9.10 | yes | yes | no | yes | late | no | no |
| Mangora placida (Hentz 1847) | 3.45 | yes | yes | no | yes | early | no | no |
| Mecynogea lemniscata (Walckenaer 1841) | 7.50 | yes | yes | no | yes | early | no | yes |
| Metepeira labyrinthea (Hentz 1847) | 5.85 | no | no | no | no | late | no | yes |
| Micrathena gracilis (Walckenaer 1805) | 8.88 | yes | yes | yes | yes | late | no | no |
| Micrathena mitrata (Hentz 1850) | 6.18 | yes | yes | yes | yes | late | no | no |
| Micrathena sagittata (Walckenaer, 1841) | 7.75 | yes | yes | yes | yes | late | no | no |
| Neoscona arabesca (Walckenaer, 1841) | 7.48 | yes | no | no | no | early | no | no |
| Neoscona crucifera (Lucas 1838) | 14.30 | yes | no | no | no | late | no | no |
| Neoscona domiciliorum (Hentz 1847) | 11.60 | no | yes | no | no | late | yes | no |
| Trichonephila clavata (L. Koch 1878) | 22.38 | yes | yes | no | yes | late | no | no |
| Trichonephila clavipes (Linnaeus 1767) | 28.25 | yes | yes | yes | yes | late | no | no |
| Verrucosa arenata (Walckenaer 1841) | 7.83 | yes | yes | yes | yes | late | no | no |
[i] 1 Early/Late = majority of iNaturalist observations submitted before or after August 1, respectively.
2 Bold text indicates species that are introduced to North America (NA). A. diadematus and L. sclopetarius have been present in NA for over a century. The status of G. heptagon is less certain, but it has also been present in NA for an extended period of time.
Table 2
Modeling results. Traits are shown in the table if they were included in the top-performing Linear Regression models or with >10% increase in mean squared error (MSE) in the Random Forest model. ID: identification, RG: research grade, UES: user engagement score.
| RESPONSE | LINEAR REGRESSION | RANDOM FOREST | |||||
|---|---|---|---|---|---|---|---|
| PARAMETER | ESTIMATE | CI | WEIGHT | % INCREASE MSE | INCREASE NODE PURITY | EFFECT | |
| User engagement | |||||||
| Size | –1.56 | –2.19, –0.93 | 1.0 | 47.79 | 3.85 | UES decreases with size. | |
| Report frequency | |||||||
| Bright | 0.47 | 0.16, 0.78 | 1.0 | 26.12 | 1.87 | Bright colors increase reports. | |
| Size | 1.17 | 0.51, 1.83 | 1.0 | 23.81 | 3.58 | Reports increase with size. | |
| Contrast | – | – | – | 14.07 | 0.86 | Contrast increases report. | |
| IDs per observation | |||||||
| Contrast | 0.12 | –0.02, 0.26 | 0.57 | 34.57 | 0.32 | Contrast increases IDs. | |
| Size | 0.27 | 0.05, 0.50 | 1.0 | 24.29 | 0.19 | IDs increase with size. | |
| Diurnal | 0.28 | 0.14, 0.41 | 1.0 | 33.16 | 0.30 | Diurnal activity increases IDs. | |
| Bright | – | – | – | 12.66 | 0.06 | Bright colors increase IDs. | |
| RG % | |||||||
| Contrast | 0.20 | 0.08, 0.31 | 1.0 | 33.6 | 3763 | Contrast increases RG %. | |
| Diurnal | 0.15 | 0.04, 0.26 | 1.0 | 35.0 | 4251 | Diurnal activity increases RG %. | |
| Unique | 0.10 | 0.02, 0.19 | 1.0 | 13.04 | 865 | Unique morphology increases RG%. | |
| Bright | – | – | – | 19.8 | 1785 | Bright colors increase RG % | |
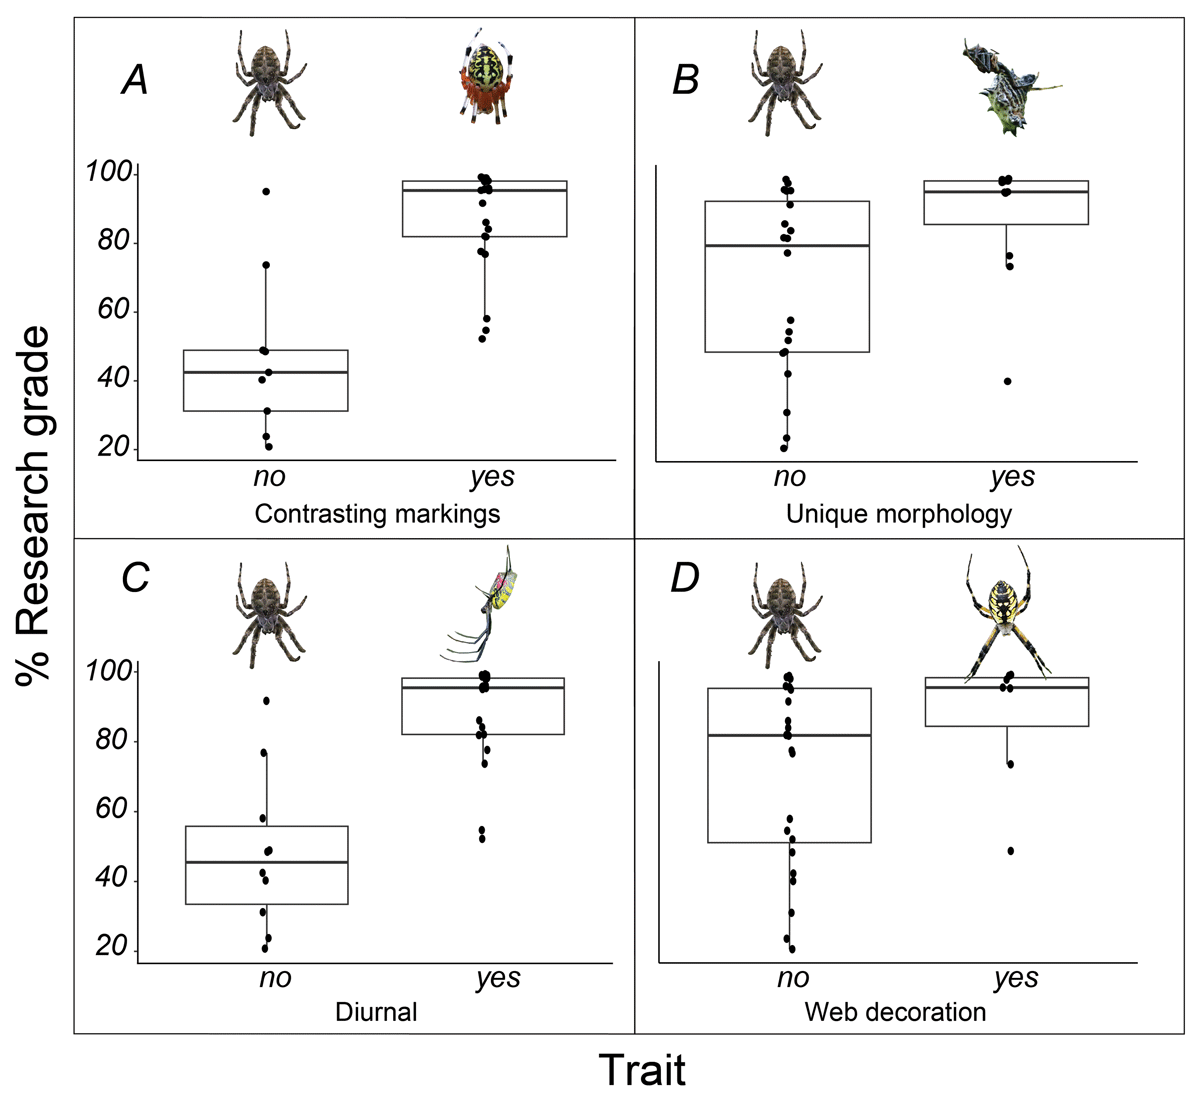
Figure 1
Influence of morphological traits on the percentage of iNaturalist observations for a species that are classified as research grade.
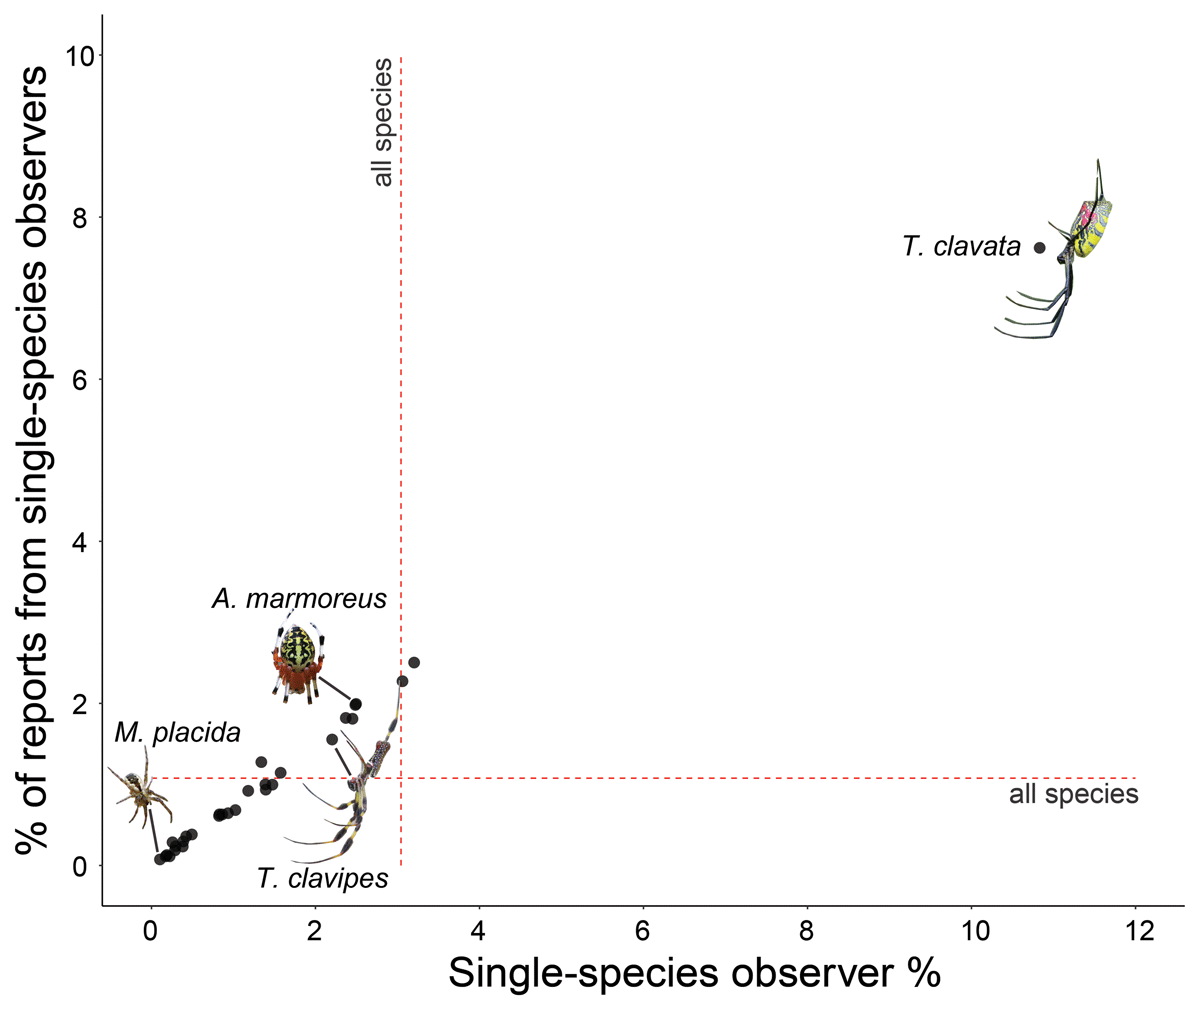
Figure 2
Percentage of iNaturalist observations reported by single-species users plotted against percentage of single-species users for each species included in analysis.
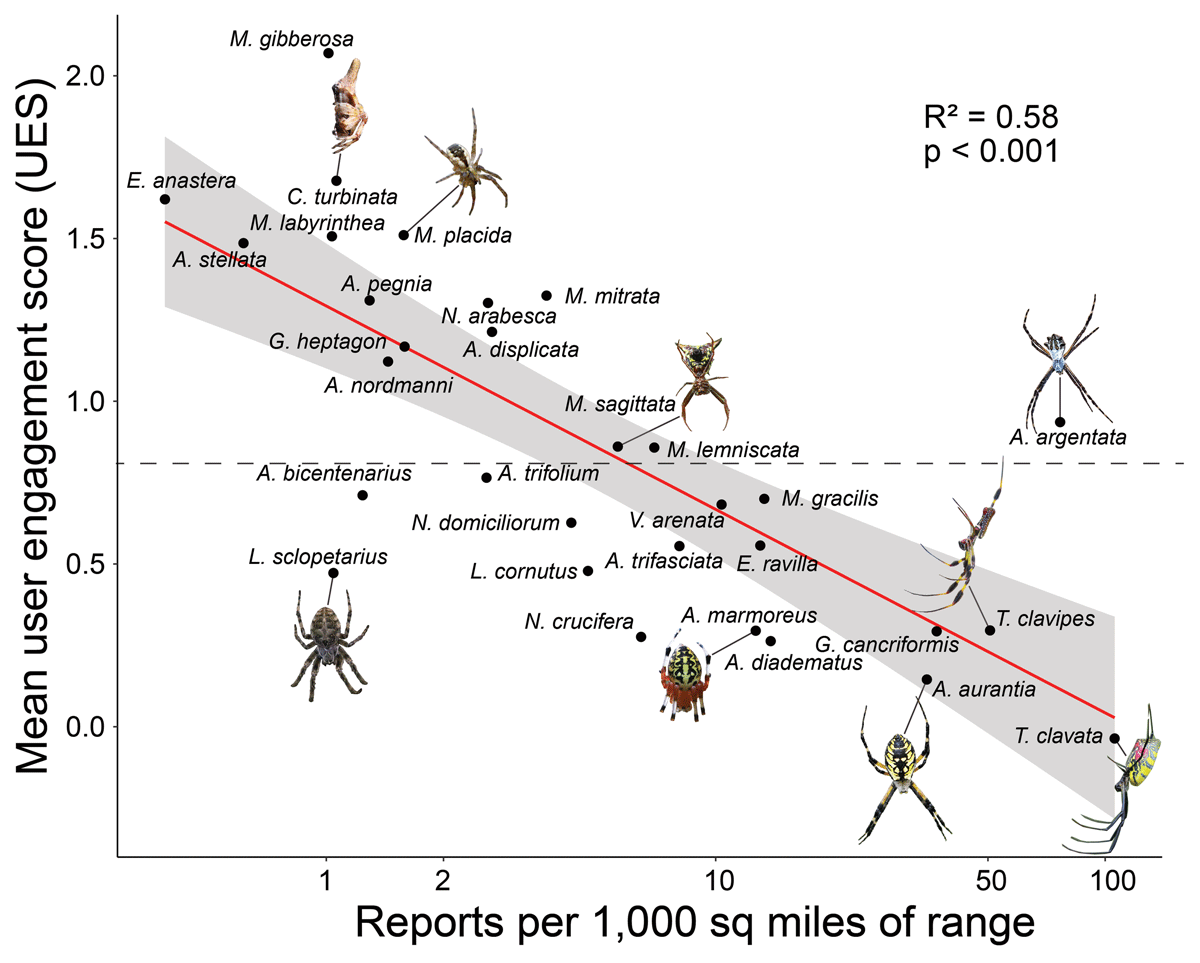
Figure 3
Mean user engagement score (UES) among users reporting a species plotted against the number of research grade (RG) observations of that species per 1000 miles2 of range. Lower UES scores indicate species typically reported by more casual iNaturalist users, whereas higher scores indicate species typically reported by more committed iNaturalist users. The dotted line represents the average engagement level of users among analyzed species. Species represented with photos are marked with an asterisk.
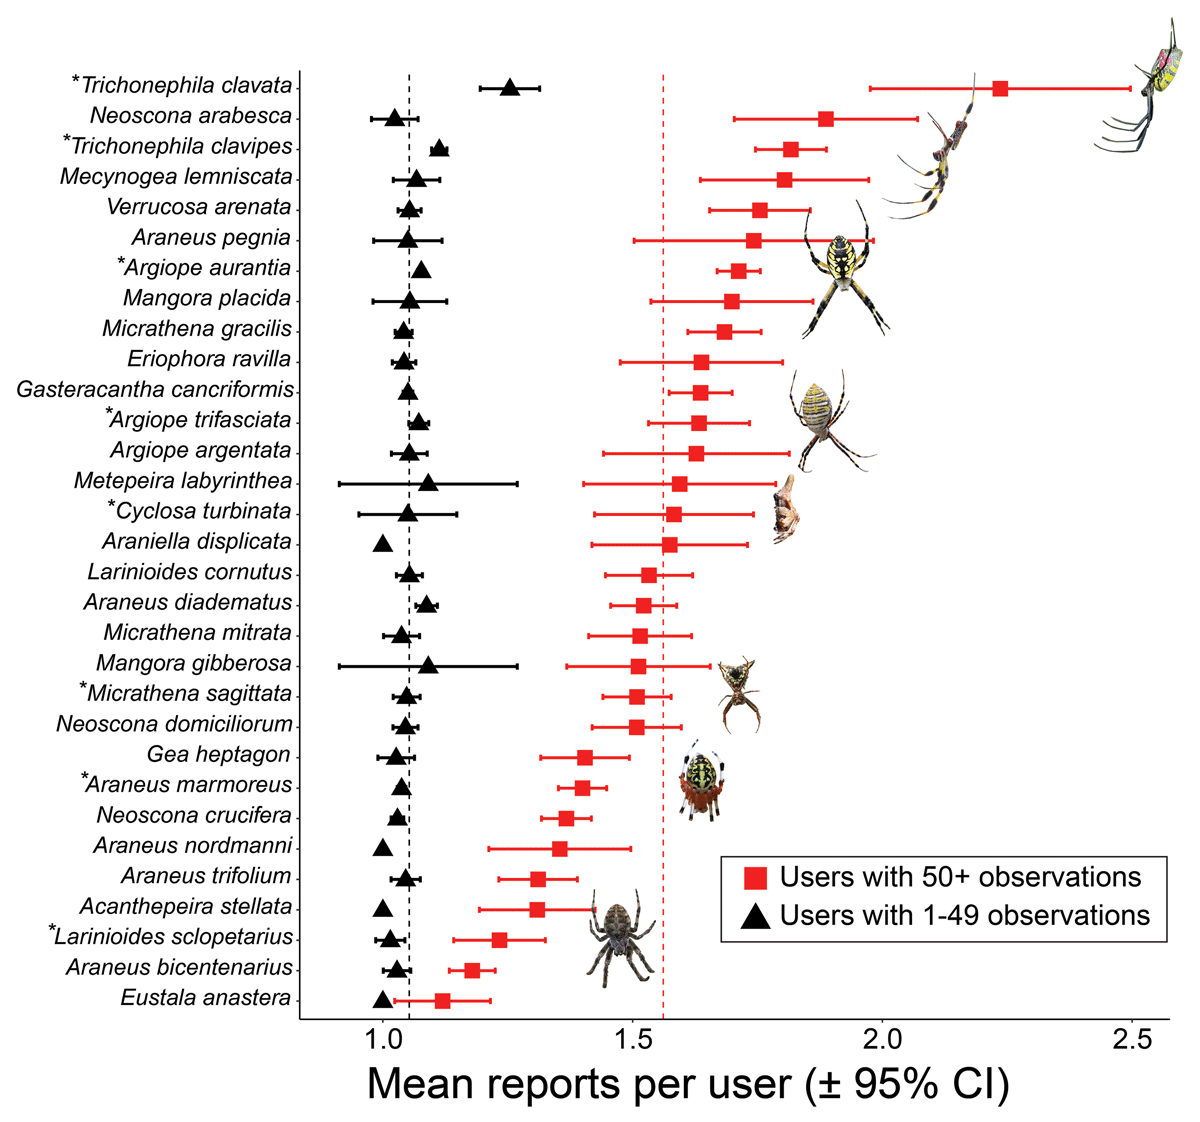
Figure 4
Number of observations reported for each species by individual users. Mean and 95% confidence interval is reported for users with more than 50 total observations and for users with less than 50 total observations. These two groups correspond with the top two thirds and bottom third of users by UES, respectively. Species represented with photos are marked with an asterisk.