
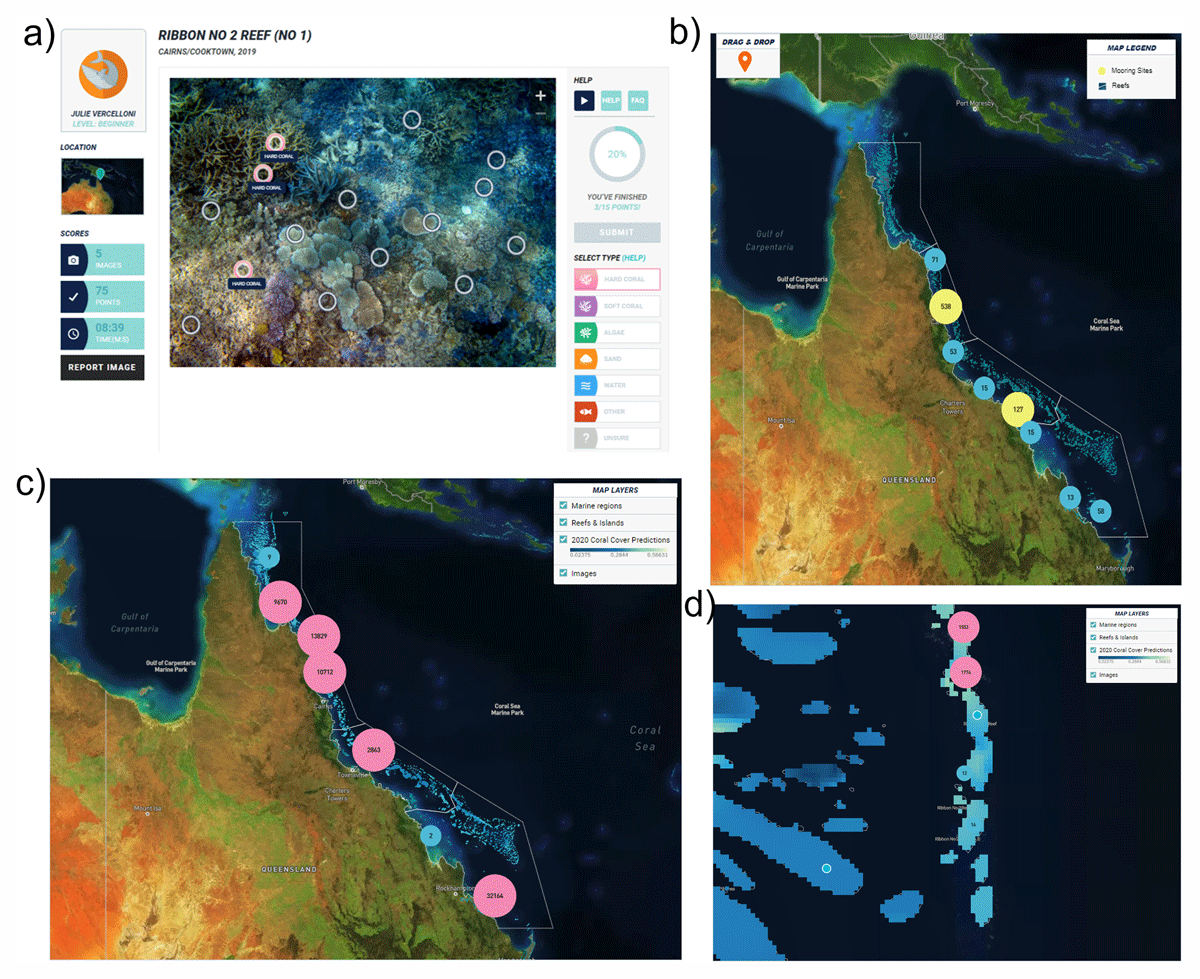
Figure 1
Main features of Virtual Reef Diver platform with (a) the classification module, (b) the map of the number of images contributed by the public, (c) the total number of images used for the modeling and (d) the predicted coral cover for the Great Barrier Reef.
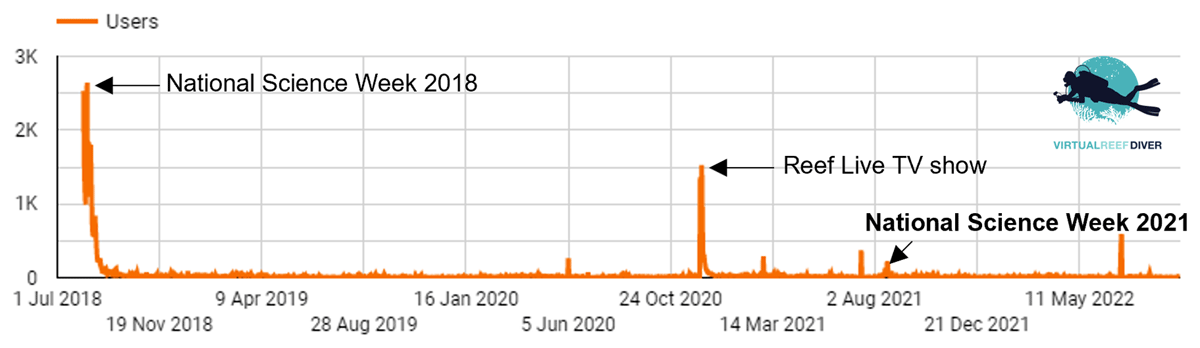
Figure 2
Number of users (defined as a person who has visited the website) that visited the Virtual Reef Diver platform since its release in July 2018, with highlighted main events (Features – Google Analytics 2022).
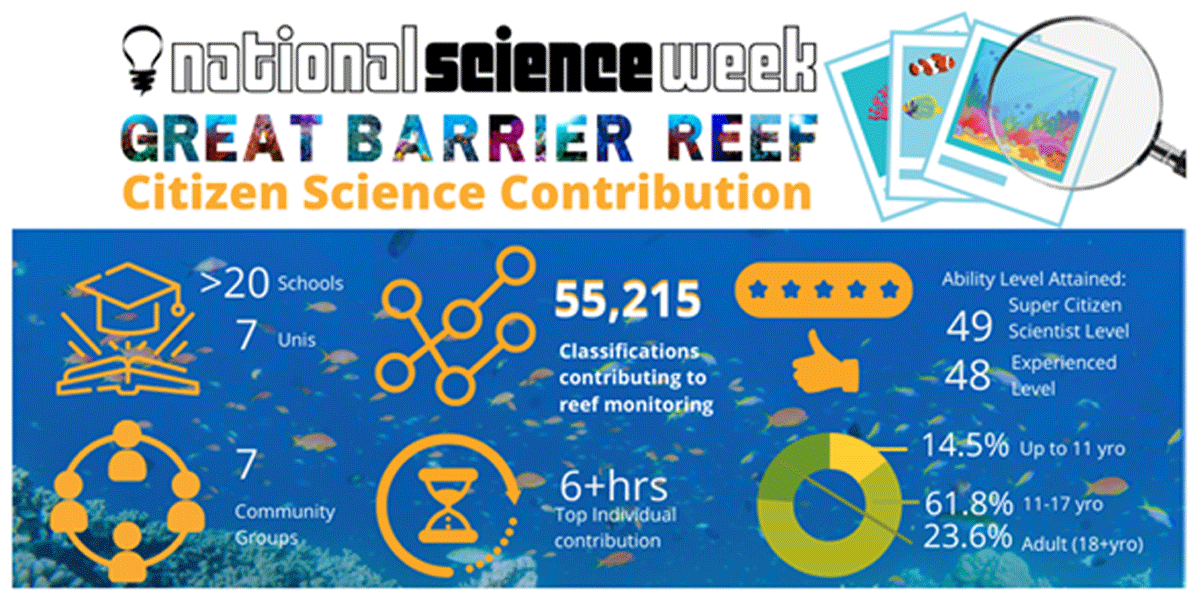
Figure 3
Official outcomes of the 2021 National Science Week released to the media.
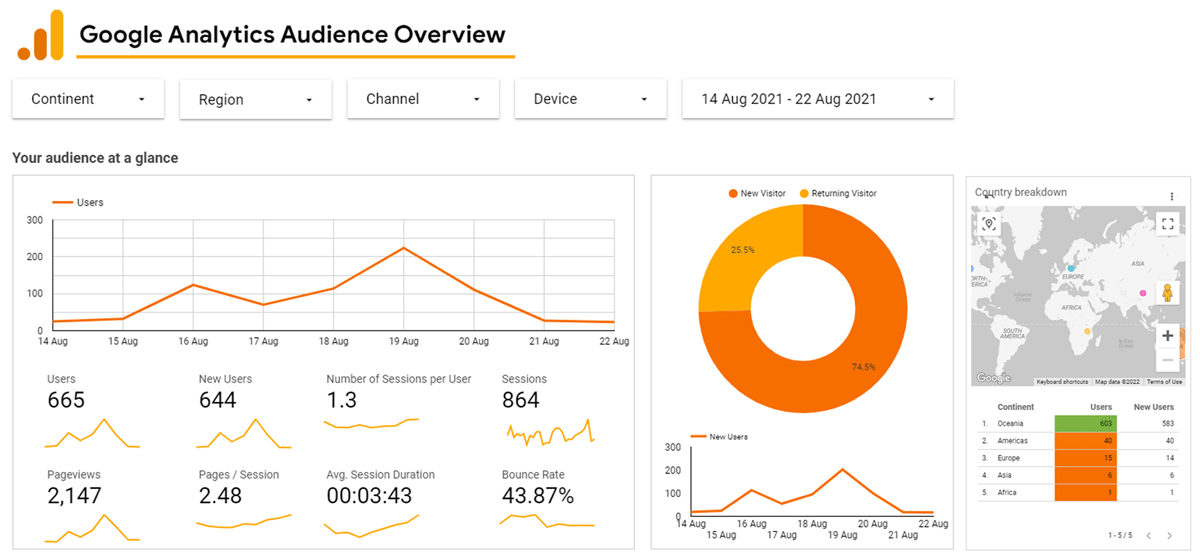
Figure 4
Overview of website activities during the National Science Week 14-08-21 to 22-08-21 (Google Analytics 2022).
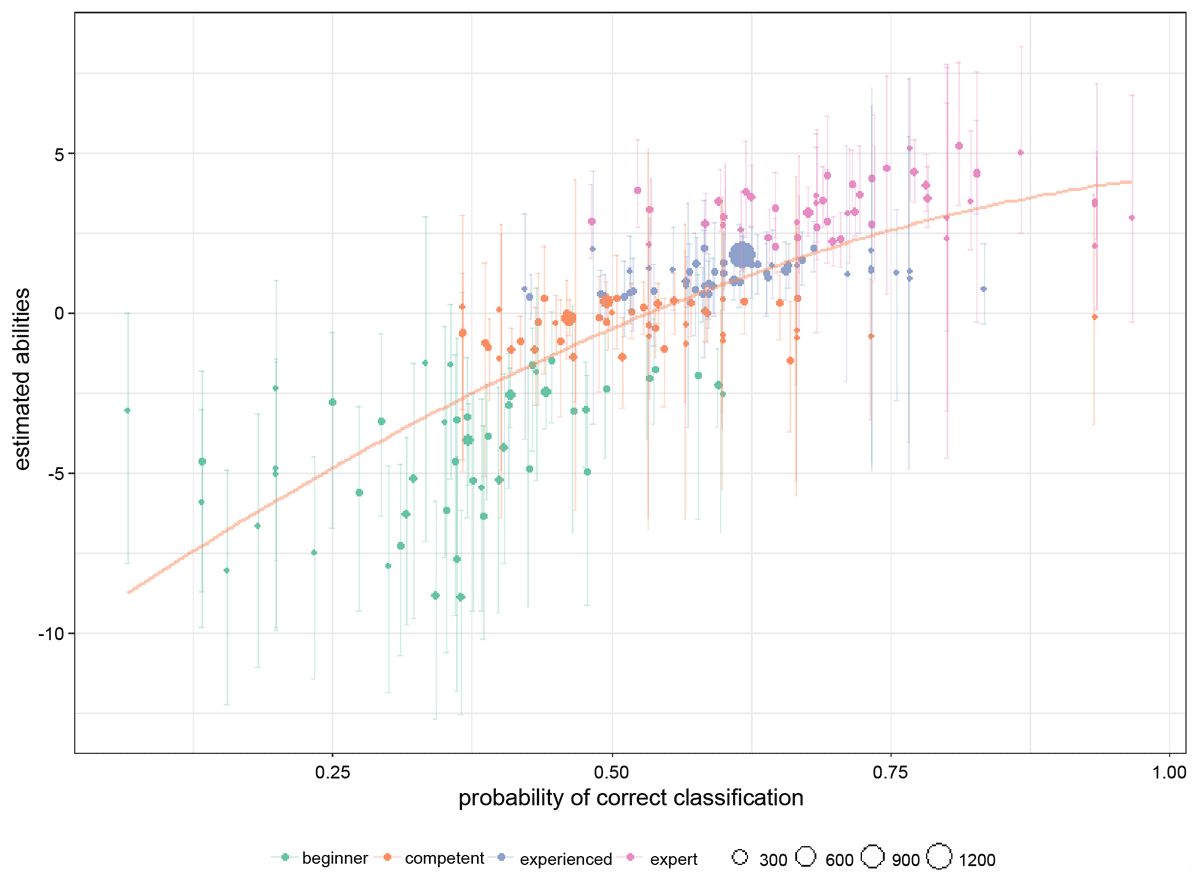
Figure 5
Ability scores of the Virtual Reef Diver participants to classify corals from images. The size of the dots corresponds to the number of classifications made by a participant and colors to the groups allocated based on their abilities.
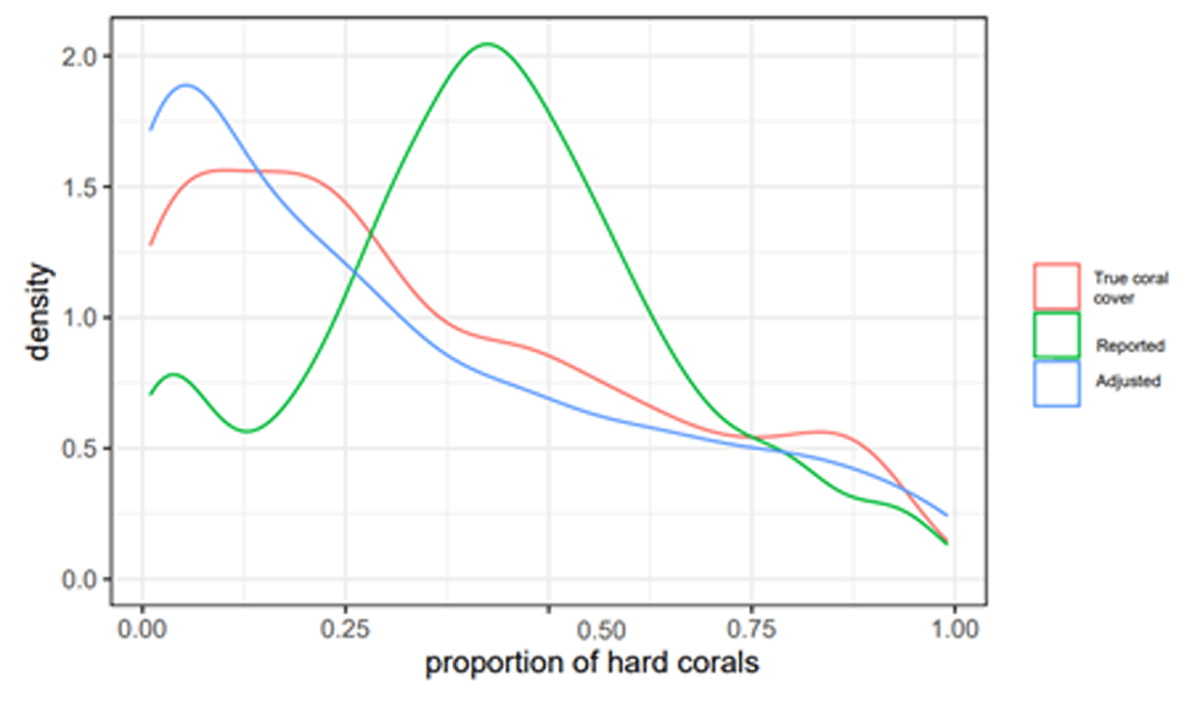
Figure 6
Density plot of the true coral cover (red) in the images, the reported values from the participants (green) and estimated proportion from the model after accounting for the participants abilities (blue). Figure reproduced with permission from Santos-Fernandez et al. (2021a).
Table 1
Summary statistics of the posterior performance measures from a sample of 3 participants. Se and sp refer to the sensitivity and specificity measures of participant performances, sd stands for standard deviation, and 2.5%–97.5% correspond to the measurement of uncertainty estimated by the model.
| PARTICIPANT | VARIABLE | MEAN | SD | 2.5% | 97.5% |
|---|---|---|---|---|---|
| 1 | se | 0.777 | 0.140 | 0.519 | 0.991 |
| sp | 0.827 | 0.128 | 0.542 | 0.995 | |
| 2 | se | 0.935 | 0.117 | 0.572 | 1.000 |
| sp | 0.984 | 0.036 | 0.878 | 1.000 | |
| 3 | se | 0.512 | 0.010 | 0.501 | 0.537 |
| sp | 0.712 | 0.112 | 0.515 | 0.921 |
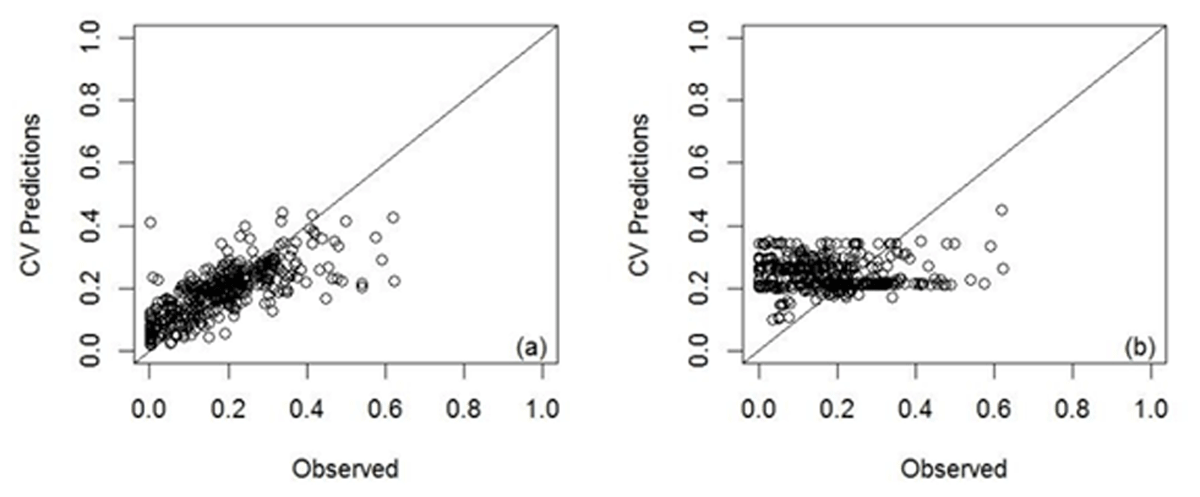
Figure 7
Model performance when integrating all the existing data versus using the long-term monitoring data only (reproduced with permission from Peterson et al. 2020).
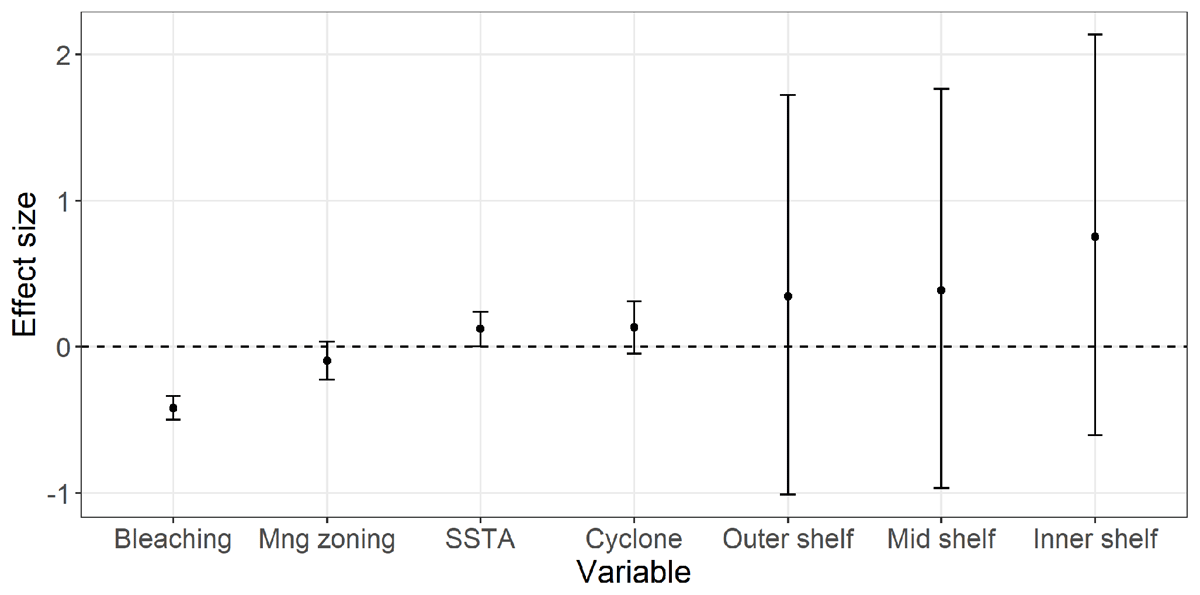
Figure 8
Effects of model covariates with (a) all data combined and (b) professional data only. The dots show the estimated mean and error-bars associated 95% credible intervals.