
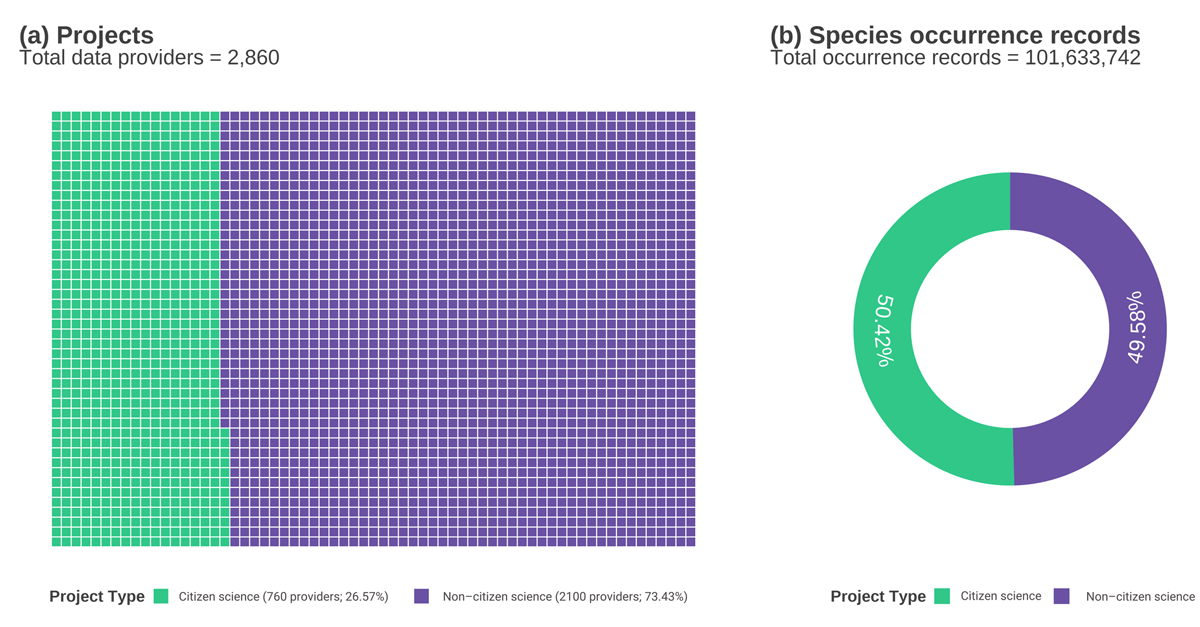
Figure 1
Proportion of (a) research or monitoring projects that provide data to the ALA that use citizen science or not, and (b) the proportion of species occurrence records derived from citizen science or non–citizen science projects. Data displayed includes both publicly available and embargoed project data held in BioCollect as of February 2022. The BioCollect platform is an event-based data recording system in which individual recording events can yield many occurrence records. Total numbers of species occurrence records from citizen science projects in BioCollect projects were estimated by aggregating the counts of embargoed and unembargoed occurrence records for each project.
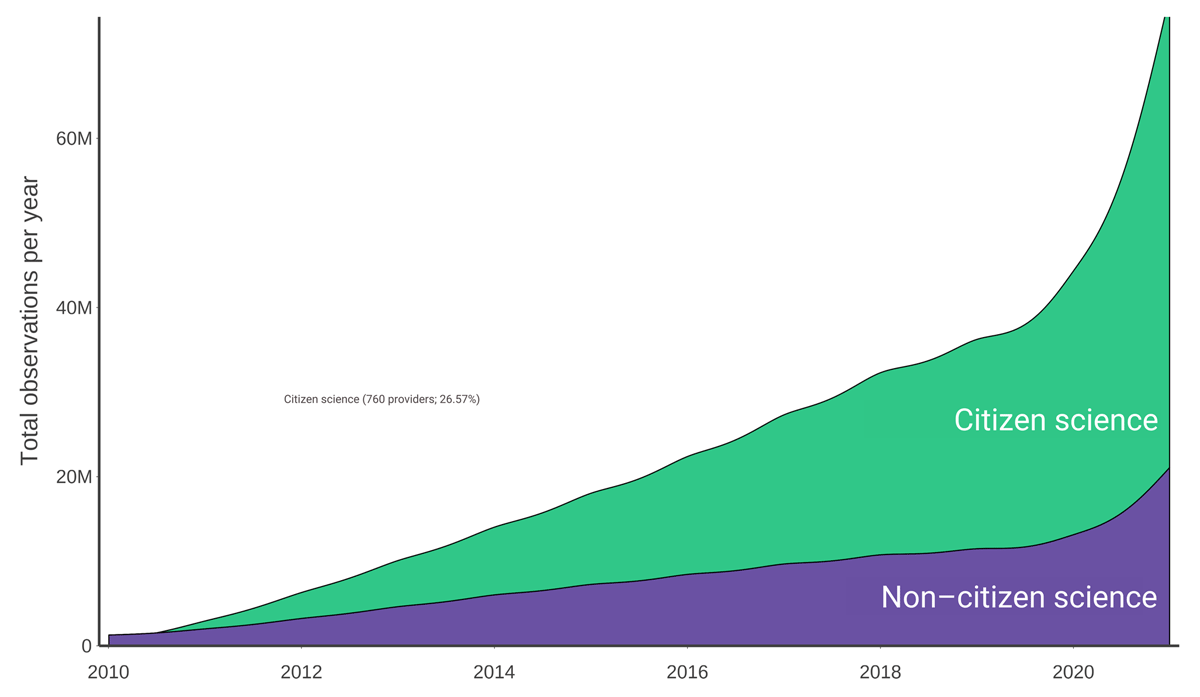
Figure 2
Proportion of the total number of records added to the Atlas of Living Australia from 2010 to 2021 collected using citizen science or non–citizen science methods.
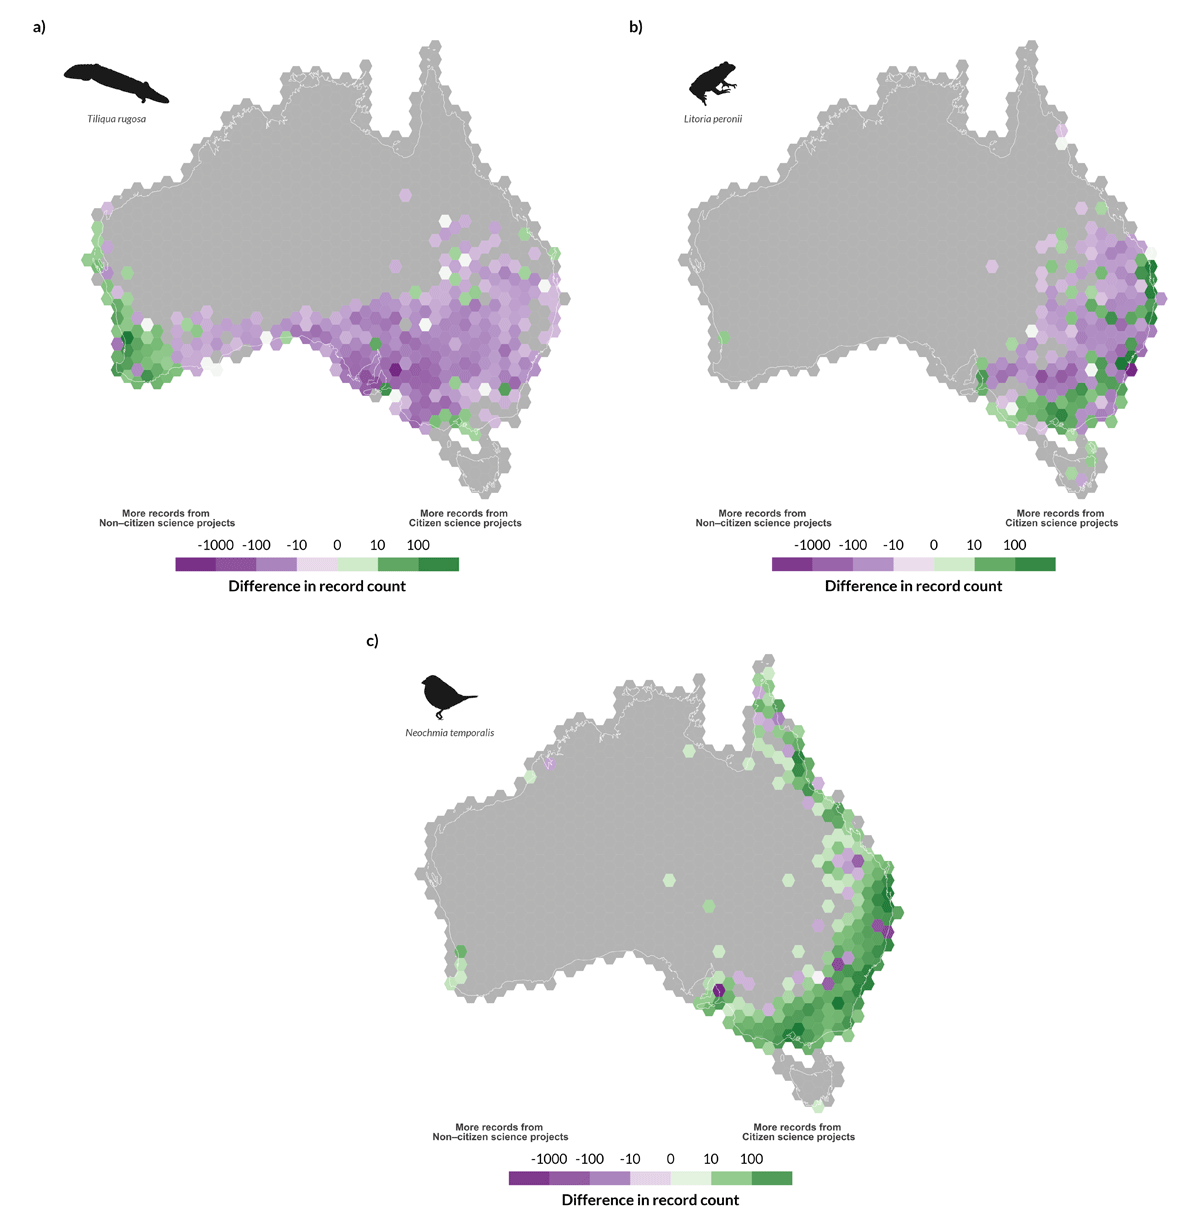
Figure 3
Distribution of (a) Tiliqua rugosa (shingleback skink); (b) Litoria peronii (Peron’s tree frog); and (c) Neochmia temporalis (Red-browed firetail). Map displays locations with a greater number of species observation records collected using citizen science methods (green) or non–citizen science methods (purple). A darker colour of hexagon corresponds to a greater difference in the number of records between citizen science and non–citizen science records. Record counts are pseudo-log transformed to allow for log standardisation of both positive and negative numbers.
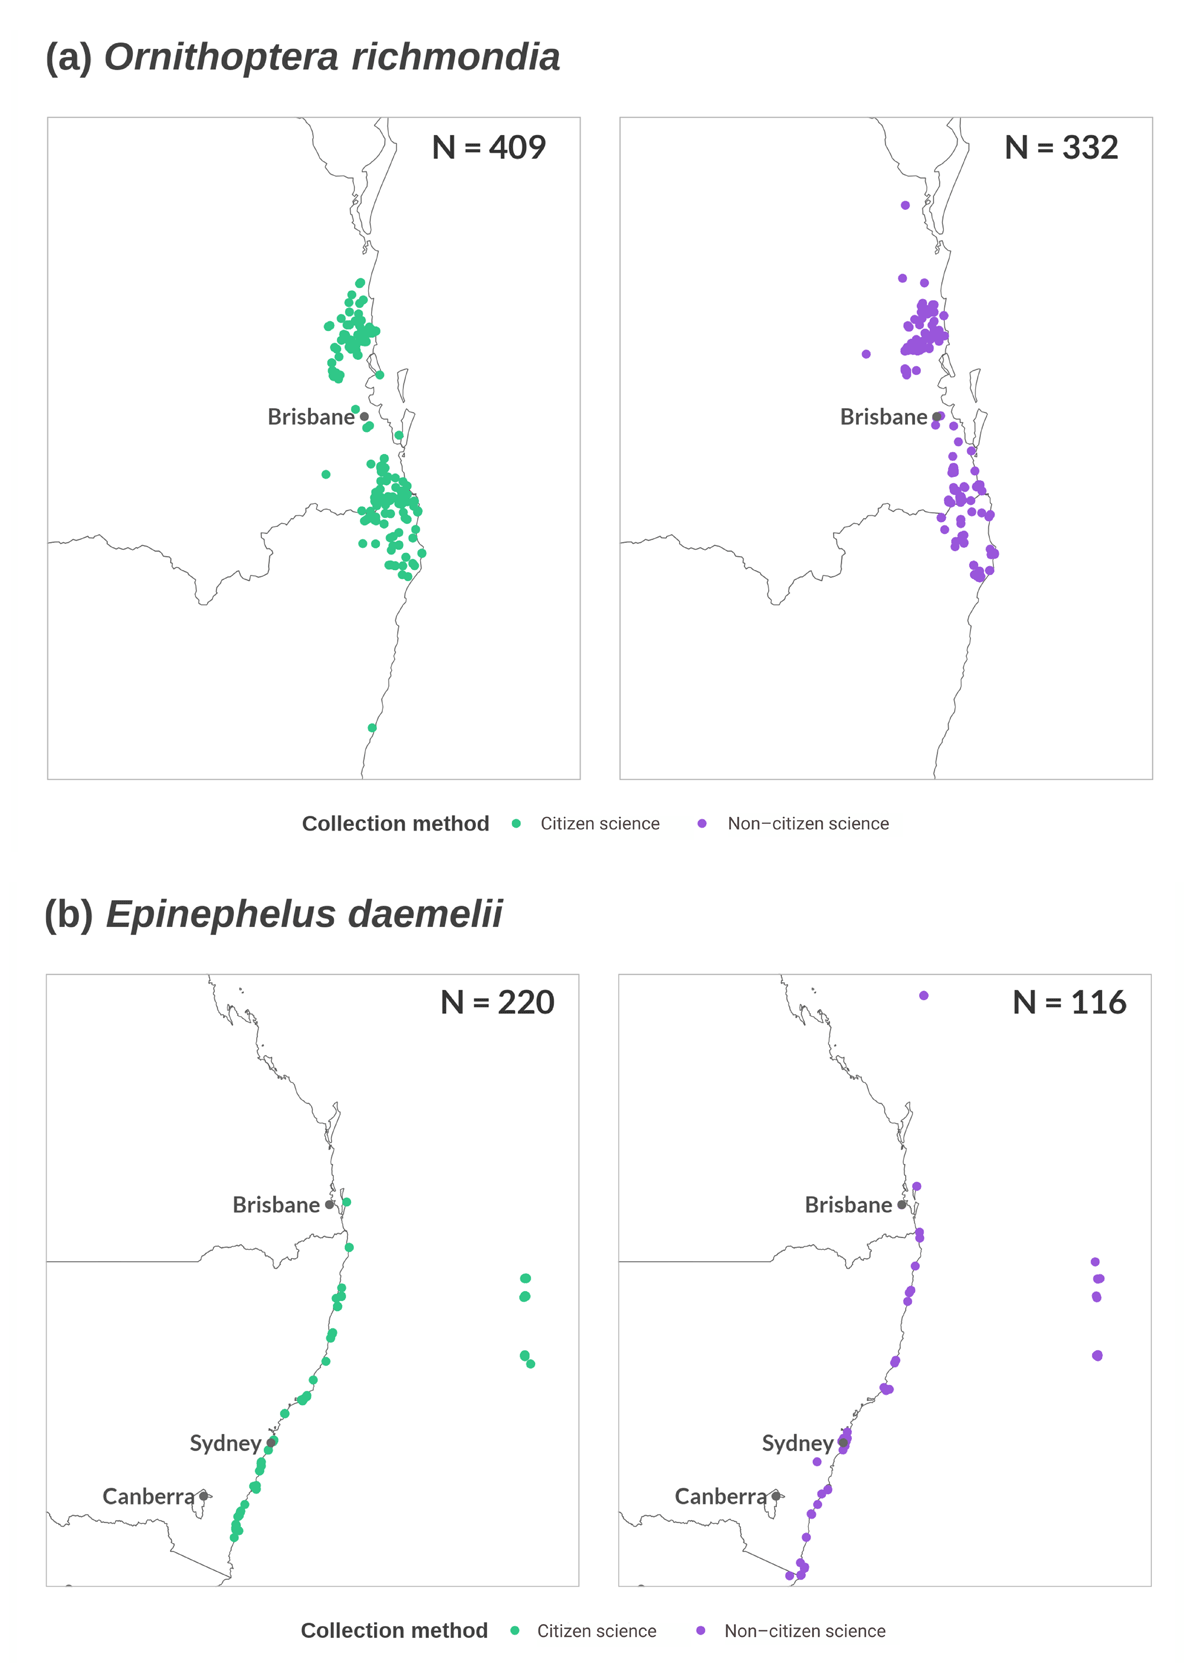
Figure 4
Distribution of two range-limited species, the (a) Ornithoptera richmondia (Richmond Birdwing); and (b) Epinephelus daemelii (Black Rockcod). Map displays observations of both citizen science and non–citizen science records as well as the total number of records for each species by reporting category.