
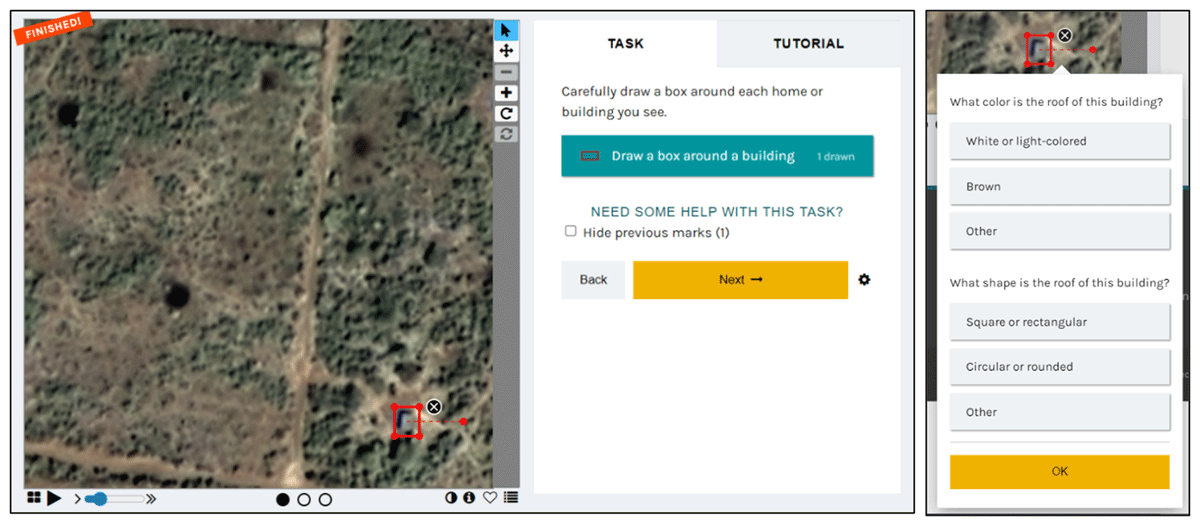
Figure 1
Citizen science annotation interface (left) alongside the context menu multiple choice questions for each home annotation (right).
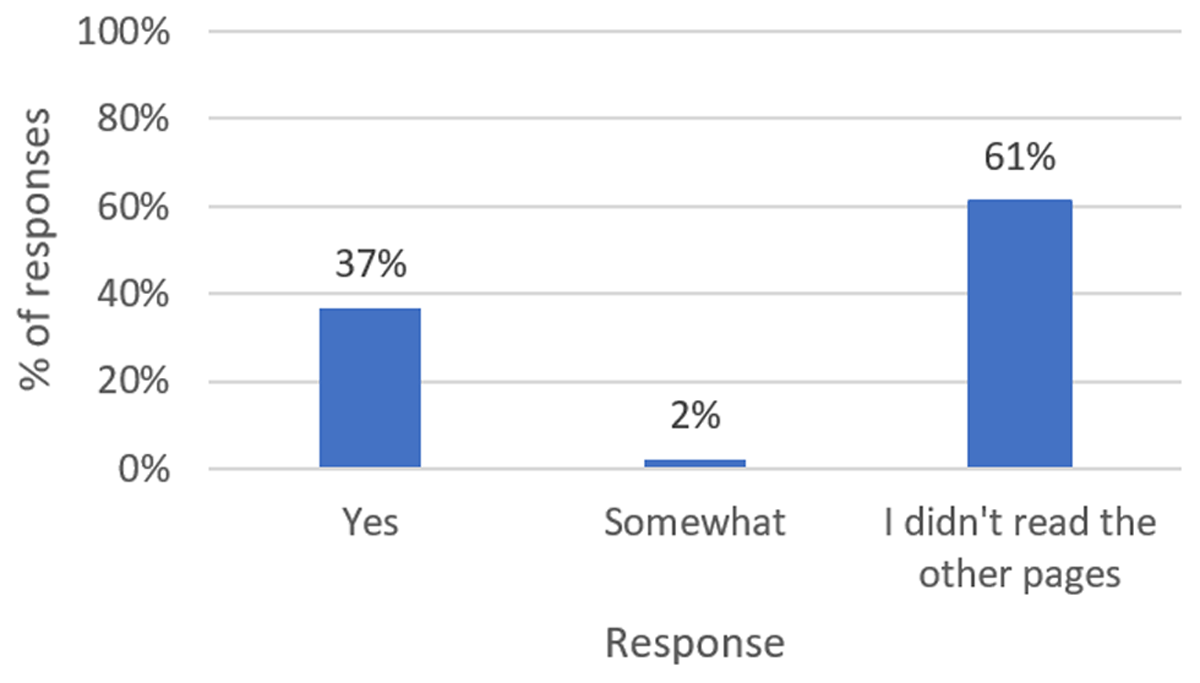
Figure 2
Beta form responses to the question “Did you find the additional information on other pages useful?” (n = 49). Note that most beta testers did not read the information pages beyond what was available on the homepage and the annotation interface.
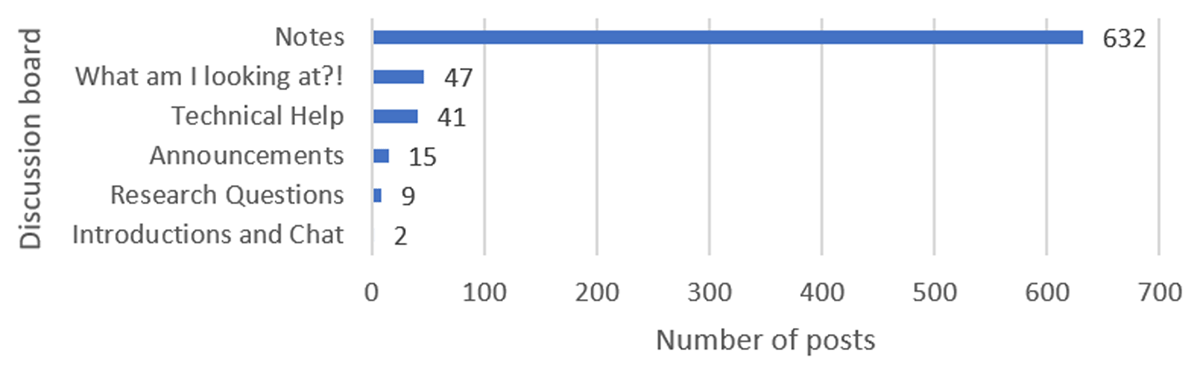
Figure 3
Number of posts per Power to the People “Talk” discussion board throughout the project, with moderator and researcher posts excluded.
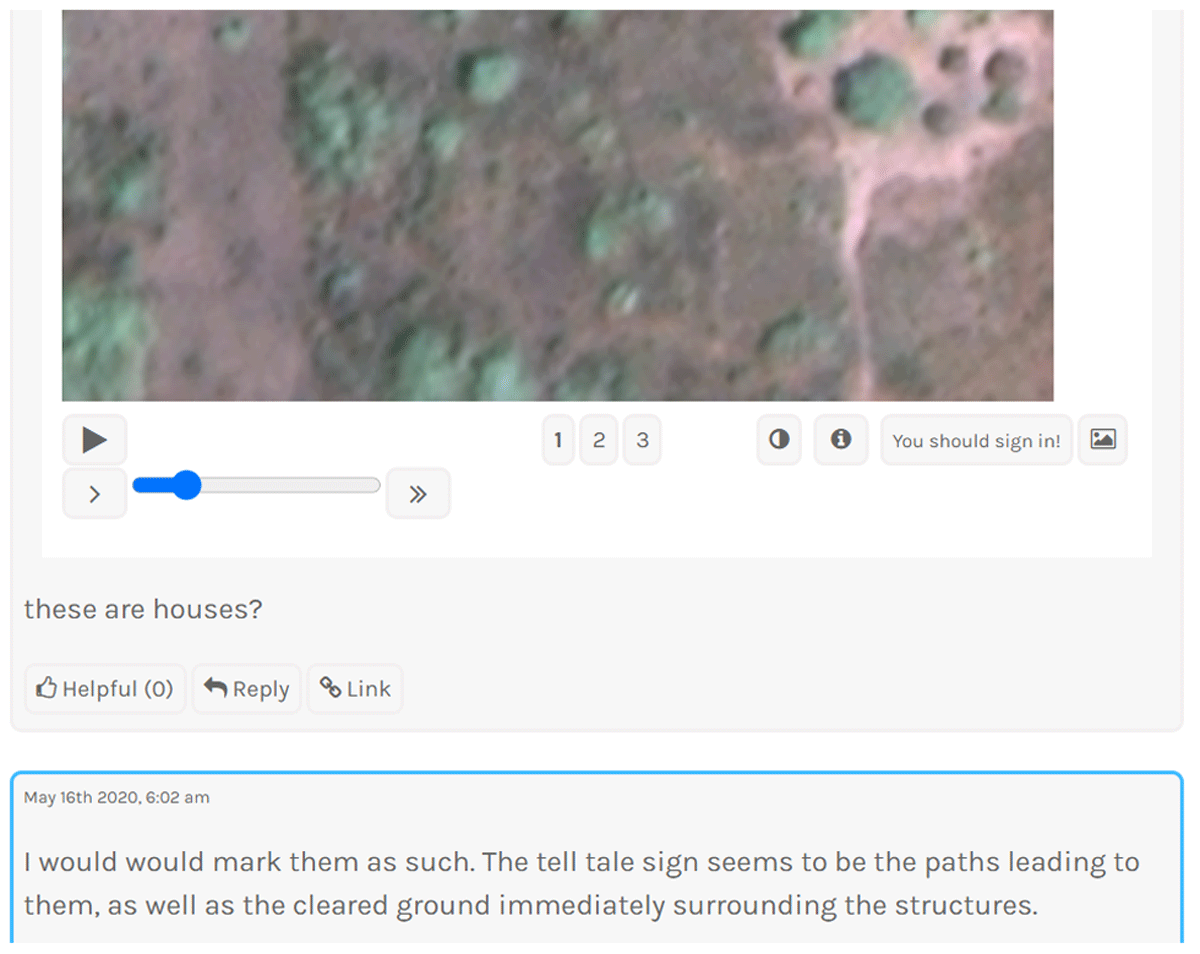
Figure 4
An example of a Notes board post where citizen scientists assisted each other with images and discussed features. Usernames have been removed.
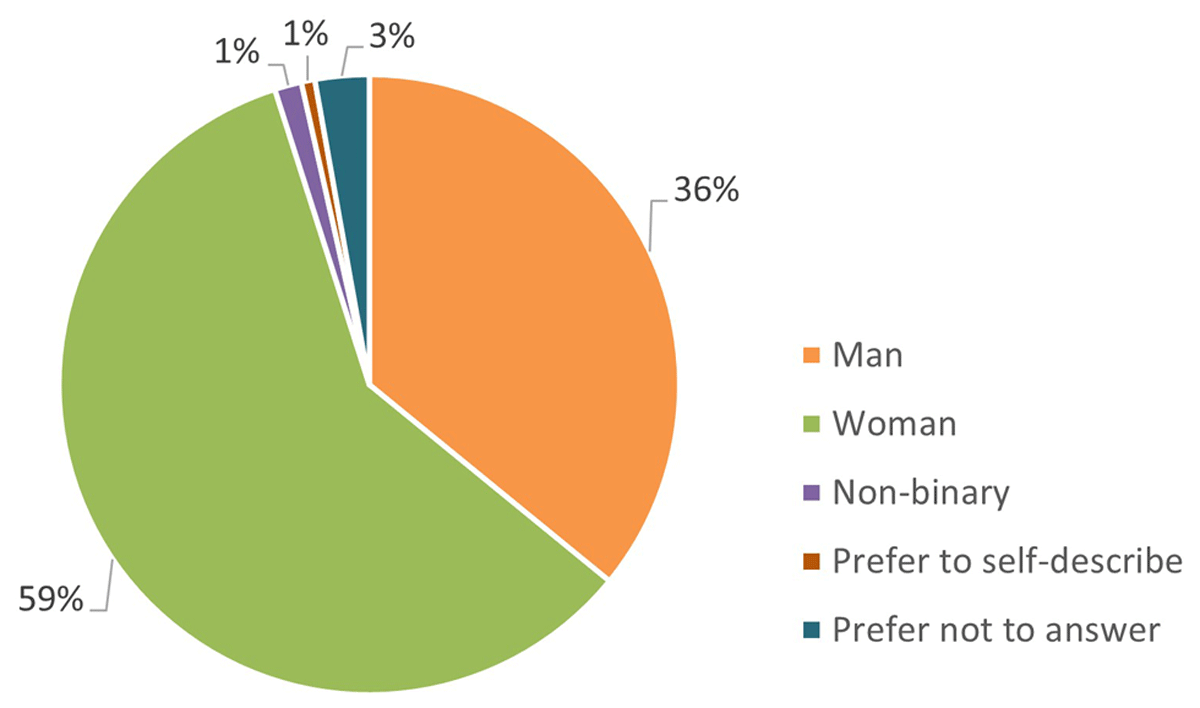
Figure 5
Genders of Power to the People evaluation survey respondents (n = 142). Note the higher proportion of women than men.
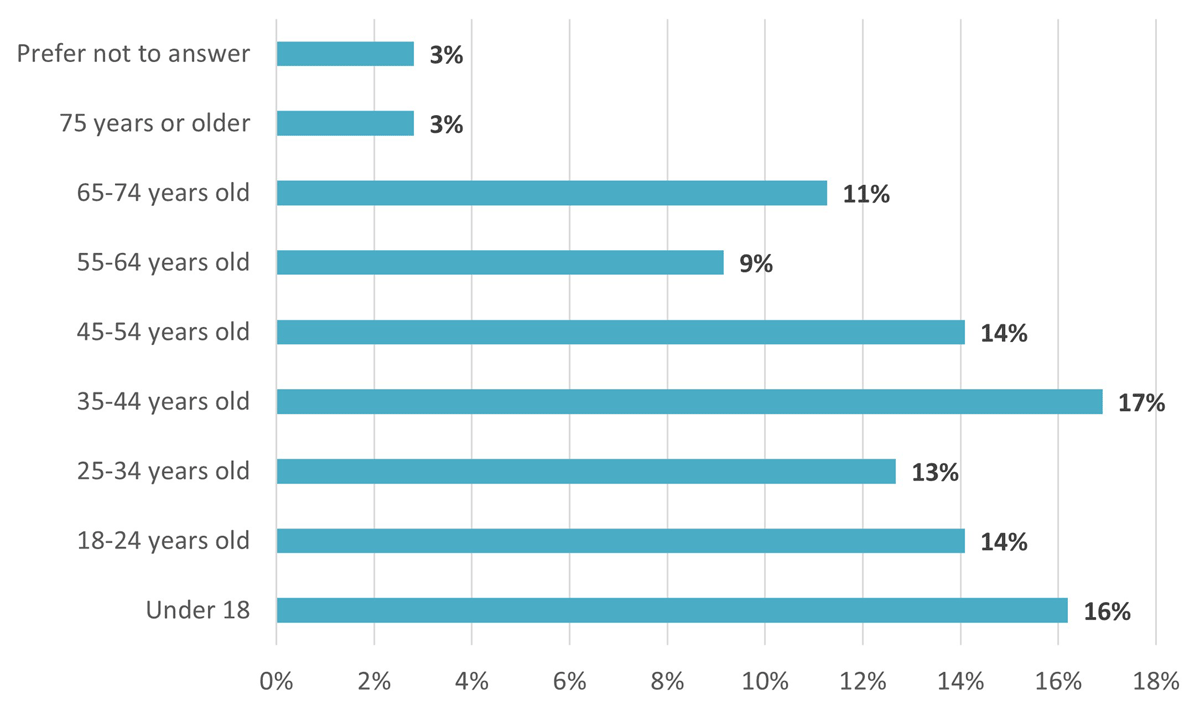
Figure 6
Ages of Power to the People evaluation survey respondents (n = 142).
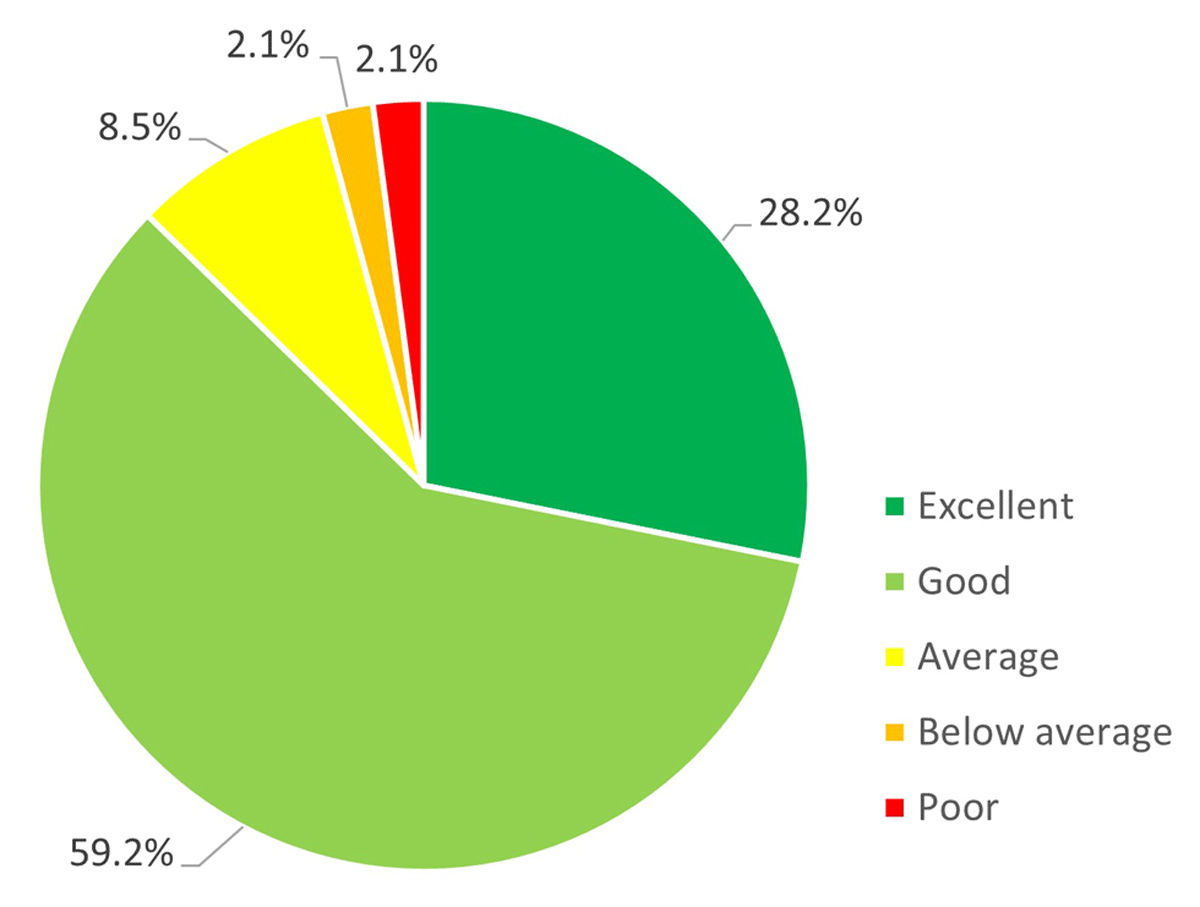
Figure 7
Evaluation responses for contributor experience on Power to the People (n = 142). Note the overwhelming positivity, with 87% choosing either “Good” or “Excellent.”
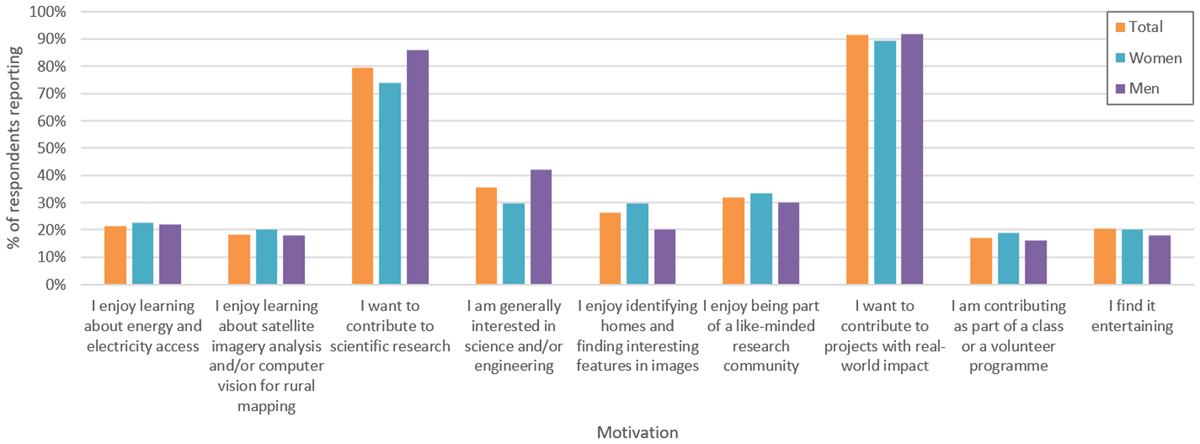
Figure 8
Motivations reported by the evaluation survey respondents who selected any of the predetermined options (n = 141), for women (n = 84) and for men (n = 50).
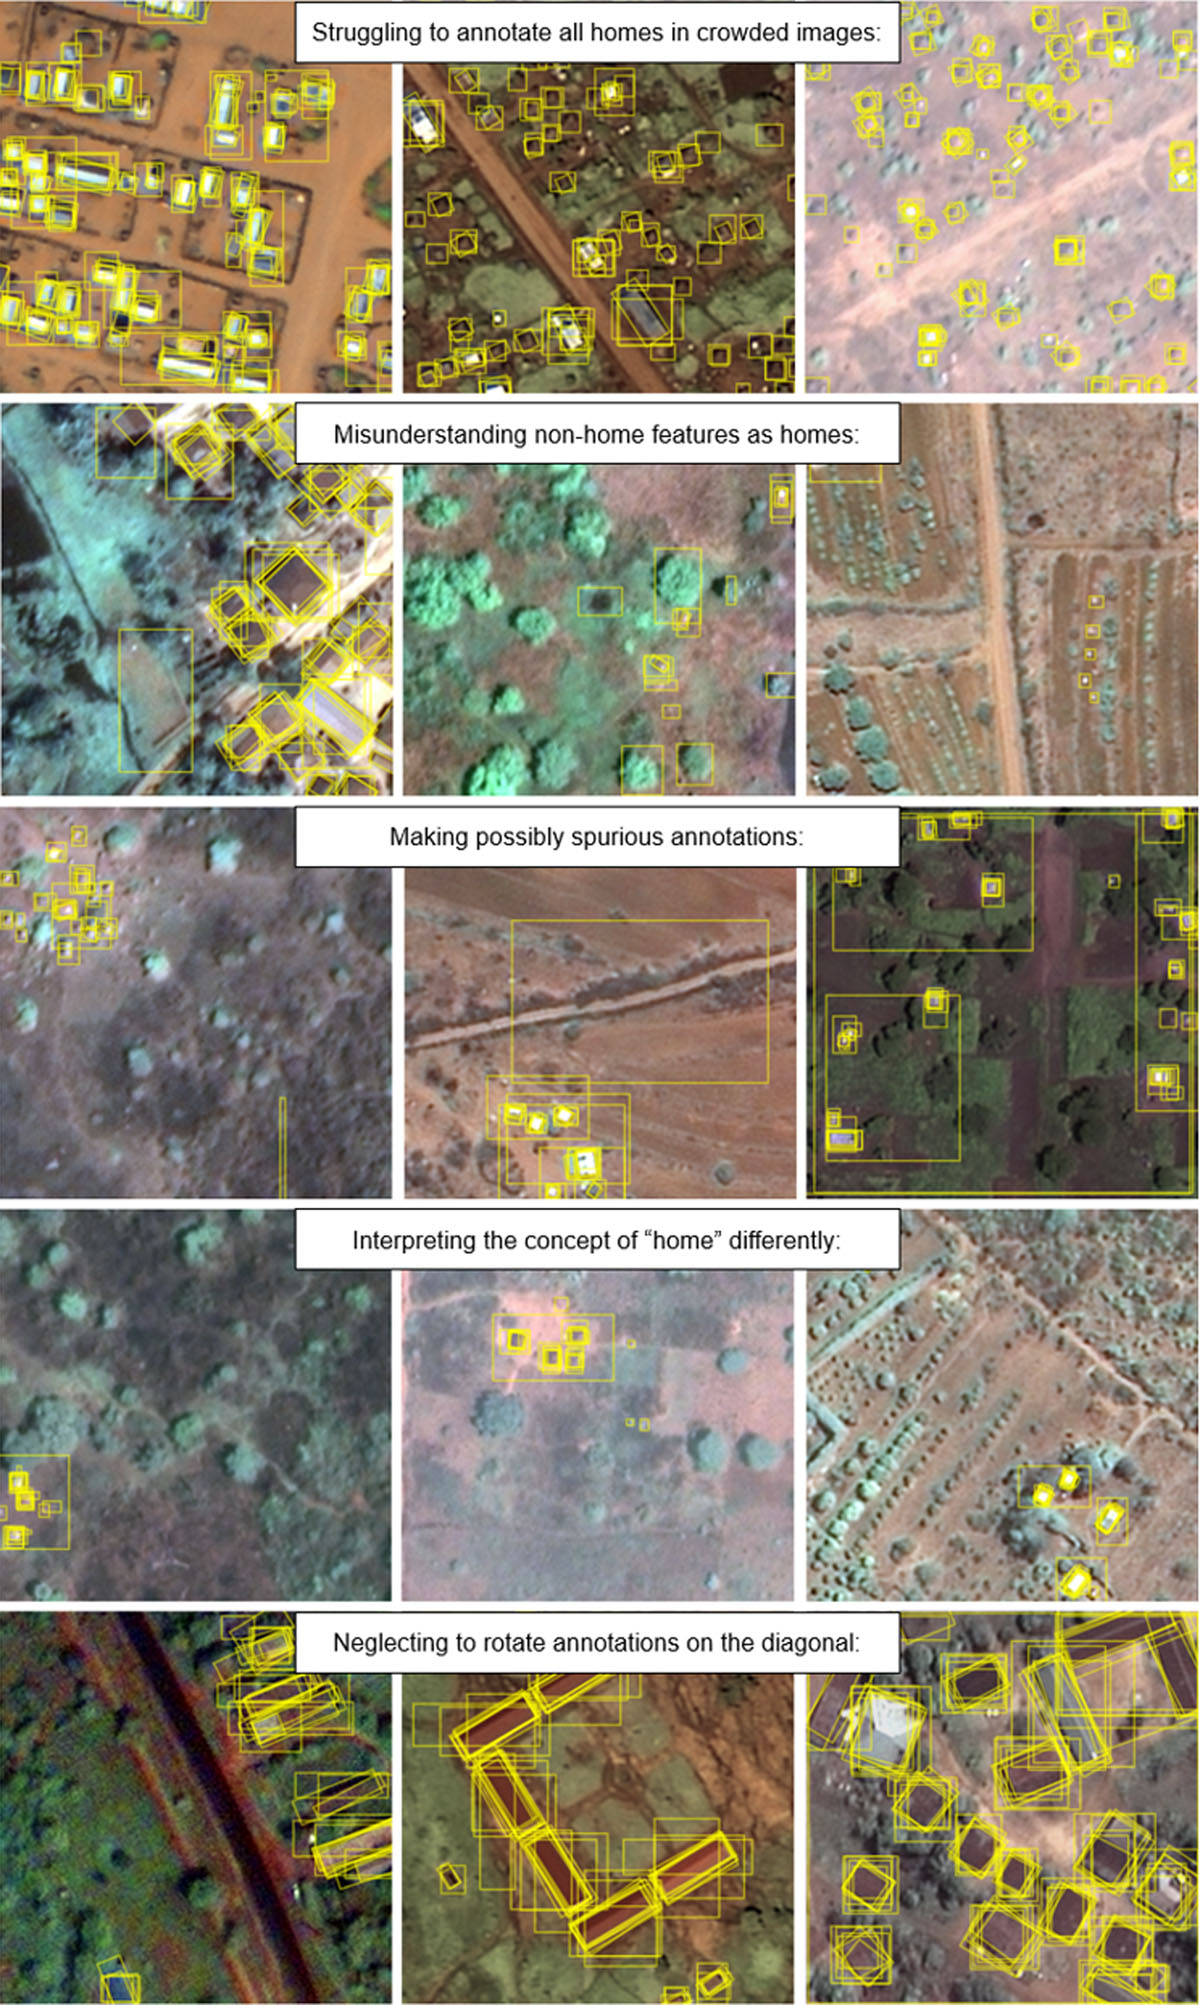
Figure 9
Issues faced by citizen scientists in annotating homes on Power to the People. Individual home annotations are visualized as yellow boxes.