

Figure 1
Comparison of the three different methods of digital grid placement. Grey squares represent the quadrat frame and coloured squares represent the digital grid outline (not including the intercepts). (a) Method 1 (purple) had a 10x10 point grid, (b) Method 2 (green) had a 10x10 point grid, (c) Method 3 (yellow) had a 13x13 point grid.
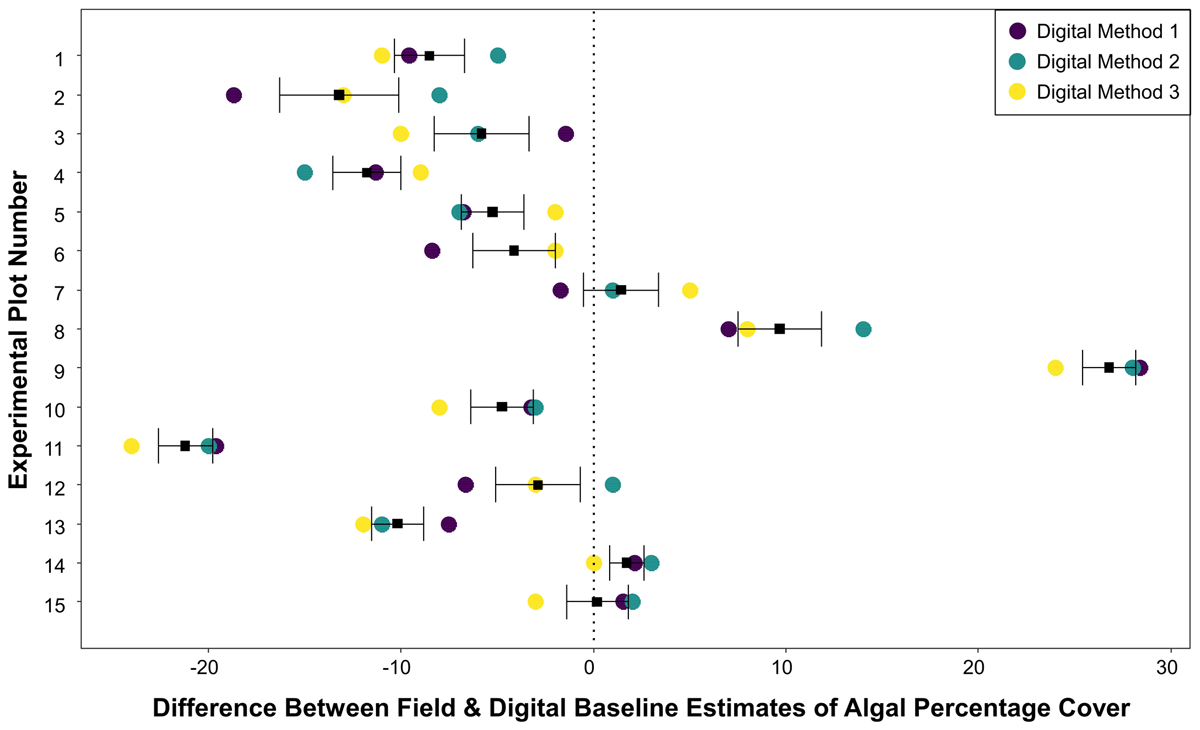
Figure 2
Differences between field estimates of algal percentage cover generated by trained citizen scientists and digital baseline estimates generated by a professional scientist using the three different methods of grid placement across 15 plots. Coloured circles represent differences, calculated as a field estimate minus a digital baseline estimate, per digital baseline method (Figure 1). Black squares and error bars represent the mean difference across the three baseline estimation methods ±1 standard error.
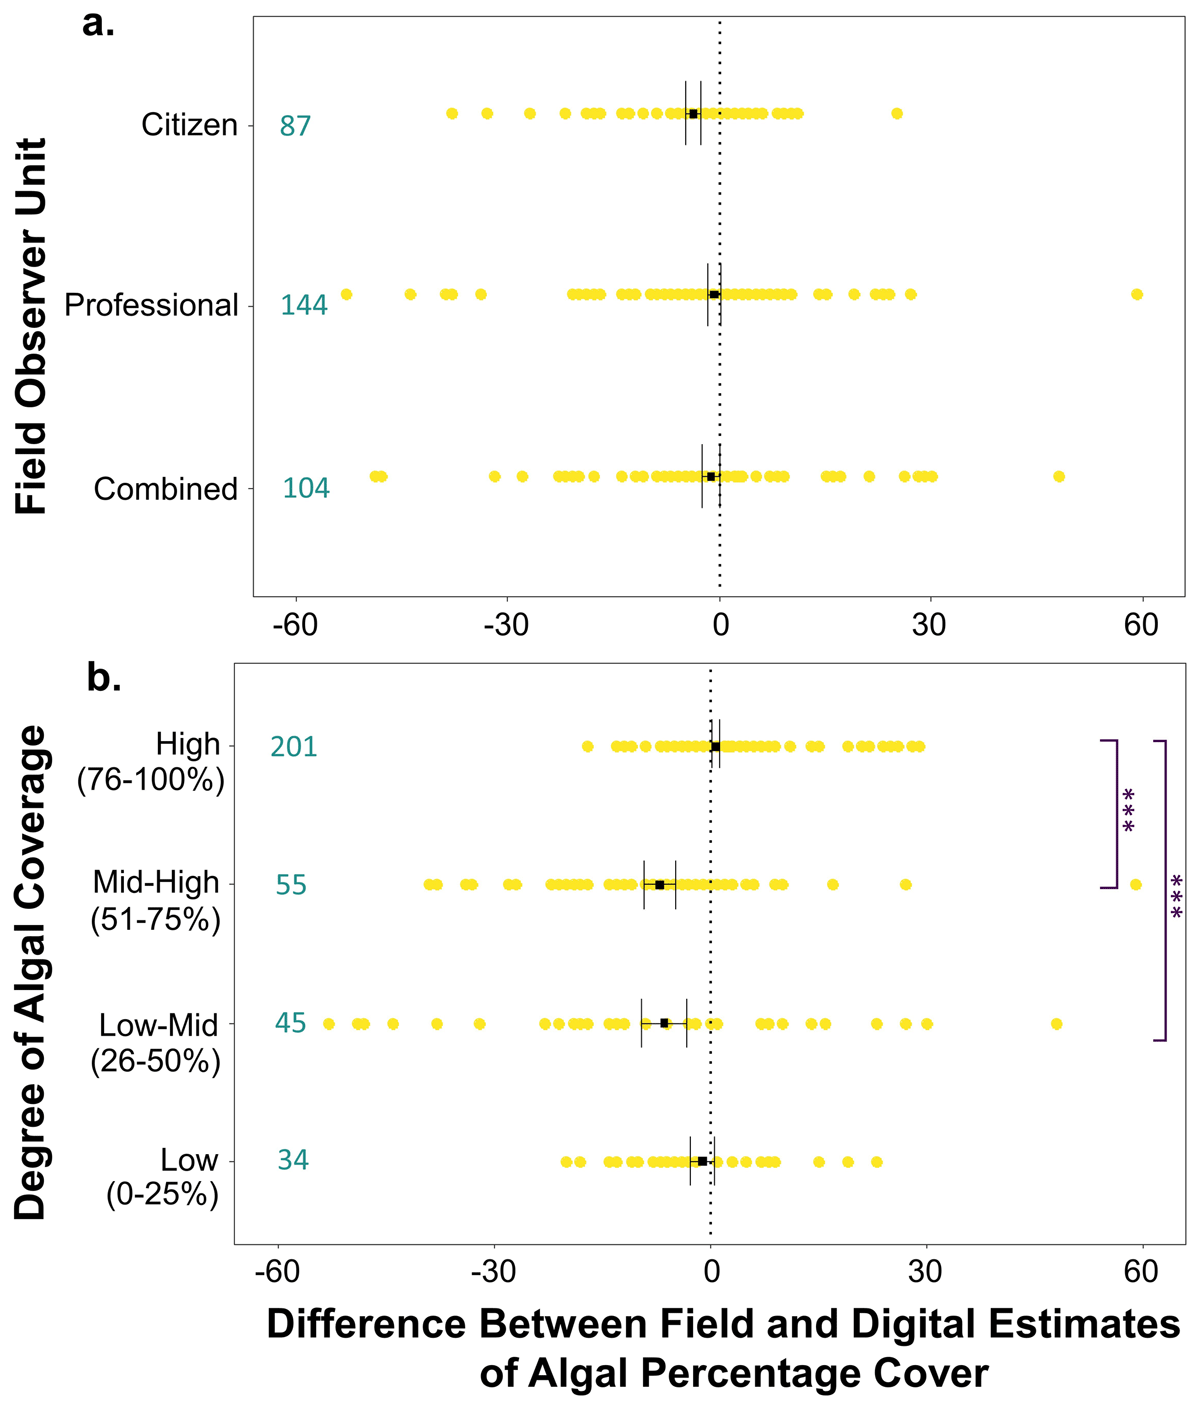
Figure 3
Differences between field and digital baseline estimates of algal percentage cover across (a) three different types of field observer units and (b) different levels of algal cover. Yellow circles represent differences, calculated as field estimates minus digital baseline estimates (generated using the third method of digital grid placement; Figure 1c) per plot. Black squares and error bars represent the mean variation across all plots ±1 standard error. Values in turquoise represent the number of plots. Significant post hoc Tukey-adjusted comparisons for single fixed effects are indicated as *** = p < 0.05.