

Figure 1
Radon risk potential by study county.
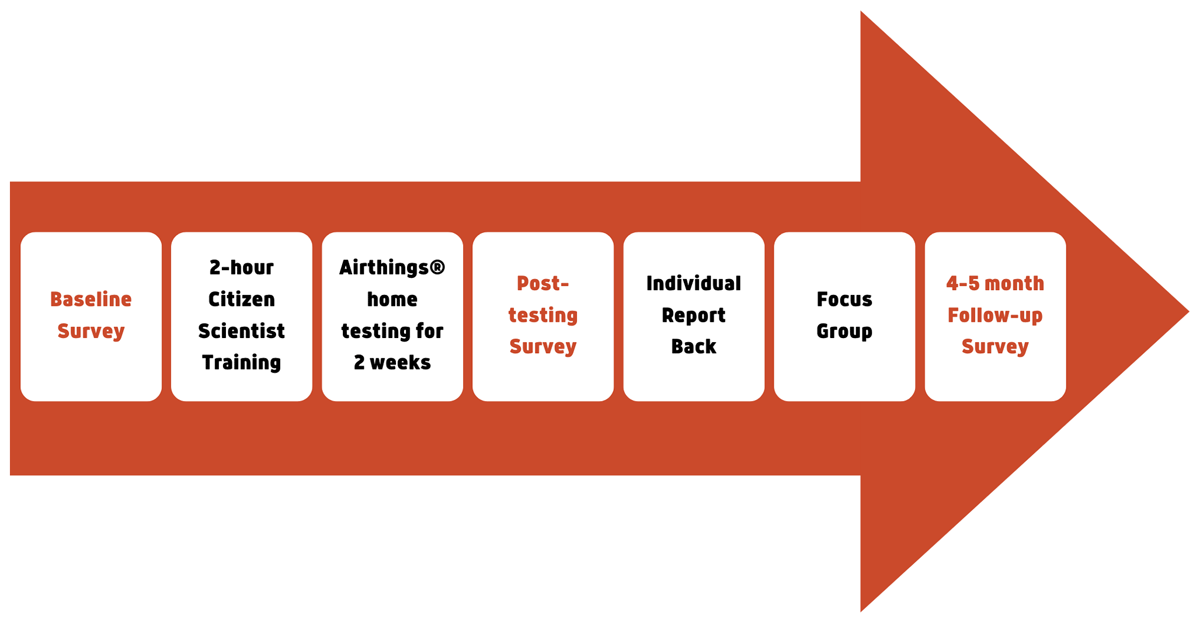
Figure 2
Data collection, training, radon testing, and report back time points.
Table 1
Citizen Science Training.
| TRAINING CONTENT | LENGTH OF TIME IN MINUTES |
|---|---|
| Introduction to the RADAR team members | 2 |
| Overview of the study goals | 2 |
| Role of the citizen scientist as a member of the study team | 3 |
| Study participation guidelines | 3 |
Introduction to radon, radon testing & mitigation
| 40 |
| Break | 10 |
Use of Airthings Corentium Home Radon Detector
| 30 |
| Review schedule of 2-week testing period | 3 |
| How to report daily and 2-week long-term radon values | 15 |
| Review recommended action, including use of study mitigation voucher, if home tests ≥ 4.0 pCi/L | 2 |
| Q&A | 10 |
| Total time | 120 |
Table 2
Demographic, personal and home characteristics of the citizen scientist participants (N = 60).
| CHARACTERISTIC | MEAN (SD) OR N (%) |
|---|---|
| Age | 51.3 (13.5) |
| Gender | |
| Male | 18 (30.5%) |
| Female | 41 (69.5%) |
| Race/ethnicity | |
| White, non-Hispanic | 51 (86.4%) |
| Black or African American | 7 (11.9%) |
| More than one race/ethnicity | 1 (1.7%) |
| Education | |
| High School/GED | 5 (8.3%) |
| At least some post-secondary (college/vocational) | 32 (53.4%) |
| Postgraduate education | 23 (38.3%) |
| Annual household income | |
| <$45,000 | 11 (19.3%) |
| $45,000 — < $90,000 | 28 (49.1%) |
| $90,000 and above | 18 (31.6%) |
| Family history of lung cancer | |
| Yes | 14 (23.3%) |
| No | 46 (76.7%) |
| Any tobacco users of cigarettes, cigars, or pipes in the home, including participant | |
| Yes | 9 (15.0%) |
| No | 51 (85.0%) |
| Average radon level in home, during 2-week testing | |
| Below the EPA action level of 4 pCi/L | 33 (55.0%) |
| At or above the EPA action level of 4 pCi/L | 27 (45.0%) |
| Radon level, averaged over the 2-wk testing period | 7.0 (10.1) |
Table 3
Summary of repeated measures mixed models, including means and standard deviations at each timepoint, F tests for the time main effect, and post-hoc testing (N = 60).
| OUTCOME (POTENTIAL RANGE) | MEANS AND STANDARD DEVIATIONS AT EACH SURVEY COMPLETION POINT | F TEST AND (P) FOR TIMEPOINT AND RESULTS OF POST-HOC TESTING* | ||
|---|---|---|---|---|
| BASELINE (TIME 1) | POST-TESTING (TIME 2) | 4–5 MONTHS AFTER POST-TESTING (TIME 3) | ||
| Environmental health literacy (0–14) | 8.9 (0.9) | 11.4 (1.0) | 11.9 (1.0) | 184.8 (<.001) 1 < 2 < 3 |
| Response efficacy (0–12) | 9.9 (1.5) | 10.3 (1.5) | 10.2 (1.6) | 1.6 (.22) n/a |
| Health information efficacy (0 – 8) | 5.1 (1.4) | 6.0 (1.6) | 6.2 (1.5) | 14.0 (<.001) 1 < 2, 3 |
| Self-efficacy to test for radon (0–12) | 9.7 (1.6) | 10.5 (2.0) | 10.7 (1.5) | 12.0 (< .001) 1 < 2, 3 |
| Self-efficacy to contact radon mitigation pro (0–12) | 8.0 (2.2) | 8.4 (1.8) | 9.1 (2.0) | 6.1 (.004) 1, 2 < 3 |
| Self-efficacy to hire radon mitigation pro (0–12) | 7.0 (2.8) | 7.0 (2.4) | 7.6 (2.9) | 1.6 (.22) n/a |
[i] Notes: For each outcome, a higher score indicates greater literacy/ efficacy; education and the indicators for high radon at baseline, family history of lung cancer, and tobacco users in the home were included as covariates in each model.
* Pairwise comparisons significant at alpha < .01 are noted.