
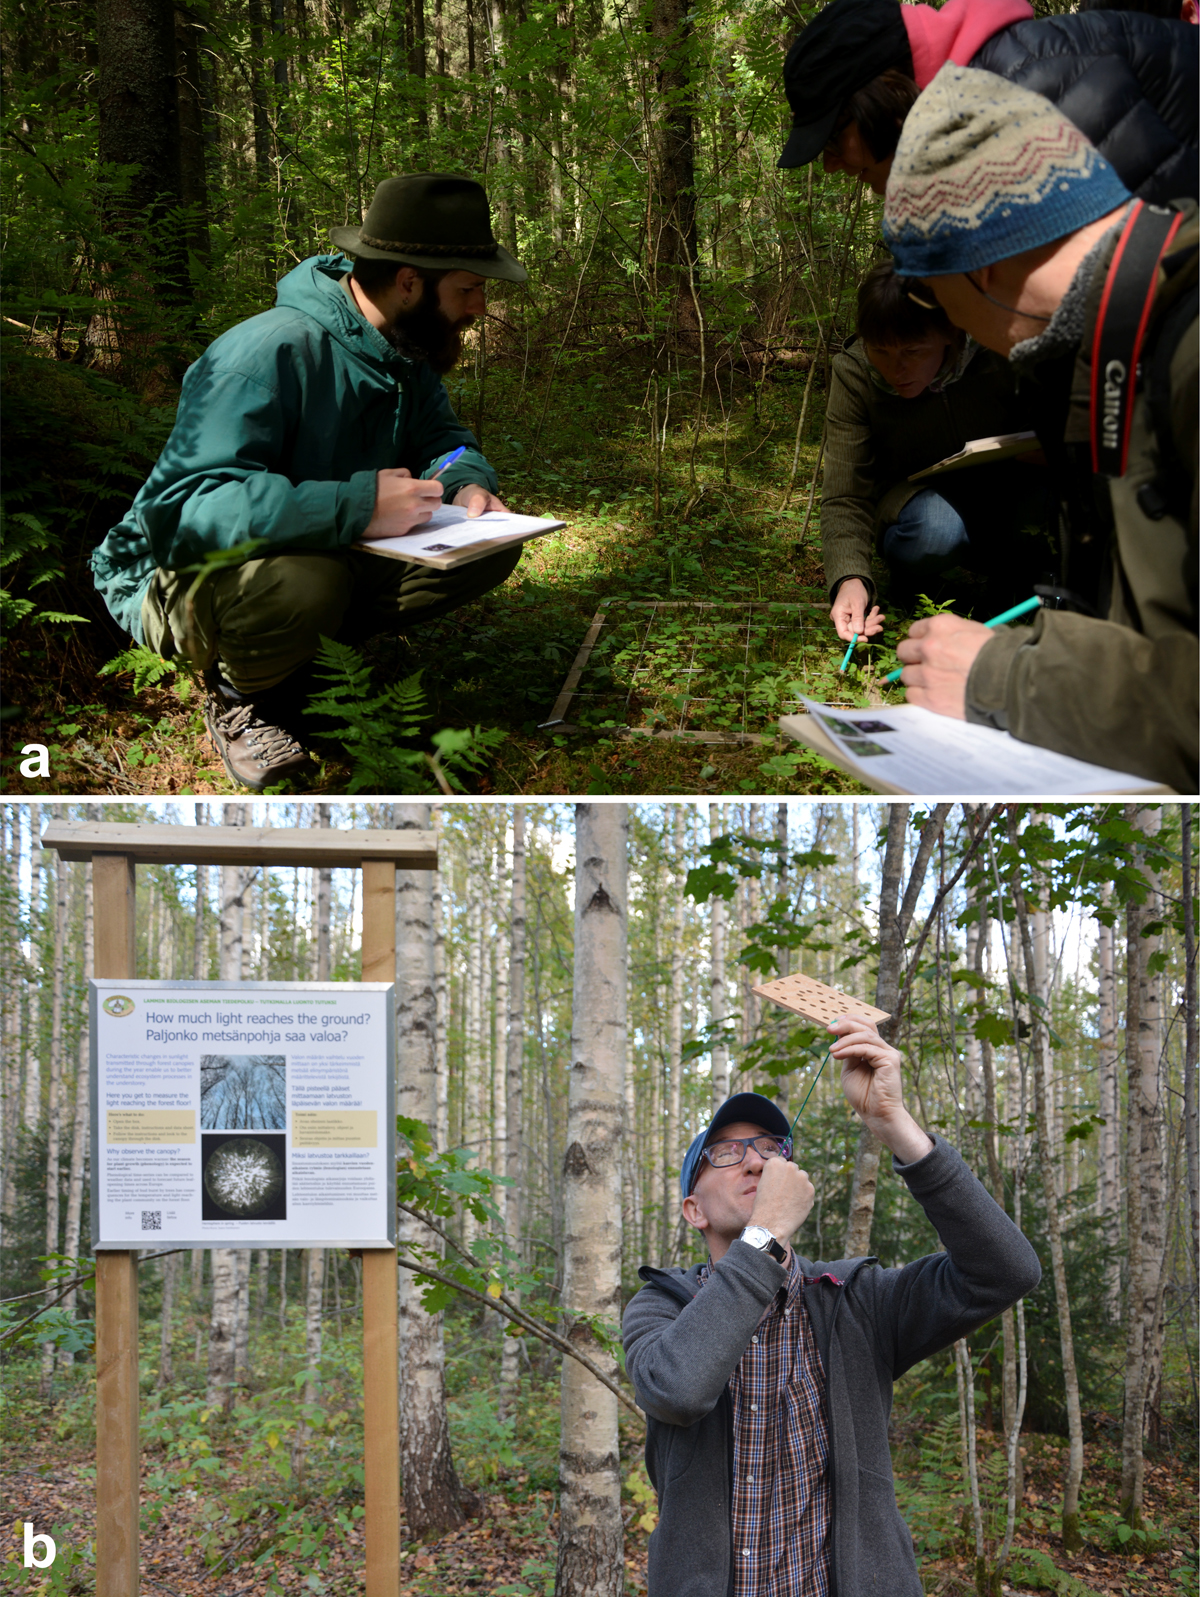
Figure 1
(a) Some participants doing Activity 1 at the location of the quadrate vegetation survey. Photo by TC La Brijn. (b) Matthew Robson demonstrating the canopy observation activity (Activity 2) in front of the information board. Photo by SM Hartikainen.
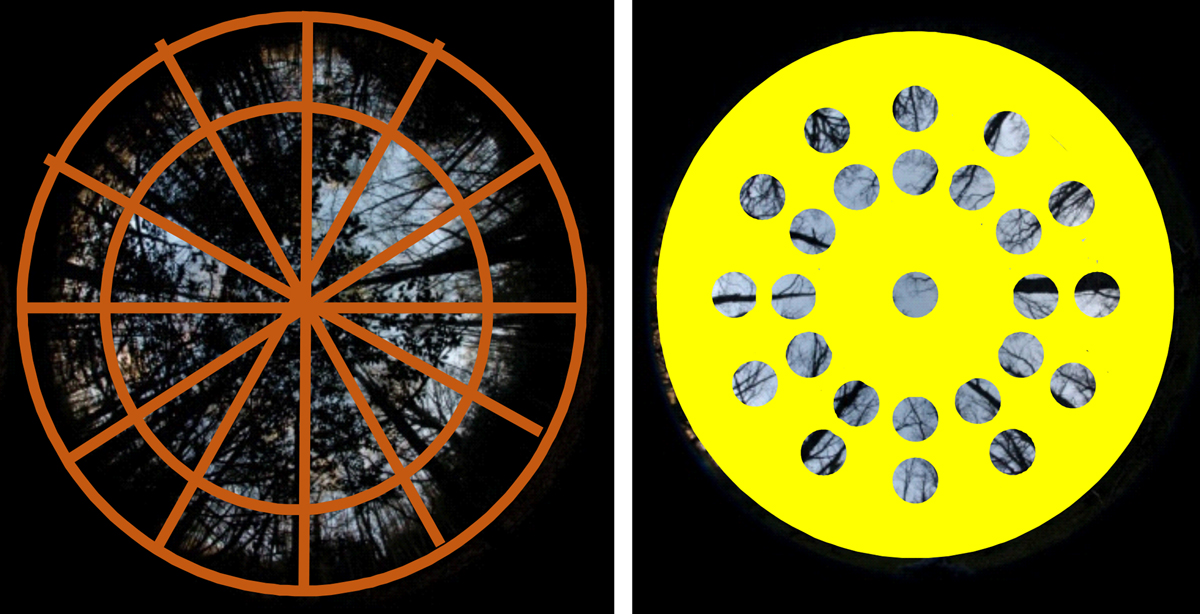
Figure 2
Development of the design of the canopy observation disk shows (left) 24 transparent sectors in the canopy projection, and (right) an arrangement of 25 holes of 10-mm diameter cut through a solid wooden panel with a drill.
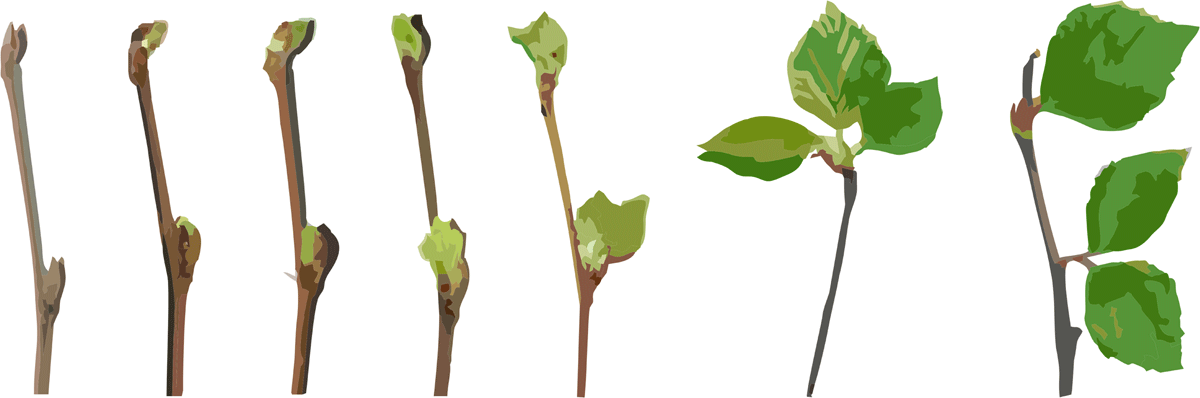
Figure 3
Key to the stages of Betula sp. (birch) spring phenology. These seven images show the progression of canopy flushing (bud burst and leaf unfolding). Redrawn using Kubin et al. (2007) as a template.
Table 1
Results of the vegetation survey activity on the main understorey species from quadrats in spruce and oak stands, and from researcher-collected data at the deciduous stand level. Full data are given and presented graphically in the supplemental material.
| SPECIES | TRAIT | SPRUCE STAND | OAK STAND | DECIDUOUS STAND |
|---|---|---|---|---|
| Overall | Number of species | 3–5 species Decline starting 2016-08-28 | 4–6 species Spring ephemerals 2017-05-01 to 2017-08-06 | NA |
| Cover | Increasing from 55% to 100%, 2017-05-01 to 2017-05-10 | Spring 60%, autumn 20% | NA | |
| Oxalis acetosella | Cover | 100% cover throughout | Increasing from 10% to 50% 2017-05-01 to 2017-08-06 | Increasing to 25% by 2016-07-02 |
| Unfolded leaves | 100% apart from sunny days 2016-08-23 and 2016-08-25 (80%) | Variable % from 2016-to-09-08, but always lower than spruce stand Spring 2017, 10% initially, rising to 70%. | > 80% from 2016-05-17to 2016-06-18. Spring 2016, < % 80 | |
| New leaves | Summer cohort starting 2016-08-25 Spring cohort starting 2017-05-15 | Timing as spruce stand, but fewer leaves | Spring cohort starting 2016-05-11 | |
| Flowers/seeds | Flowers 2017-05-06 to 2017-06-06 Seed pods from 2016-08-30 | No flowers recorded Seed pods from 2016-09-26 | Flowers 2016-06-05 to 2016-05-11 | |
| Fragaria vesca | Cover | 10–20% in spring 2017 20–100% in summer 2016 | 30–40% in spring 2017 As spruce 20–100% in summer 2016 | Increasing from 5% to 10% in spring 2016 |
| New stolons | From 2016-09-01 onwards in autumn only | From 2017-05-30 onwards through summer | From 2016-06-07 | |
| Senescent leaves | 2017-05-27 and 2017-05-28 in spring | 2017-05-30 in spring | NA | |
| Flowers/fruits | Starting 2017-05-28 | Starting 2017-05-27 | Flowers 2016-05-28 Fruiting 2016-06-02 | |
| Hepatica nobilis | Cover | 4–8 leaves per m2 | 2–6 leaves per m2 | ~20% presence in quadrats |
| New leaves | Spring cohort 2017-05-01 to 2017-05-25 Winter leaves from 2016-08-24 | Spring cohort 2017-05-01 to 2017-05-15 No winter leaves | Spring cohort: 2016-05-05 to 2016-05-17 | |
| Senescent leaves | ~50% of leaves from 2017-05-28 | ~50% of leaves from 2017-05-01 | NA | |
| Flowers | From 2017-05-01 | No flowers | From 2016-04-25 |
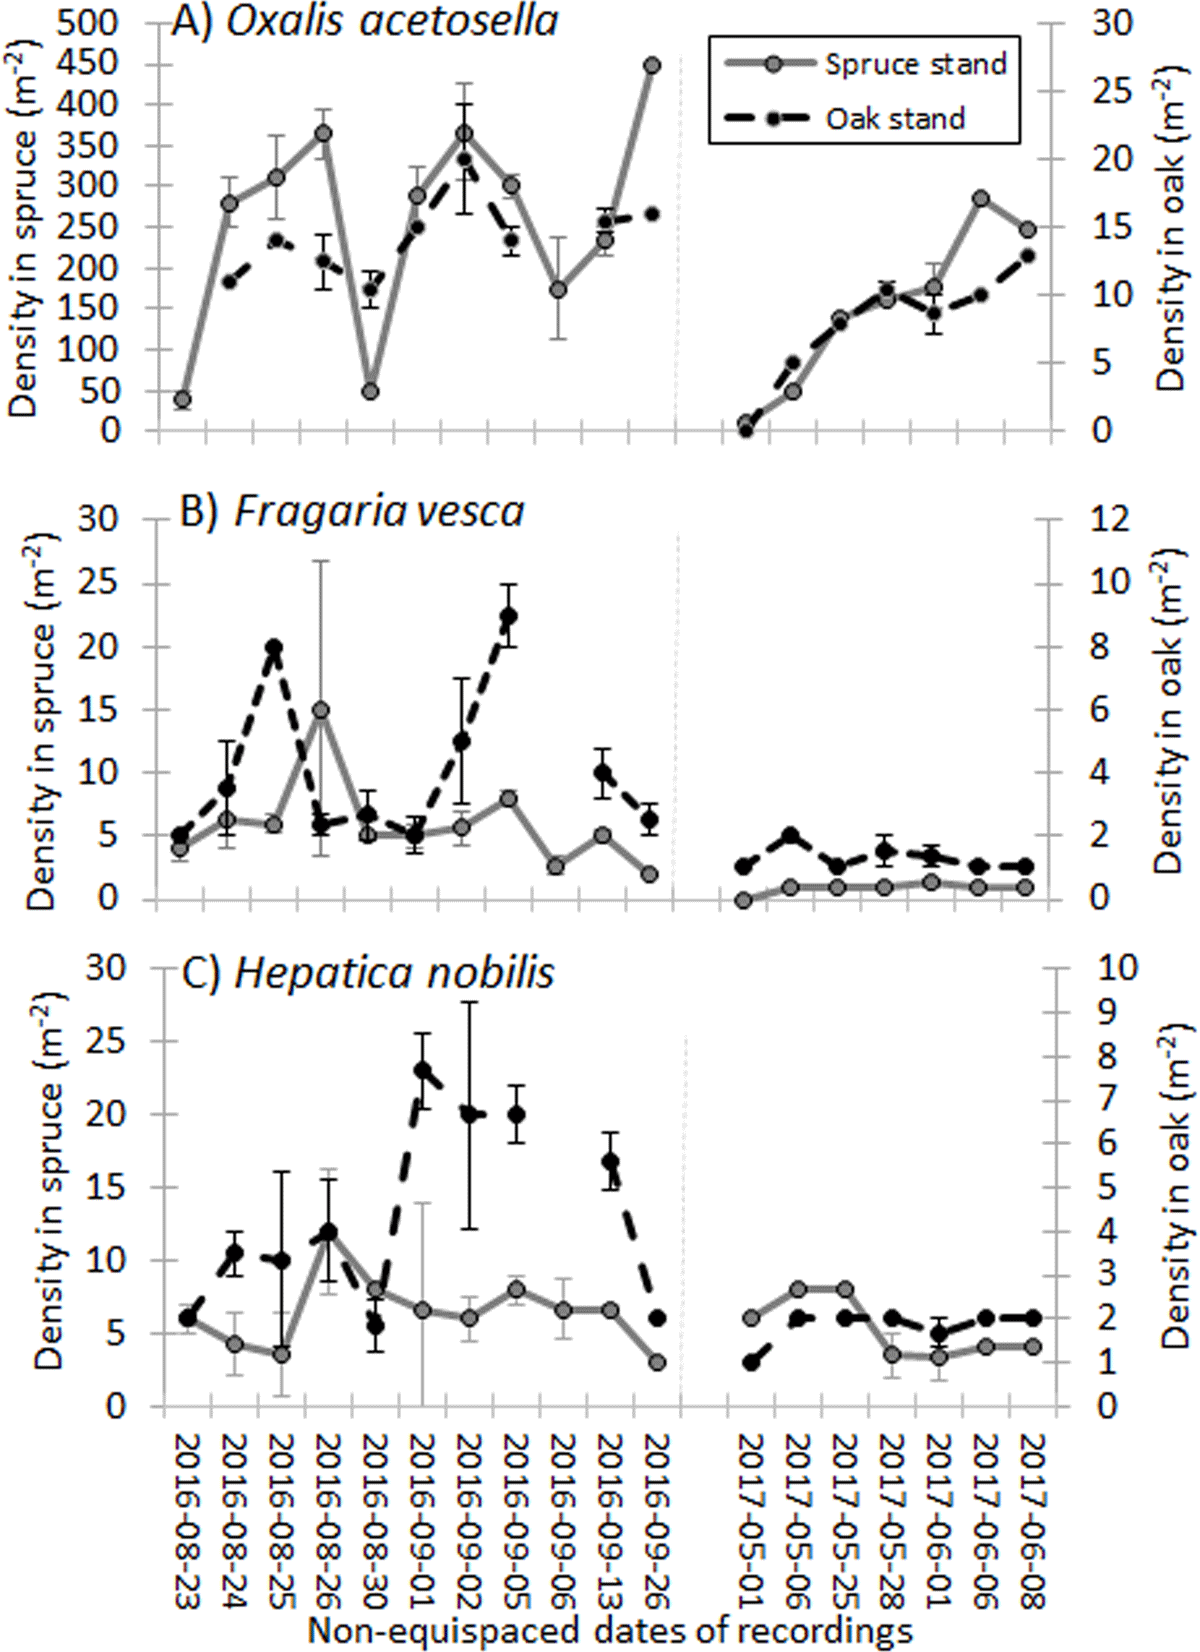
Figure 4
Plot showing a time series of changes in understorey plant cover of three common species, (a) Oxalis acetosella, (b) Hepatica nobilis, and (c) Fragaria vesca), over one year in spruce and oak stand. Data are median ± 1 SE for each set of recordings. Non-equispaced dates of recordings are given on the x-axis, and a grey vertical dotted line marks the start of the winter period under snow when no recordings were possible. Note that Oxalis in the oak stand are plotted on a secondary axis at a far smaller scale for ease of comparison of the trends. Raw data given in the Supplemental Files 2 and 3.

Figure 5
The percentage composition of the canopy viewed through the canopy disk. One year of measurements, twenty-four occasions, at the same location in a Betula sp. stand on Lammi Biological Station Science Trail. (a) Vertical observations looking directly up through the canopy, and (b) “horizontal” cardinal observations, looking at a 45° angle above the horizon in each of the four cardinal directions.
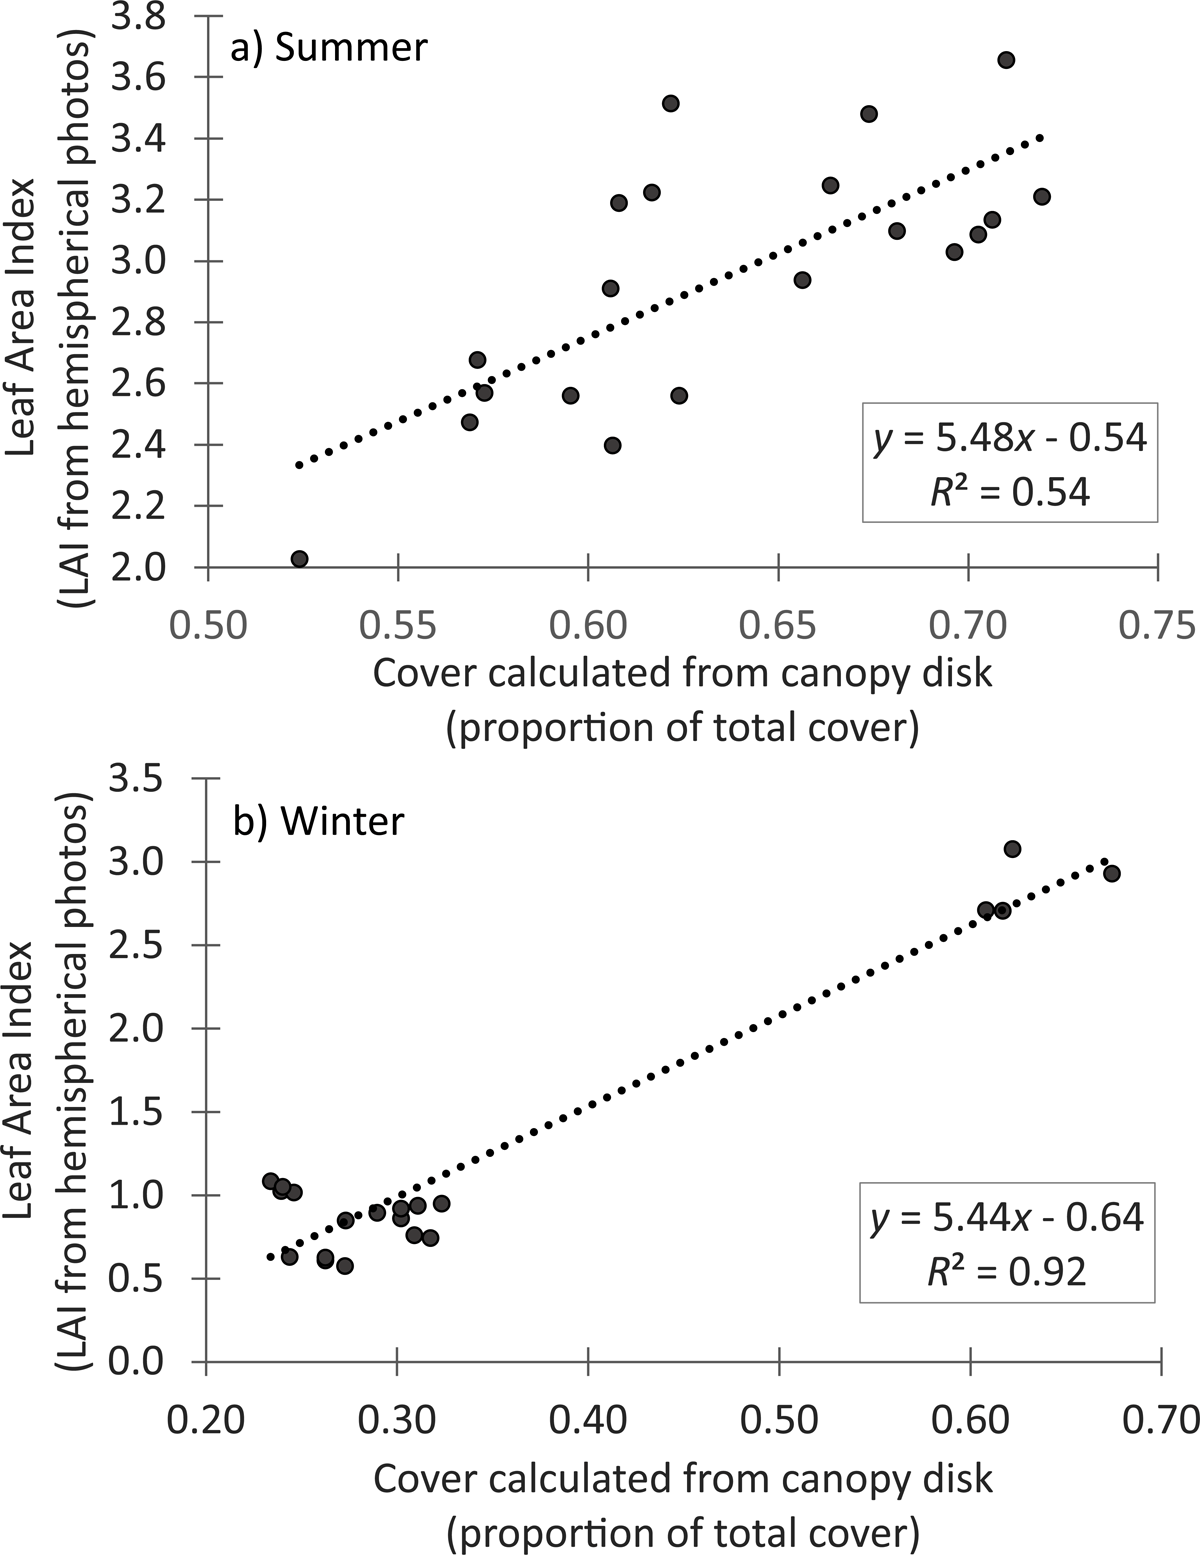
Figure 6
Calibration of the canopy disk through comparison of canopy cover calculated from the mean of the vertical and cardinal measurements against the leaf area index (LAI) calculated from hemispherical photographs (according to Hartikainen et al. 2018). Parallel measurements with the two approaches taken from four measurement points in five different forest stands in Viikki Arboretum, Helsinki, in (a) summer and (b) winter.
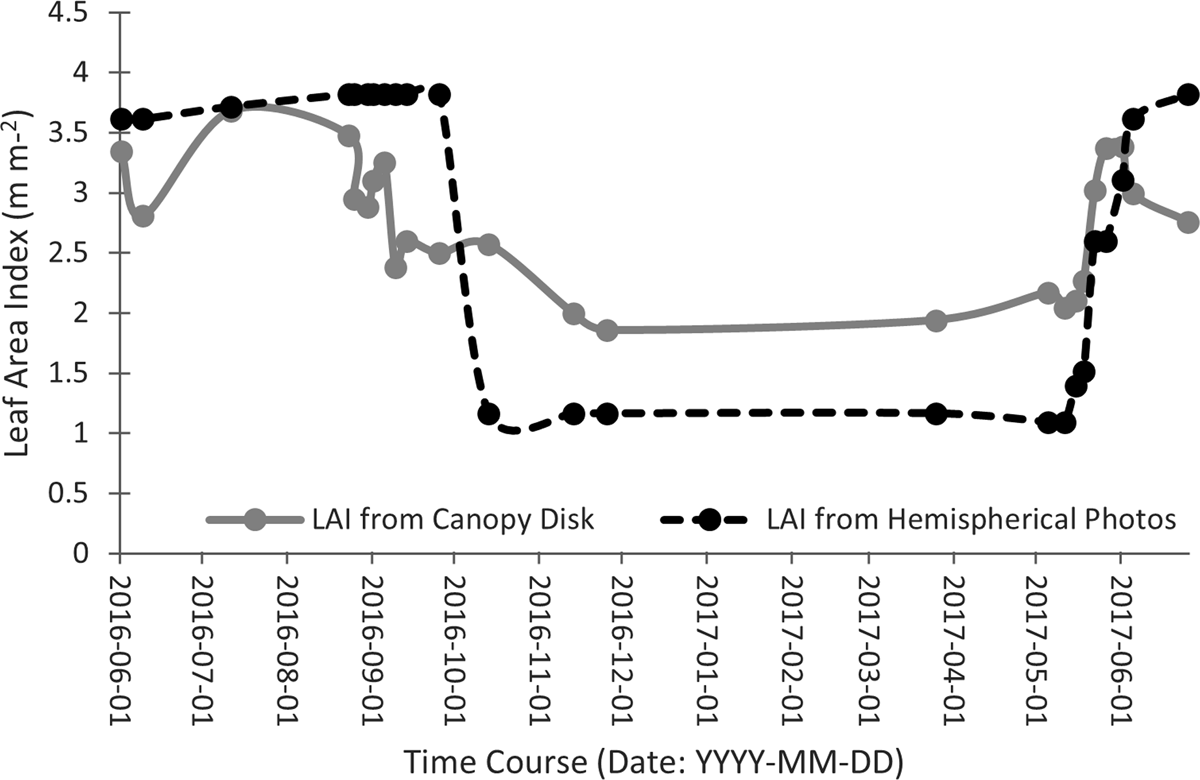
Figure 7
Leaf Area Index (LAI) in the Betula sp. stand at Lammi Biological Station over the one-year period, calculated from data collected through the canopy disk activity compared with LAI calculated from hemispherical photographs.