
Table 1
Classification of hardness and PCCP.
| HARDNESS IN FRENCH DEGREES (°FH) | PRACTICAL CALCIUM CARBONATE PRECIPITATION (PCCP) | ||
|---|---|---|---|
| < 7°fH | Very soft water | (Virtually) no problems with calcium precipitation | PCCP < 0.3 mol/m3 Ca |
| 7–15°fH | Soft water | Slight problems with calcium precipitation | 0.3 < PCCP < 0.6 mol/m3 Ca |
| 15–30°fH | Average hard water | Problems with calcium precipitation | 0.6 < PCCP < 1.0 mol/m3 Ca |
| 30–45°fH | Hard water | Serious problems with calcium precipitation | PCCP > 1.0 mol/ m3 Ca |
| > 45°fH | Very hard water | ||
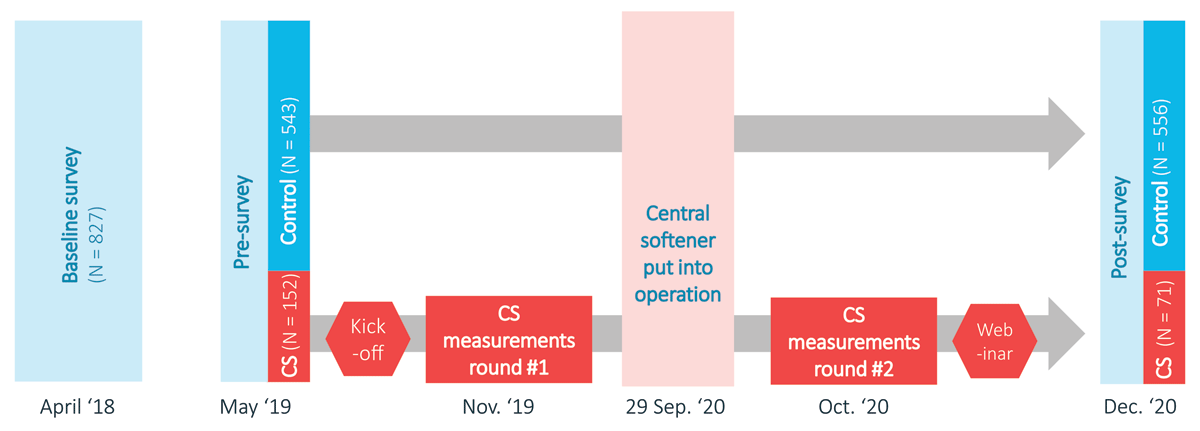
Figure 1
Study design and timeline of activities. All steps followed by the citizen science participants are marked in red. CS: citizen science.
Table 2
Study sample characteristics.
| BASELINE SURVEY | PRE-SURVEY CITIZEN SCIENCE | PRE-SURVEY CONTROL | POST-SURVEY CITIZEN SCIENCE | POST-SURVEY CONTROL | ||
|---|---|---|---|---|---|---|
| YEAR | 2018 | 2019 | 2019 | 2020 | 2020 | |
| Number of participants N | 827 | 152 | 543 | 71 | 556 | |
| Age | 24 or younger | 10.6% | 3.9% | 1.3% | 6.3% | 0.2% |
| 25–34 | 14.0% | 15.1% | 22.4% | 30.2% | 9.5% | |
| 35–44 | 13.7% | 27.6% | 24.8% | 11.1% | 10.4% | |
| 45–54 | 20.3% | 19.7% | 19.0% | 22.2% | 15.6% | |
| 55–64 | 18.7% | 20.4% | 15.9% | 23.8% | 27.5% | |
| 65 or older | 22.6% | 9.9% | 12.8% | 6.3% | 29.7% | |
| Sex | Male | 49.0% | 66.4% | 56.4% | 71.4% | 64.8% |
| Female | 50.9% | 33.6% | 43.6% | 28.6% | 35.2% | |
| Education | Primary school | – | 2.6% | 4.9% | 3.2% | 4.6% |
| Secondary education | 65.3% | 26.3% | 43.6% | 38.1% | 44.5% | |
| Professional bachelor’s degree | 23.7% | 41.4% | 31.8% | 34.9% | 32.8% | |
| Master degree | 11.0% | 29.6% | 19.7% | 23.8% | 18.1% | |
| Perspective | Aware and committed | 21.9% | 37.5% | 23.5% | 40.3% | 26.6% |
| Quality and health concerned | 21.2% | 24.3% | 31.1% | 11.9% | 21.6% | |
| Egalitarian and solidary | 36.6% | 27.6% | 25.8% | 32.8% | 29.9% | |
| Down-to-earth and confident | 20.3% | 10.5% | 19.5% | 14.9% | 21.8% |
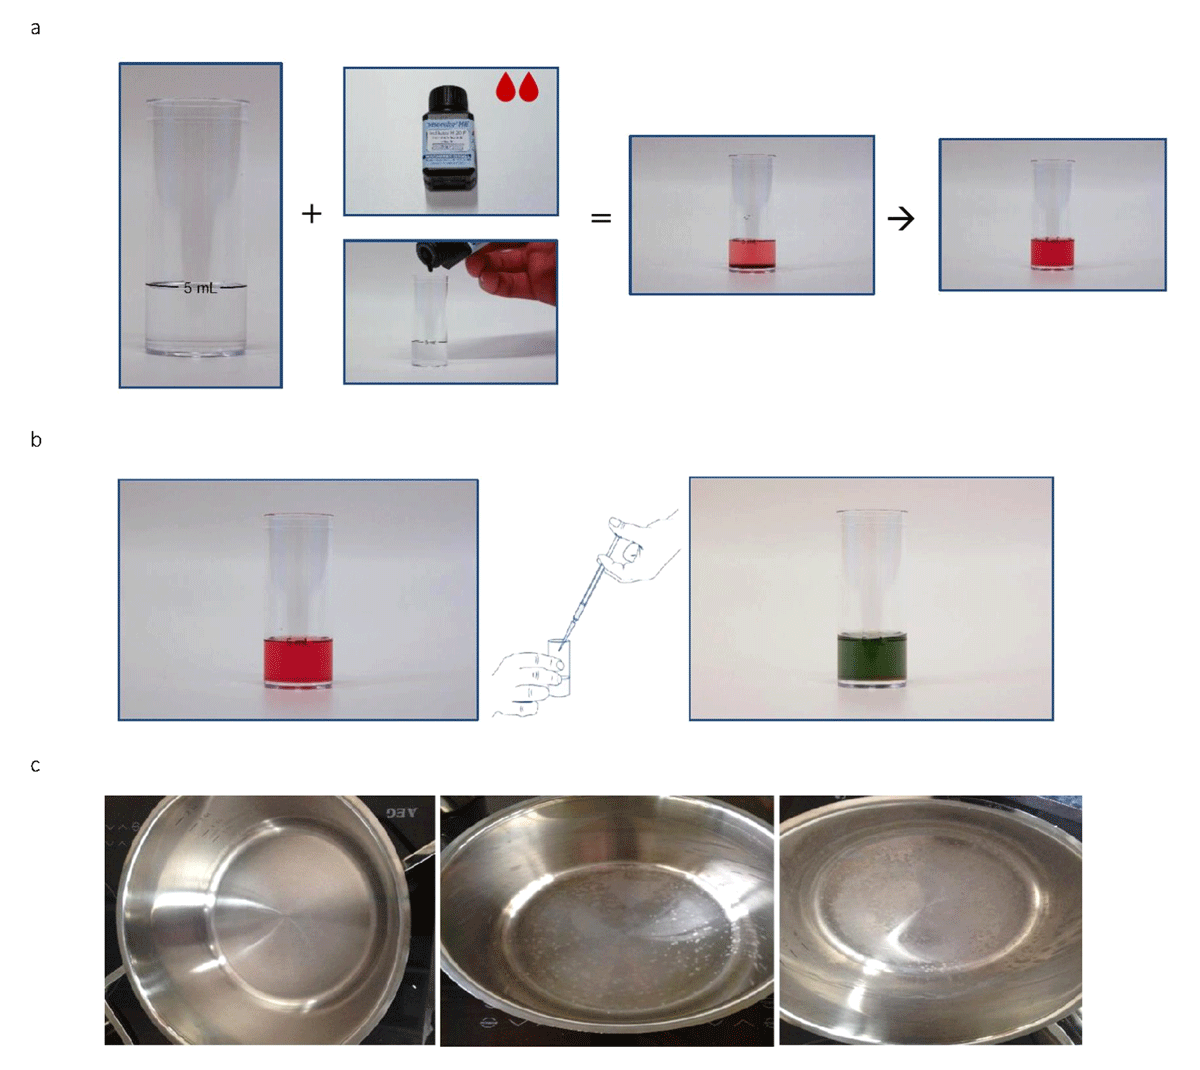
Figure 2
Visualization of different citizen science activities: (a) filling the test tube with 5ml of tap water with pipette and adding 2 drops indicator solution; (b) using a tight plunger syringe to add titration solution dropwise until the solution turns completely green; and (c) visual assessment of cooking pot.
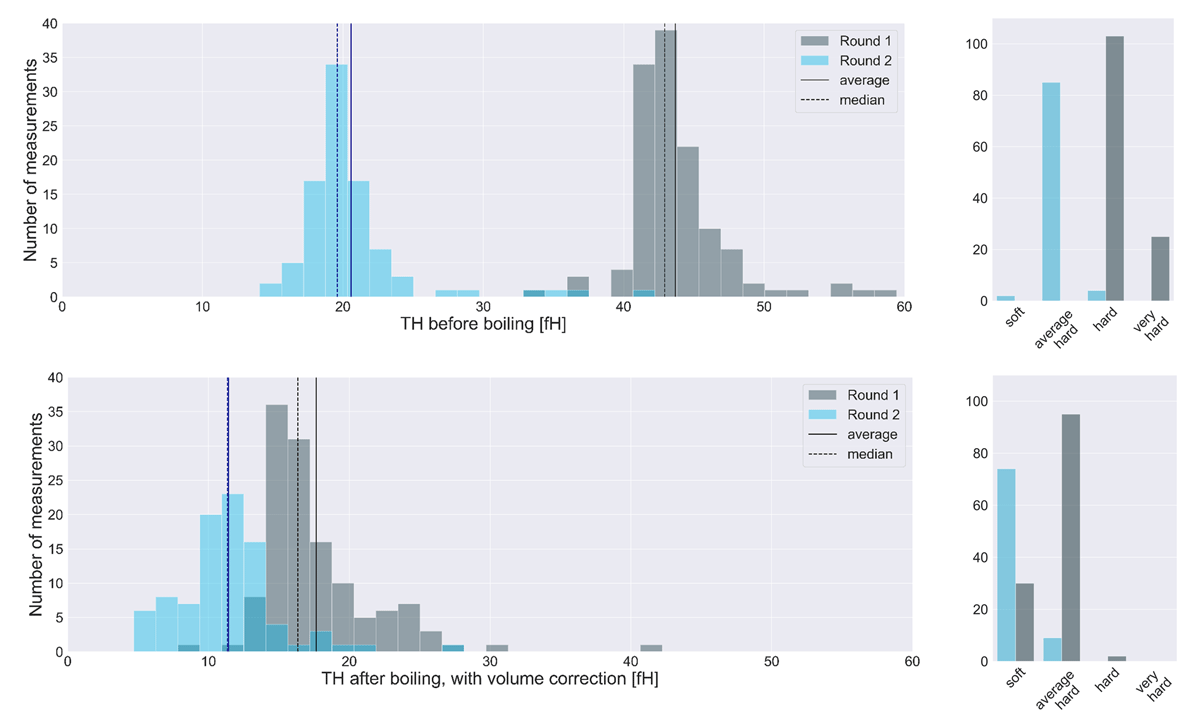
Figure 3
Total hardness (TH) measurements before and after the boiling test.
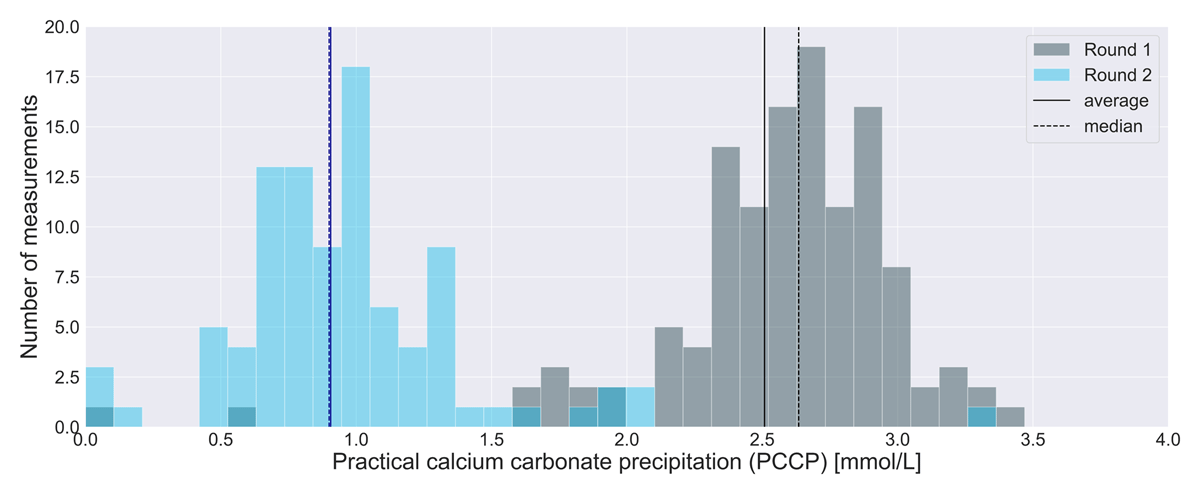
Figure 4
Practical calcium carbonate precipitation (PCCP), derived from hardness measurements.
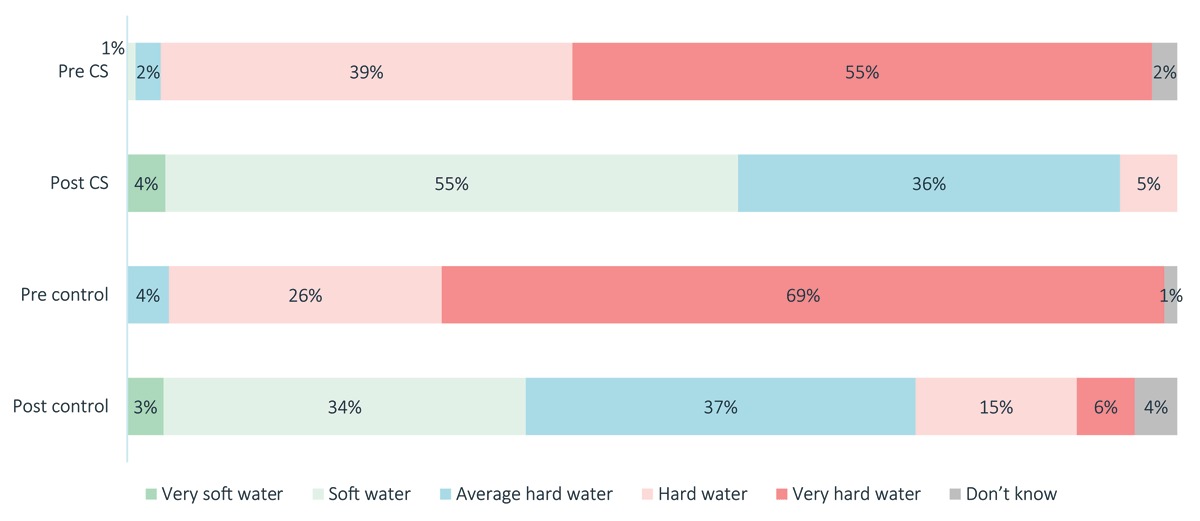
Figure 5
Perceived hardness of water.
Table 3
Perceptions about drinking water, expressed in the range of disagreement/agreement (five possible responses) for health and good taste) and little or many concerns (four possible responses) for the water quality and price increase.
| CITIZEN SCIENCE PARTICIPANTS | ||||||||||
|---|---|---|---|---|---|---|---|---|---|---|
| PRE | POST | |||||||||
| -- | – | o | + | ++ | -- | – | o | + | ++ | |
| Healthy | 0% | 4% | 30% | 47% | 11% | 0% | 0% | 13% | 43% | 43% |
| Good taste | 2% | 11% | 33% | 42% | 10% | 0% | 2% | 2% | 48% | 31% |
| Quality concerns | 6% | 41% | – | 42% | 11% | 33% | 58% | – | 5% | 4% |
| Price increase concerns | 3% | 16% | – | 44% | 36% | 9% | 25% | – | 49% | 16% |
| CONTROL GROUP | ||||||||||
| PRE | POST | |||||||||
| -- | – | o | + | ++ | -- | – | o | + | ++ | |
| Healthy | 4% | 5% | 37% | 31% | 12% | 1% | 3% | 25% | 37% | 25% |
| Good taste | 7% | 14% | 36% | 25% | 13% | 2% | 5% | 29% | 36% | 22% |
| Quality concerns | 6% | 39% | – | 38% | 17% | 21% | 50% | – | 21% | 6% |
| Price increase concerns | 2% | 10% | – | 43% | 44% | 5% | 15% | – | 44% | 35% |
[i] Notes: Pre control, n = 435; Pre CS, n = 142; Post control, n = 497; Post CS, n = 61. Quality and price-concern data are exclusive of customers who recently experienced a malfunction.
Table 4
Experienced inconvenience due to calcium precipitation.
| CITIZEN SCIENCE PARTICIPANTS | CONTROL GROUP | ||||
|---|---|---|---|---|---|
| INCONVENIENCE | PRE | POST | PRE | POST | |
| Cold water | No | 7% | 64% | 7% | 39% |
| A little | 50% | 35% | 31% | 50% | |
| Quite a bit | 25% | 2% | 35% | 7% | |
| Very much | 18% | 0% | 28% | 4% | |
| Warm water | No | 1% | 18% | 2% | 15% |
| A little | 17% | 78% | 17% | 65% | |
| Quite a bit | 42% | 4% | 32% | 14% | |
| Very much | 40% | 0% | 50% | 6% | |
[i] Notes: Pre control, n = 327; pre CS, n = 125; post control, n = 345; post CS, n = 55; data are exclusive of customers with a personal water softener).
Table 5
Average appreciation scores on a scale from 1 to 10.
| CITIZEN SCIENCE PARTICIPANTS | CONTROL GROUP | |||
|---|---|---|---|---|
| PRE | POST | PRE | POST | |
| Quality water | 6.6 | 8.6 | 5.8 | 8 |
| Price/quality ratio of water | 6.3 | 7.6 | 5.4 | 6.8 |
| Confidence in utility | 7.6 | 8.7 | 7.1 | 7.9 |
[i] Notes: Pre control, n = 435; pre CS, n = 142; post control, n = 497; post CS, n = 61. Data are exclusive of customers who recently experienced a malfunction.
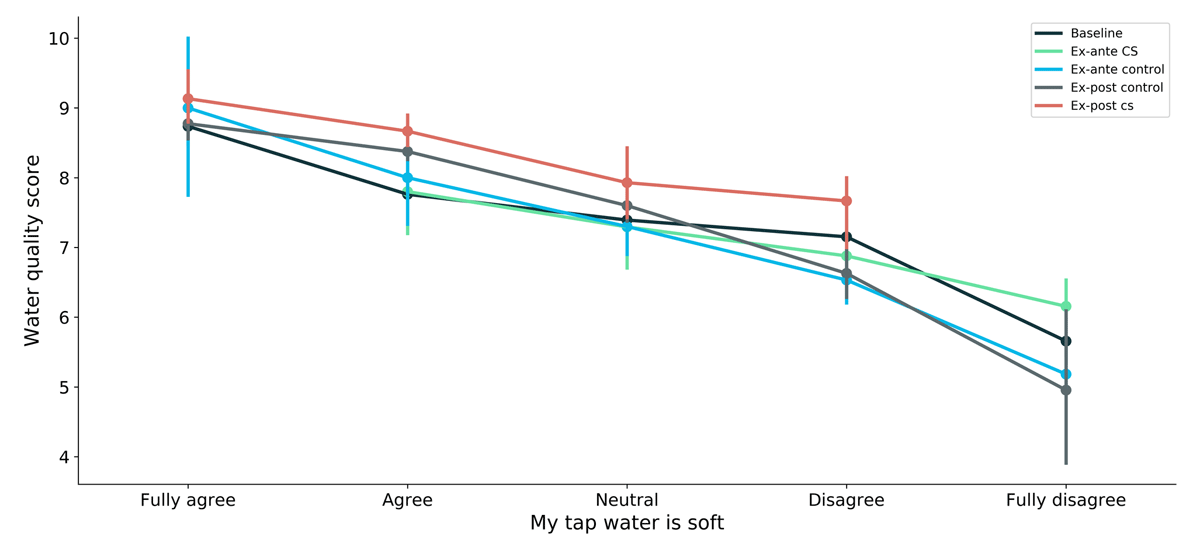
Figure 6
Correlation between the perceived hardness and the quality of water.