
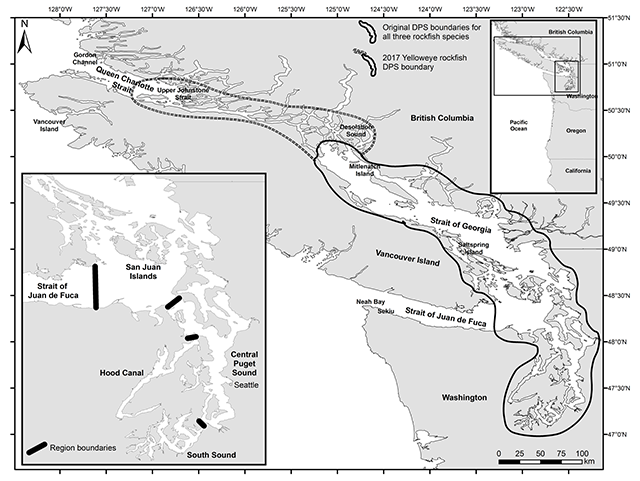
Figure 1
Map of the Puget Sound/Georgia Basin distinct population segment for each of three ESA-listed rockfish species in the original 2010 listing (solid line) and in the 2017 update for yelloweye rockfish (dashed line) and regions sampled (line breaks) with volunteer anglers for genetic analyses.
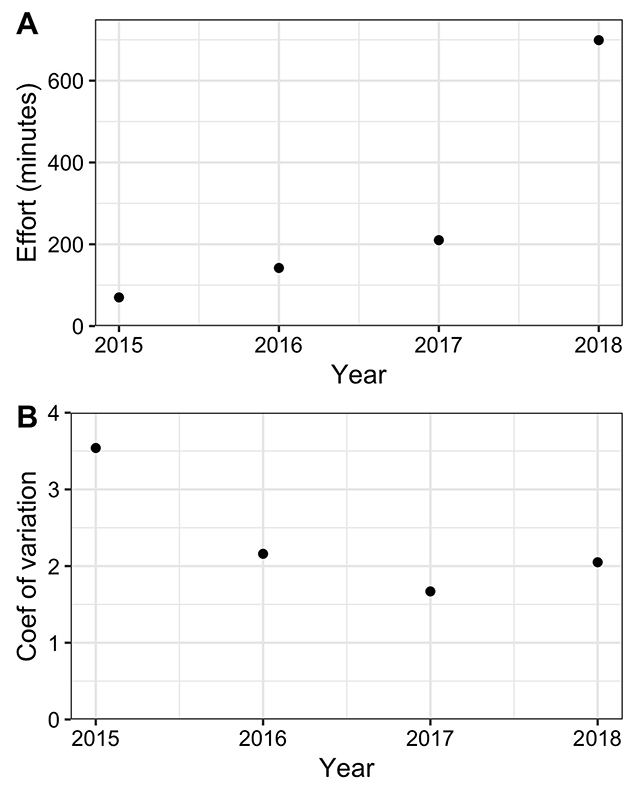
Figure 2
A) Sampling effort and B) coefficient of variation in data collected during citizen science SCUBA diving surveys for young-of-year, juvenile, and adult rockfish in Puget Sound.
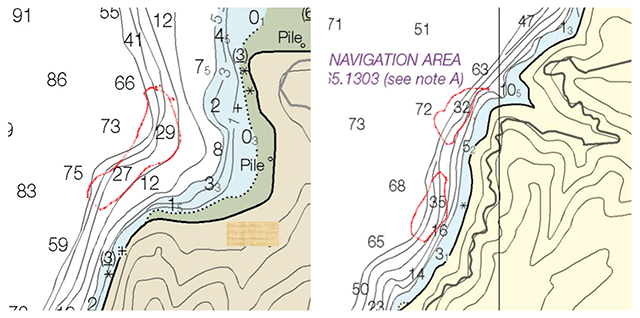
Figure 3
Example of maps showing locations where local anglers described where they used to fish for and catch ESA-listed rockfish.
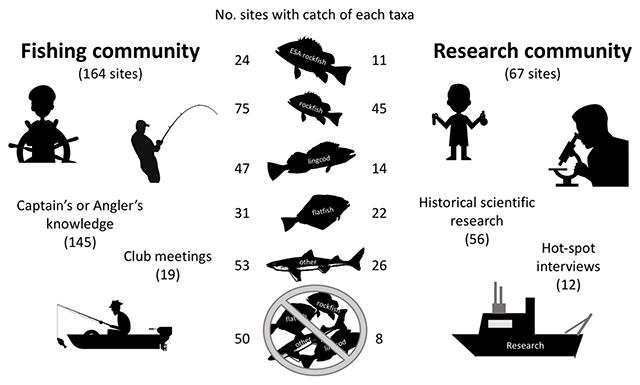
Figure 4
Summary of contributions by recreational fishing and research communities to site selection and number of sites with catch of major Puget Sound taxa categories during the population genetics study of ESA-listed rockfish in Puget Sound, WA, USA. Number of sites in each column will not add up to total number of sites due to multiple taxa being caught at the same sites.
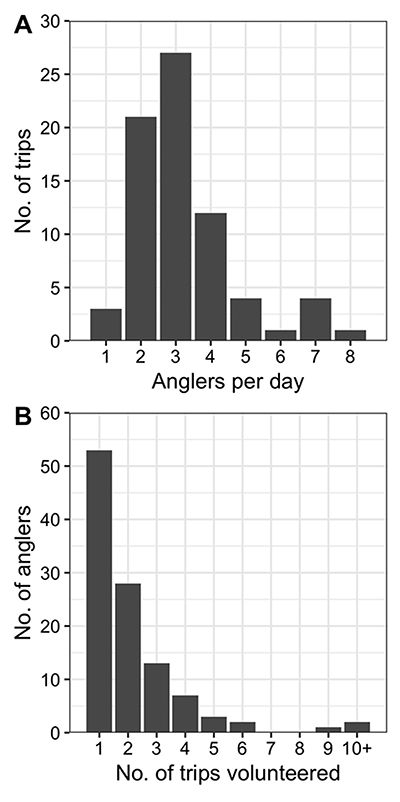
Figure 5
Number of A) anglers per day and B) fishing trips volunteered for by 109 volunteer anglers across 73 fishing trips across the five sampling regions.
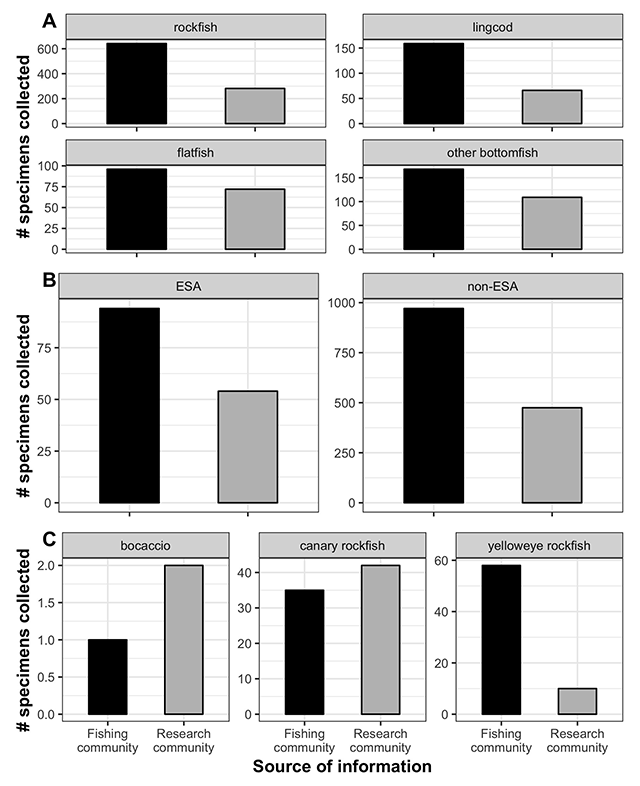
Figure 6
Number of fishes caught and sampled across A) four bottomfish taxa, B) ESA-listed and non-ESA-listed fish, and C) individual ESA-listed rockfish species at sites recommended by the local recreational fishing or scientific research communities across the five geographic regions.
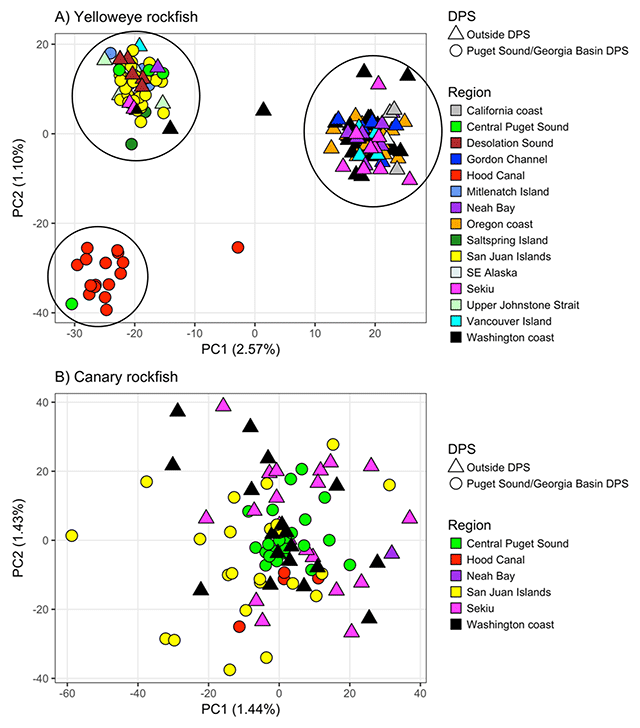
Figure 7
Principal components analysis reveals A) three population clusters for yelloweye rockfish and B) no population structure for canary rockfish across sampled geographic regions. Each symbol represents an individual fish from locations identified by shape and color of symbol. DPS: The original distinct population segment shown in Fig. 1. Reprinted by permission from Springer Nature: Conservation Genetics Andrews et al. 2018.